Request Free Sample ×

Kindly complete the form below to receive a free sample of this Report

* Please use a valid business email

Leading companies partner with us for data-driven Insights

clients tt-cursor
Hero Background

US Fuel Management System Market

ID: MRFR/EnP/14257-HCR
100 Pages
Garvit Vyas
Last Updated: April 06, 2026

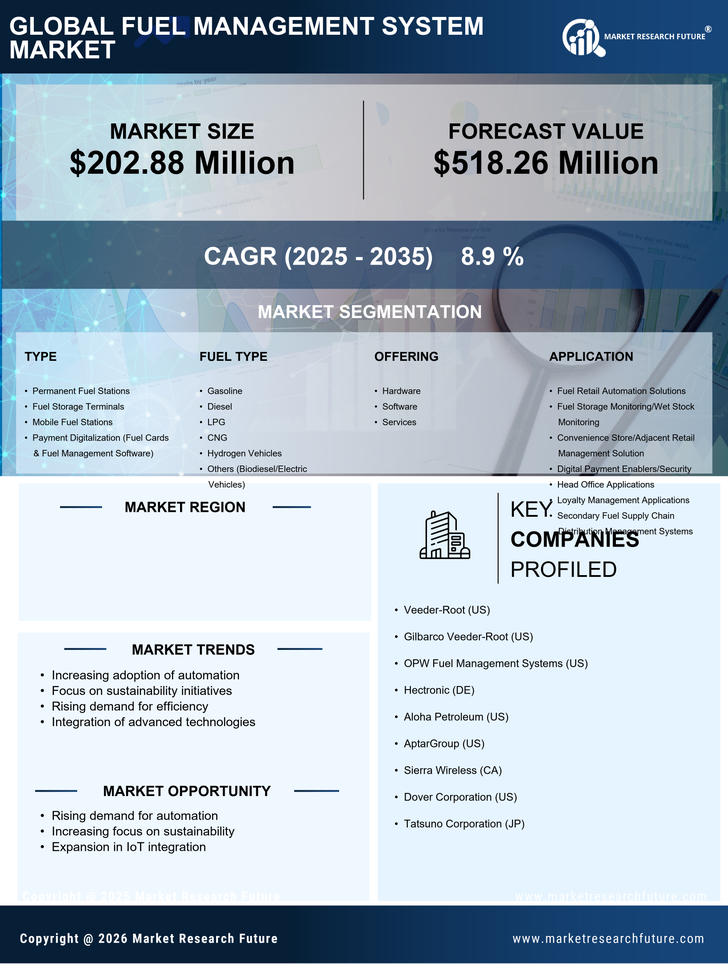
US Fuel Management System Market Research Report By Type (Permanent Fuel Stations, Fuel Storage Terminals, Mobile Fuel Stations, Payment Digitalization (Fuel Cards & Fuel Management Software)), By Fuel Type (Gasoline, Diesel, LPG, CNG, Hydrogen Vehicles, Others - Biodiesel/EV), By Offering (Hardware, Software, Services), By Application (Fuel Retail Automation Solutions, Fuel Storage Monitoring/Wet stock Monitoring, Convenience Store/Adjacent Retail Management Solution, Digital Payment Enablers/Security, Head Office Applications, Loyalty Management Applications, Secondary Fuel Supply Chain Distribution Management System) and By End Use (Logistics & Transportation, Oil & Gas) - Forecast to 2035

Share:
Download PDF ×

We do not share your information with anyone. However, we may send you emails based on your report interest from time to time. You may contact us at any time to opt-out.

US Fuel Management System Market Infographic
Purchase Options
  1. 1 SECTION I: EXECUTIVE SUMMARY AND KEY HIGHLIGHTS
  2.   1.1 EXECUTIVE SUMMARY
  3.     1.1.1 Market Overview
  4.     1.1.2 Key Findings
  5.     1.1.3 Market Segmentation
  6.     1.1.4 Competitive Landscape
  7.     1.1.5 Challenges and Opportunities
  8.     1.1.6 Future Outlook
  9. 2 SECTION II: SCOPING, METHODOLOGY AND MARKET STRUCTURE
  10.   2.1 MARKET INTRODUCTION
  11.     2.1.1 Definition
  12.     2.1.2 Scope of the study
  13.       2.1.2.1 Research Objective
  14.       2.1.2.2 Assumption
  15.       2.1.2.3 Limitations
  16.   2.2 RESEARCH METHODOLOGY
  17.     2.2.1 Overview
  18.     2.2.2 Data Mining
  19.     2.2.3 Secondary Research
  20.     2.2.4 Primary Research
  21.       2.2.4.1 Primary Interviews and Information Gathering Process
  22.       2.2.4.2 Breakdown of Primary Respondents
  23.     2.2.5 Forecasting Model
  24.     2.2.6 Market Size Estimation
  25.       2.2.6.1 Bottom-Up Approach
  26.       2.2.6.2 Top-Down Approach
  27.     2.2.7 Data Triangulation
  28.     2.2.8 Validation
  29. 3 SECTION III: QUALITATIVE ANALYSIS
  30.   3.1 MARKET DYNAMICS
  31.     3.1.1 Overview
  32.     3.1.2 Drivers
  33.     3.1.3 Restraints
  34.     3.1.4 Opportunities
  35.   3.2 MARKET FACTOR ANALYSIS
  36.     3.2.1 Value chain Analysis
  37.     3.2.2 Porter's Five Forces Analysis
  38.       3.2.2.1 Bargaining Power of Suppliers
  39.       3.2.2.2 Bargaining Power of Buyers
  40.       3.2.2.3 Threat of New Entrants
  41.       3.2.2.4 Threat of Substitutes
  42.       3.2.2.5 Intensity of Rivalry
  43.     3.2.3 COVID-19 Impact Analysis
  44.       3.2.3.1 Market Impact Analysis
  45.       3.2.3.2 Regional Impact
  46.       3.2.3.3 Opportunity and Threat Analysis
  47. 4 SECTION IV: QUANTITATIVE ANALYSIS
  48.   4.1 Pharmaceutical, BY Type (USD Million)
  49.     4.1.1 Permanent Fuel Stations
  50.     4.1.2 Fuel Storage Terminals
  51.     4.1.3 Mobile Fuel Stations
  52.     4.1.4 Payment Digitalization (Fuel Cards & Fuel Management Software)
  53.   4.2 Pharmaceutical, BY Fuel Type (USD Million)
  54.     4.2.1 Gasoline
  55.     4.2.2 Diesel
  56.     4.2.3 LPG
  57.     4.2.4 CNG
  58.     4.2.5 Hydrogen Vehicles
  59.     4.2.6 Others (Biodiesel/Electric Vehicles)
  60.   4.3 Pharmaceutical, BY Offering (USD Million)
  61.     4.3.1 Hardware
  62.     4.3.2 Software
  63.     4.3.3 Services
  64.   4.4 Pharmaceutical, BY Application (USD Million)
  65.     4.4.1 Fuel Retail Automation Solutions
  66.     4.4.2 Fuel Storage Monitoring/Wet Stock Monitoring
  67.     4.4.3 Convenience Store/Adjacent Retail Management Solution
  68.     4.4.4 Digital Payment Enablers/Security
  69.     4.4.5 Head Office Applications
  70.     4.4.6 Loyalty Management Applications
  71.     4.4.7 Secondary Fuel Supply Chain Distribution Management Systems
  72.   4.5 Pharmaceutical, BY End Use (USD Million)
  73.     4.5.1 Logistics & Transportation
  74.     4.5.2 Oil & Gas
  75. 5 SECTION V: COMPETITIVE ANALYSIS
  76.   5.1 Competitive Landscape
  77.     5.1.1 Overview
  78.     5.1.2 Competitive Analysis
  79.     5.1.3 Market share Analysis
  80.     5.1.4 Major Growth Strategy in the Pharmaceutical
  81.     5.1.5 Competitive Benchmarking
  82.     5.1.6 Leading Players in Terms of Number of Developments in the Pharmaceutical
  83.     5.1.7 Key developments and growth strategies
  84.       5.1.7.1 New Product Launch/Service Deployment
  85.       5.1.7.2 Merger & Acquisitions
  86.       5.1.7.3 Joint Ventures
  87.     5.1.8 Major Players Financial Matrix
  88.       5.1.8.1 Sales and Operating Income
  89.       5.1.8.2 Major Players R&D Expenditure. 2023
  90.   5.2 Company Profiles
  91.     5.2.1 Veeder-Root (US)
  92.       5.2.1.1 Financial Overview
  93.       5.2.1.2 Products Offered
  94.       5.2.1.3 Key Developments
  95.       5.2.1.4 SWOT Analysis
  96.       5.2.1.5 Key Strategies
  97.     5.2.2 Gilbarco Veeder-Root (US)
  98.       5.2.2.1 Financial Overview
  99.       5.2.2.2 Products Offered
  100.       5.2.2.3 Key Developments
  101.       5.2.2.4 SWOT Analysis
  102.       5.2.2.5 Key Strategies
  103.     5.2.3 OPW Fuel Management Systems (US)
  104.       5.2.3.1 Financial Overview
  105.       5.2.3.2 Products Offered
  106.       5.2.3.3 Key Developments
  107.       5.2.3.4 SWOT Analysis
  108.       5.2.3.5 Key Strategies
  109.     5.2.4 Hectronic (DE)
  110.       5.2.4.1 Financial Overview
  111.       5.2.4.2 Products Offered
  112.       5.2.4.3 Key Developments
  113.       5.2.4.4 SWOT Analysis
  114.       5.2.4.5 Key Strategies
  115.     5.2.5 Aloha Petroleum (US)
  116.       5.2.5.1 Financial Overview
  117.       5.2.5.2 Products Offered
  118.       5.2.5.3 Key Developments
  119.       5.2.5.4 SWOT Analysis
  120.       5.2.5.5 Key Strategies
  121.     5.2.6 AptarGroup (US)
  122.       5.2.6.1 Financial Overview
  123.       5.2.6.2 Products Offered
  124.       5.2.6.3 Key Developments
  125.       5.2.6.4 SWOT Analysis
  126.       5.2.6.5 Key Strategies
  127.     5.2.7 Sierra Wireless (CA)
  128.       5.2.7.1 Financial Overview
  129.       5.2.7.2 Products Offered
  130.       5.2.7.3 Key Developments
  131.       5.2.7.4 SWOT Analysis
  132.       5.2.7.5 Key Strategies
  133.     5.2.8 Dover Corporation (US)
  134.       5.2.8.1 Financial Overview
  135.       5.2.8.2 Products Offered
  136.       5.2.8.3 Key Developments
  137.       5.2.8.4 SWOT Analysis
  138.       5.2.8.5 Key Strategies
  139.     5.2.9 Tatsuno Corporation (JP)
  140.       5.2.9.1 Financial Overview
  141.       5.2.9.2 Products Offered
  142.       5.2.9.3 Key Developments
  143.       5.2.9.4 SWOT Analysis
  144.       5.2.9.5 Key Strategies
  145.   5.3 Appendix
  146.     5.3.1 References
  147.     5.3.2 Related Reports
  148. 6 LIST OF FIGURES
  149.   6.1 MARKET SYNOPSIS
  150.   6.2 US MARKET ANALYSIS BY TYPE
  151.   6.3 US MARKET ANALYSIS BY FUEL TYPE
  152.   6.4 US MARKET ANALYSIS BY OFFERING
  153.   6.5 US MARKET ANALYSIS BY APPLICATION
  154.   6.6 US MARKET ANALYSIS BY END USE
  155.   6.7 KEY BUYING CRITERIA OF PHARMACEUTICAL
  156.   6.8 RESEARCH PROCESS OF MRFR
  157.   6.9 DRO ANALYSIS OF PHARMACEUTICAL
  158.   6.10 DRIVERS IMPACT ANALYSIS: PHARMACEUTICAL
  159.   6.11 RESTRAINTS IMPACT ANALYSIS: PHARMACEUTICAL
  160.   6.12 SUPPLY / VALUE CHAIN: PHARMACEUTICAL
  161.   6.13 PHARMACEUTICAL, BY TYPE, 2024 (% SHARE)
  162.   6.14 PHARMACEUTICAL, BY TYPE, 2024 TO 2035 (USD Million)
  163.   6.15 PHARMACEUTICAL, BY FUEL TYPE, 2024 (% SHARE)
  164.   6.16 PHARMACEUTICAL, BY FUEL TYPE, 2024 TO 2035 (USD Million)
  165.   6.17 PHARMACEUTICAL, BY OFFERING, 2024 (% SHARE)
  166.   6.18 PHARMACEUTICAL, BY OFFERING, 2024 TO 2035 (USD Million)
  167.   6.19 PHARMACEUTICAL, BY APPLICATION, 2024 (% SHARE)
  168.   6.20 PHARMACEUTICAL, BY APPLICATION, 2024 TO 2035 (USD Million)
  169.   6.21 PHARMACEUTICAL, BY END USE, 2024 (% SHARE)
  170.   6.22 PHARMACEUTICAL, BY END USE, 2024 TO 2035 (USD Million)
  171.   6.23 BENCHMARKING OF MAJOR COMPETITORS
  172. 7 LIST OF TABLES
  173.   7.1 LIST OF ASSUMPTIONS
  174.     7.1.1
  175.   7.2 US MARKET SIZE ESTIMATES; FORECAST
  176.     7.2.1 BY TYPE, 2025-2035 (USD Million)
  177.     7.2.2 BY FUEL TYPE, 2025-2035 (USD Million)
  178.     7.2.3 BY OFFERING, 2025-2035 (USD Million)
  179.     7.2.4 BY APPLICATION, 2025-2035 (USD Million)
  180.     7.2.5 BY END USE, 2025-2035 (USD Million)
  181.   7.3 PRODUCT LAUNCH/PRODUCT DEVELOPMENT/APPROVAL
  182.     7.3.1
  183.   7.4 ACQUISITION/PARTNERSHIP
  184.     7.4.1

US Pharmaceutical Market Segmentation

Pharmaceutical By Type (USD Million, 2025-2035)

  • Permanent Fuel Stations
  • Fuel Storage Terminals
  • Mobile Fuel Stations
  • Payment Digitalization (Fuel Cards & Fuel Management Software)

Pharmaceutical By Fuel Type (USD Million, 2025-2035)

  • Gasoline
  • Diesel
  • LPG
  • CNG
  • Hydrogen Vehicles
  • Others (Biodiesel/Electric Vehicles)

Pharmaceutical By Offering (USD Million, 2025-2035)

  • Hardware
  • Software
  • Services

Pharmaceutical By Application (USD Million, 2025-2035)

  • Fuel Retail Automation Solutions
  • Fuel Storage Monitoring/Wet Stock Monitoring
  • Convenience Store/Adjacent Retail Management Solution
  • Digital Payment Enablers/Security
  • Head Office Applications
  • Loyalty Management Applications
  • Secondary Fuel Supply Chain Distribution Management Systems

Pharmaceutical By End Use (USD Million, 2025-2035)

  • Logistics & Transportation
  • Oil & Gas

Compare Licence

×
Features License Type
Single User Multiuser License Enterprise User
Price $4,950 $5,950 $7,250
Maximum User Access Limit 1 User Upto 10 Users Unrestricted Access Throughout the Organization
Free Customization
Direct Access to Analyst
Deliverable Format
Platform Access
Discount on Next Purchase 10% 15% 15%
Printable Versions