

US Food, Beverages & Nutrition Market Segmentation
Food, Beverages & Nutrition By Product (USD Million, 2025-2035)
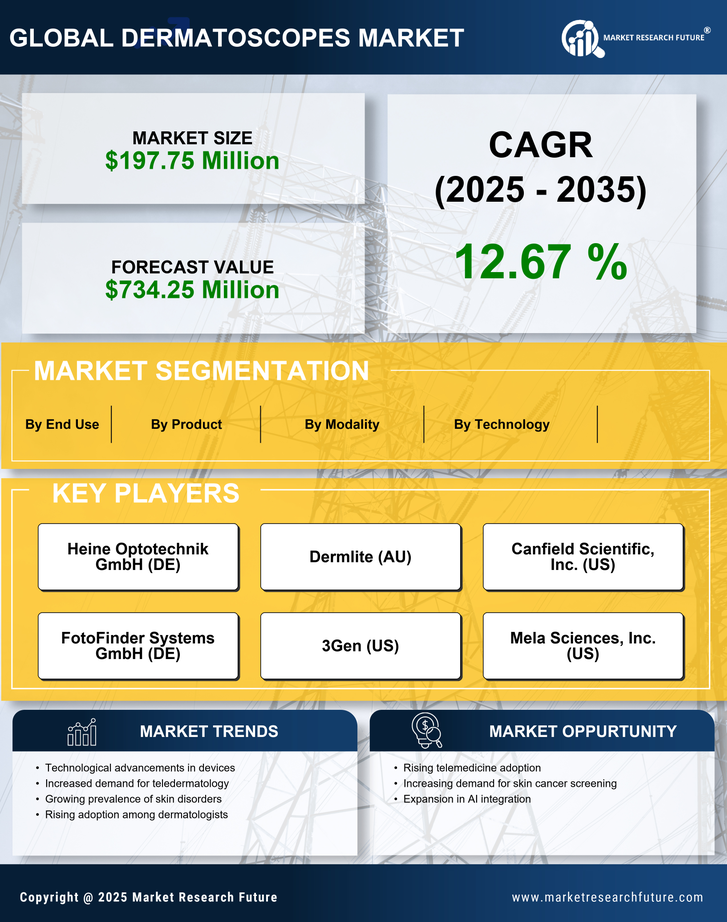
- Contact Dermatoscope
- Hybrid Dermatoscope
- Noncontact Dermatoscope
Food, Beverages & Nutrition By Technology (USD Million, 2025-2035)
- LED
- Xenon
- Halogen
- Ultraviolet
Food, Beverages & Nutrition By Modality (USD Million, 2025-2035)
- Handheld
- Trolley Mounted
- Headband
Food, Beverages & Nutrition By End Use (USD Million, 2025-2035)
- Dermatology Clinics
- Hospitals


