Request Free Sample ×

Kindly complete the form below to receive a free sample of this Report

* Please use a valid business email

Leading companies partner with us for data-driven Insights

clients tt-cursor
Hero Background

US Deformity Market

ID: MRFR/Pharma/18368-HCR
100 Pages
Satyendra Maurya
Last Updated: April 06, 2026

US Deformity Market Research Report By Type of Deformity (Congenital Deformities, Acquired Deformities, Idiopathic Deformities, Post-Traumatic Deformities), By Treatment Method (Surgical Treatment, Non-Surgical Treatment, Rehabilitation Therapy, Assistive Devices), By Patient Demographics (Pediatric Patients, Adult Patients, Geriatric Patients) and By Severity Level (Mild Deformities, Moderate Deformities, Severe Deformities) - Growth & Industry Forecast 2025 To 2035

Share:
Download PDF ×

We do not share your information with anyone. However, we may send you emails based on your report interest from time to time. You may contact us at any time to opt-out.

US Deformity Market Infographic
Purchase Options
  1. 1 SECTION I: EXECUTIVE SUMMARY AND KEY HIGHLIGHTS
  2.   1.1 EXECUTIVE SUMMARY
  3.     1.1.1 Market Overview
  4.     1.1.2 Key Findings
  5.     1.1.3 Market Segmentation
  6.     1.1.4 Competitive Landscape
  7.     1.1.5 Challenges and Opportunities
  8.     1.1.6 Future Outlook
  9. 2 SECTION II: SCOPING, METHODOLOGY AND MARKET STRUCTURE
  10.   2.1 MARKET INTRODUCTION
  11.     2.1.1 Definition
  12.     2.1.2 Scope of the study
  13.       2.1.2.1 Research Objective
  14.       2.1.2.2 Assumption
  15.       2.1.2.3 Limitations
  16.   2.2 RESEARCH METHODOLOGY
  17.     2.2.1 Overview
  18.     2.2.2 Data Mining
  19.     2.2.3 Secondary Research
  20.     2.2.4 Primary Research
  21.       2.2.4.1 Primary Interviews and Information Gathering Process
  22.       2.2.4.2 Breakdown of Primary Respondents
  23.     2.2.5 Forecasting Model
  24.     2.2.6 Market Size Estimation
  25.       2.2.6.1 Bottom-Up Approach
  26.       2.2.6.2 Top-Down Approach
  27.     2.2.7 Data Triangulation
  28.     2.2.8 Validation
  29. 3 SECTION III: QUALITATIVE ANALYSIS
  30.   3.1 MARKET DYNAMICS
  31.     3.1.1 Overview
  32.     3.1.2 Drivers
  33.     3.1.3 Restraints
  34.     3.1.4 Opportunities
  35.   3.2 MARKET FACTOR ANALYSIS
  36.     3.2.1 Value chain Analysis
  37.     3.2.2 Porter's Five Forces Analysis
  38.       3.2.2.1 Bargaining Power of Suppliers
  39.       3.2.2.2 Bargaining Power of Buyers
  40.       3.2.2.3 Threat of New Entrants
  41.       3.2.2.4 Threat of Substitutes
  42.       3.2.2.5 Intensity of Rivalry
  43.     3.2.3 COVID-19 Impact Analysis
  44.       3.2.3.1 Market Impact Analysis
  45.       3.2.3.2 Regional Impact
  46.       3.2.3.3 Opportunity and Threat Analysis
  47. 4 SECTION IV: QUANTITATIVE ANALYSIS
  48.   4.1 Chemicals and Materials, BY Type of Deformity (USD Million)
  49.     4.1.1 Congenital Deformities
  50.     4.1.2 Acquired Deformities
  51.     4.1.3 Idiopathic Deformities
  52.     4.1.4 Post-Traumatic Deformities
  53.   4.2 Chemicals and Materials, BY Treatment Method (USD Million)
  54.     4.2.1 Surgical Treatment
  55.     4.2.2 Non-Surgical Treatment
  56.     4.2.3 Rehabilitation Therapy
  57.     4.2.4 Assistive Devices
  58.   4.3 Chemicals and Materials, BY Patient Demographics (USD Million)
  59.     4.3.1 Pediatric Patients
  60.     4.3.2 Adult Patients
  61.     4.3.3 Geriatric Patients
  62.   4.4 Chemicals and Materials, BY Severity Level (USD Million)
  63.     4.4.1 Mild Deformities
  64.     4.4.2 Moderate Deformities
  65.     4.4.3 Severe Deformities
  66. 5 SECTION V: COMPETITIVE ANALYSIS
  67.   5.1 Competitive Landscape
  68.     5.1.1 Overview
  69.     5.1.2 Competitive Analysis
  70.     5.1.3 Market share Analysis
  71.     5.1.4 Major Growth Strategy in the Chemicals and Materials
  72.     5.1.5 Competitive Benchmarking
  73.     5.1.6 Leading Players in Terms of Number of Developments in the Chemicals and Materials
  74.     5.1.7 Key developments and growth strategies
  75.       5.1.7.1 New Product Launch/Service Deployment
  76.       5.1.7.2 Merger & Acquisitions
  77.       5.1.7.3 Joint Ventures
  78.     5.1.8 Major Players Financial Matrix
  79.       5.1.8.1 Sales and Operating Income
  80.       5.1.8.2 Major Players R&D Expenditure. 2023
  81.   5.2 Company Profiles
  82.     5.2.1 Stryker (US)
  83.       5.2.1.1 Financial Overview
  84.       5.2.1.2 Products Offered
  85.       5.2.1.3 Key Developments
  86.       5.2.1.4 SWOT Analysis
  87.       5.2.1.5 Key Strategies
  88.     5.2.2 Zimmer Biomet (US)
  89.       5.2.2.1 Financial Overview
  90.       5.2.2.2 Products Offered
  91.       5.2.2.3 Key Developments
  92.       5.2.2.4 SWOT Analysis
  93.       5.2.2.5 Key Strategies
  94.     5.2.3 DePuy Synthes (US)
  95.       5.2.3.1 Financial Overview
  96.       5.2.3.2 Products Offered
  97.       5.2.3.3 Key Developments
  98.       5.2.3.4 SWOT Analysis
  99.       5.2.3.5 Key Strategies
  100.     5.2.4 Medtronic (US)
  101.       5.2.4.1 Financial Overview
  102.       5.2.4.2 Products Offered
  103.       5.2.4.3 Key Developments
  104.       5.2.4.4 SWOT Analysis
  105.       5.2.4.5 Key Strategies
  106.     5.2.5 Smith & Nephew (GB)
  107.       5.2.5.1 Financial Overview
  108.       5.2.5.2 Products Offered
  109.       5.2.5.3 Key Developments
  110.       5.2.5.4 SWOT Analysis
  111.       5.2.5.5 Key Strategies
  112.     5.2.6 NuVasive (US)
  113.       5.2.6.1 Financial Overview
  114.       5.2.6.2 Products Offered
  115.       5.2.6.3 Key Developments
  116.       5.2.6.4 SWOT Analysis
  117.       5.2.6.5 Key Strategies
  118.     5.2.7 Orthofix (US)
  119.       5.2.7.1 Financial Overview
  120.       5.2.7.2 Products Offered
  121.       5.2.7.3 Key Developments
  122.       5.2.7.4 SWOT Analysis
  123.       5.2.7.5 Key Strategies
  124.     5.2.8 Amedica Corporation (US)
  125.       5.2.8.1 Financial Overview
  126.       5.2.8.2 Products Offered
  127.       5.2.8.3 Key Developments
  128.       5.2.8.4 SWOT Analysis
  129.       5.2.8.5 Key Strategies
  130.     5.2.9 K2M Group Holdings (US)
  131.       5.2.9.1 Financial Overview
  132.       5.2.9.2 Products Offered
  133.       5.2.9.3 Key Developments
  134.       5.2.9.4 SWOT Analysis
  135.       5.2.9.5 Key Strategies
  136.   5.3 Appendix
  137.     5.3.1 References
  138.     5.3.2 Related Reports
  139. 6 LIST OF FIGURES
  140.   6.1 MARKET SYNOPSIS
  141.   6.2 US MARKET ANALYSIS BY TYPE OF DEFORMITY
  142.   6.3 US MARKET ANALYSIS BY TREATMENT METHOD
  143.   6.4 US MARKET ANALYSIS BY PATIENT DEMOGRAPHICS
  144.   6.5 US MARKET ANALYSIS BY SEVERITY LEVEL
  145.   6.6 KEY BUYING CRITERIA OF CHEMICALS AND MATERIALS
  146.   6.7 RESEARCH PROCESS OF MRFR
  147.   6.8 DRO ANALYSIS OF CHEMICALS AND MATERIALS
  148.   6.9 DRIVERS IMPACT ANALYSIS: CHEMICALS AND MATERIALS
  149.   6.10 RESTRAINTS IMPACT ANALYSIS: CHEMICALS AND MATERIALS
  150.   6.11 SUPPLY / VALUE CHAIN: CHEMICALS AND MATERIALS
  151.   6.12 CHEMICALS AND MATERIALS, BY TYPE OF DEFORMITY, 2024 (% SHARE)
  152.   6.13 CHEMICALS AND MATERIALS, BY TYPE OF DEFORMITY, 2024 TO 2035 (USD Million)
  153.   6.14 CHEMICALS AND MATERIALS, BY TREATMENT METHOD, 2024 (% SHARE)
  154.   6.15 CHEMICALS AND MATERIALS, BY TREATMENT METHOD, 2024 TO 2035 (USD Million)
  155.   6.16 CHEMICALS AND MATERIALS, BY PATIENT DEMOGRAPHICS, 2024 (% SHARE)
  156.   6.17 CHEMICALS AND MATERIALS, BY PATIENT DEMOGRAPHICS, 2024 TO 2035 (USD Million)
  157.   6.18 CHEMICALS AND MATERIALS, BY SEVERITY LEVEL, 2024 (% SHARE)
  158.   6.19 CHEMICALS AND MATERIALS, BY SEVERITY LEVEL, 2024 TO 2035 (USD Million)
  159.   6.20 BENCHMARKING OF MAJOR COMPETITORS
  160. 7 LIST OF TABLES
  161.   7.1 LIST OF ASSUMPTIONS
  162.     7.1.1
  163.   7.2 US MARKET SIZE ESTIMATES; FORECAST
  164.     7.2.1 BY TYPE OF DEFORMITY, 2025-2035 (USD Million)
  165.     7.2.2 BY TREATMENT METHOD, 2025-2035 (USD Million)
  166.     7.2.3 BY PATIENT DEMOGRAPHICS, 2025-2035 (USD Million)
  167.     7.2.4 BY SEVERITY LEVEL, 2025-2035 (USD Million)
  168.   7.3 PRODUCT LAUNCH/PRODUCT DEVELOPMENT/APPROVAL
  169.     7.3.1
  170.   7.4 ACQUISITION/PARTNERSHIP
  171.     7.4.1

US Chemicals and Materials Market Segmentation

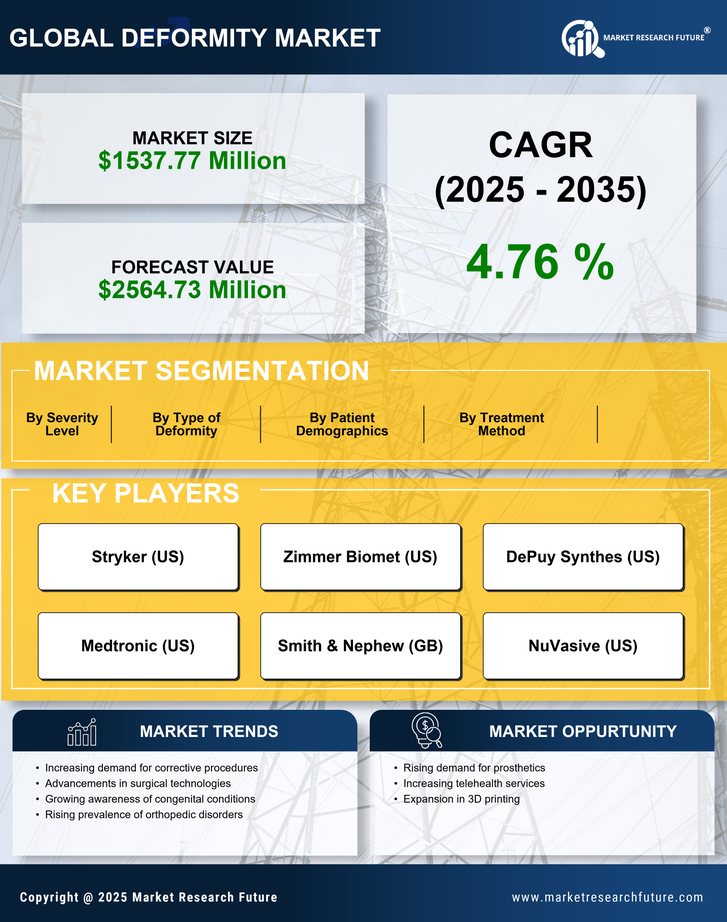
Chemicals and Materials By Type of Deformity (USD Million, 2025-2035)

  • Congenital Deformities
  • Acquired Deformities
  • Idiopathic Deformities
  • Post-Traumatic Deformities

Chemicals and Materials By Treatment Method (USD Million, 2025-2035)

  • Surgical Treatment
  • Non-Surgical Treatment
  • Rehabilitation Therapy
  • Assistive Devices

Chemicals and Materials By Patient Demographics (USD Million, 2025-2035)

  • Pediatric Patients
  • Adult Patients
  • Geriatric Patients

Chemicals and Materials By Severity Level (USD Million, 2025-2035)

  • Mild Deformities
  • Moderate Deformities
  • Severe Deformities

Compare Licence

×
Features License Type
Single User Multiuser License Enterprise User
Price $4,950 $5,950 $7,250
Maximum User Access Limit 1 User Upto 10 Users Unrestricted Access Throughout the Organization
Free Customization
Direct Access to Analyst
Deliverable Format
Platform Access
Discount on Next Purchase 10% 15% 15%
Printable Versions