Request Free Sample ×

Kindly complete the form below to receive a free sample of this Report

* Please use a valid business email

Leading companies partner with us for data-driven Insights

clients tt-cursor
Hero Background

US Chondrosarcoma Market

ID: MRFR/Pharma/17472-HCR
100 Pages
Satyendra Maurya
Last Updated: April 06, 2026

US Chondrosarcoma Market Research Report: Size, Share, Trend Analysis By Types (Conventional chondrosarcoma, Clear cell chondrosarcoma, Myxoid chondrosarcoma, Mesenchymal chondrosarcoma, Dedifferentiated chondrosarcoma, others), By Diagnosis (Biopsy, Imaging, others), By Treatment (Surgery, Therapies, Hemipelvectomy, others) and By End Users (hospitals and clinics, medical research centers, academic institutes, others) - Growth Outlook & Industry Forecast 2025 To 2035

Share:
Download PDF ×

We do not share your information with anyone. However, we may send you emails based on your report interest from time to time. You may contact us at any time to opt-out.

  1. 1 SECTION I: EXECUTIVE SUMMARY AND KEY HIGHLIGHTS
    1. 1.1 EXECUTIVE SUMMARY
      1. 1.1.1 Market Overview
      2. 1.1.2 Key Findings
      3. 1.1.3 Market Segmentation
      4. 1.1.4 Competitive Landscape
      5. 1.1.5 Challenges and Opportunities
      6. 1.1.6 Future Outlook
  2. 2 SECTION II: SCOPING, METHODOLOGY AND MARKET STRUCTURE
    1. 2.1 MARKET INTRODUCTION
      1. 2.1.1 Definition
      2. 2.1.2 Scope of the study
        1. 2.1.2.1 Research Objective
        2. 2.1.2.2 Assumption
        3. 2.1.2.3 Limitations
    2. 2.2 RESEARCH METHODOLOGY
      1. 2.2.1 Overview
      2. 2.2.2 Data Mining
      3. 2.2.3 Secondary Research
      4. 2.2.4 Primary Research
        1. 2.2.4.1 Primary Interviews and Information Gathering Process
        2. 2.2.4.2 Breakdown of Primary Respondents
      5. 2.2.5 Forecasting Model
      6. 2.2.6 Market Size Estimation
        1. 2.2.6.1 Bottom-Up Approach
        2. 2.2.6.2 Top-Down Approach
      7. 2.2.7 Data Triangulation
      8. 2.2.8 Validation
  3. 3 SECTION III: QUALITATIVE ANALYSIS
    1. 3.1 MARKET DYNAMICS
      1. 3.1.1 Overview
      2. 3.1.2 Drivers
      3. 3.1.3 Restraints
      4. 3.1.4 Opportunities
    2. 3.2 MARKET FACTOR ANALYSIS
      1. 3.2.1 Value chain Analysis
      2. 3.2.2 Porter's Five Forces Analysis
        1. 3.2.2.1 Bargaining Power of Suppliers
        2. 3.2.2.2 Bargaining Power of Buyers
        3. 3.2.2.3 Threat of New Entrants
        4. 3.2.2.4 Threat of Substitutes
        5. 3.2.2.5 Intensity of Rivalry
      3. 3.2.3 COVID-19 Impact Analysis
        1. 3.2.3.1 Market Impact Analysis
        2. 3.2.3.2 Regional Impact
        3. 3.2.3.3 Opportunity and Threat Analysis
  4. 4 SECTION IV: QUANTITATIVE ANALYSIS
    1. 4.1 Construction, BY Treatment Type (USD Million)
      1. 4.1.1 Surgery
      2. 4.1.2 Radiation Therapy
      3. 4.1.3 Chemotherapy
      4. 4.1.4 Targeted Therapy
    2. 4.2 Construction, BY Diagnosis Method (USD Million)
      1. 4.2.1 Imaging Tests
      2. 4.2.2 Biopsy
      3. 4.2.3 Physical Examination
      4. 4.2.4 Blood Tests
    3. 4.3 Construction, BY Location of Tumor (USD Million)
      1. 4.3.1 Pelvis
      2. 4.3.2 Femur
      3. 4.3.3 Humerus
      4. 4.3.4 Ribs
    4. 4.4 Construction, BY Patient Age Group (USD Million)
      1. 4.4.1 Pediatric
      2. 4.4.2 Adult
      3. 4.4.3 Geriatric
  5. 5 SECTION V: COMPETITIVE ANALYSIS
    1. 5.1 Competitive Landscape
      1. 5.1.1 Overview
      2. 5.1.2 Competitive Analysis
      3. 5.1.3 Market share Analysis
      4. 5.1.4 Major Growth Strategy in the Construction
      5. 5.1.5 Competitive Benchmarking
      6. 5.1.6 Leading Players in Terms of Number of Developments in the Construction
      7. 5.1.7 Key developments and growth strategies
        1. 5.1.7.1 New Product Launch/Service Deployment
        2. 5.1.7.2 Merger & Acquisitions
        3. 5.1.7.3 Joint Ventures
      8. 5.1.8 Major Players Financial Matrix
        1. 5.1.8.1 Sales and Operating Income
        2. 5.1.8.2 Major Players R&D Expenditure. 2023
    2. 5.2 Company Profiles
      1. 5.2.1 Bristol-Myers Squibb (US)
        1. 5.2.1.1 Financial Overview
        2. 5.2.1.2 Products Offered
        3. 5.2.1.3 Key Developments
        4. 5.2.1.4 SWOT Analysis
        5. 5.2.1.5 Key Strategies
      2. 5.2.2 Novartis (CH)
        1. 5.2.2.1 Financial Overview
        2. 5.2.2.2 Products Offered
        3. 5.2.2.3 Key Developments
        4. 5.2.2.4 SWOT Analysis
        5. 5.2.2.5 Key Strategies
      3. 5.2.3 Merck & Co. (US)
        1. 5.2.3.1 Financial Overview
        2. 5.2.3.2 Products Offered
        3. 5.2.3.3 Key Developments
        4. 5.2.3.4 SWOT Analysis
        5. 5.2.3.5 Key Strategies
      4. 5.2.4 Amgen (US)
        1. 5.2.4.1 Financial Overview
        2. 5.2.4.2 Products Offered
        3. 5.2.4.3 Key Developments
        4. 5.2.4.4 SWOT Analysis
        5. 5.2.4.5 Key Strategies
      5. 5.2.5 Eli Lilly and Company (US)
        1. 5.2.5.1 Financial Overview
        2. 5.2.5.2 Products Offered
        3. 5.2.5.3 Key Developments
        4. 5.2.5.4 SWOT Analysis
        5. 5.2.5.5 Key Strategies
      6. 5.2.6 Bayer (DE)
        1. 5.2.6.1 Financial Overview
        2. 5.2.6.2 Products Offered
        3. 5.2.6.3 Key Developments
        4. 5.2.6.4 SWOT Analysis
        5. 5.2.6.5 Key Strategies
      7. 5.2.7 Pfizer (US)
        1. 5.2.7.1 Financial Overview
        2. 5.2.7.2 Products Offered
        3. 5.2.7.3 Key Developments
        4. 5.2.7.4 SWOT Analysis
        5. 5.2.7.5 Key Strategies
      8. 5.2.8 AstraZeneca (GB)
        1. 5.2.8.1 Financial Overview
        2. 5.2.8.2 Products Offered
        3. 5.2.8.3 Key Developments
        4. 5.2.8.4 SWOT Analysis
        5. 5.2.8.5 Key Strategies
    3. 5.3 Appendix
      1. 5.3.1 References
      2. 5.3.2 Related Reports
  6. 6 LIST OF FIGURES
    1. 6.1 MARKET SYNOPSIS
    2. 6.2 US MARKET ANALYSIS BY TREATMENT TYPE
    3. 6.3 US MARKET ANALYSIS BY DIAGNOSIS METHOD
    4. 6.4 US MARKET ANALYSIS BY LOCATION OF TUMOR
    5. 6.5 US MARKET ANALYSIS BY PATIENT AGE GROUP
    6. 6.6 KEY BUYING CRITERIA OF CONSTRUCTION
    7. 6.7 RESEARCH PROCESS OF MRFR
    8. 6.8 DRO ANALYSIS OF CONSTRUCTION
    9. 6.9 DRIVERS IMPACT ANALYSIS: CONSTRUCTION
    10. 6.10 RESTRAINTS IMPACT ANALYSIS: CONSTRUCTION
    11. 6.11 SUPPLY / VALUE CHAIN: CONSTRUCTION
    12. 6.12 CONSTRUCTION, BY TREATMENT TYPE, 2024 (% SHARE)
    13. 6.13 CONSTRUCTION, BY TREATMENT TYPE, 2024 TO 2035 (USD Million)
    14. 6.14 CONSTRUCTION, BY DIAGNOSIS METHOD, 2024 (% SHARE)
    15. 6.15 CONSTRUCTION, BY DIAGNOSIS METHOD, 2024 TO 2035 (USD Million)
    16. 6.16 CONSTRUCTION, BY LOCATION OF TUMOR, 2024 (% SHARE)
    17. 6.17 CONSTRUCTION, BY LOCATION OF TUMOR, 2024 TO 2035 (USD Million)
    18. 6.18 CONSTRUCTION, BY PATIENT AGE GROUP, 2024 (% SHARE)
    19. 6.19 CONSTRUCTION, BY PATIENT AGE GROUP, 2024 TO 2035 (USD Million)
    20. 6.20 BENCHMARKING OF MAJOR COMPETITORS
  7. 7 LIST OF TABLES
    1. 7.1 LIST OF ASSUMPTIONS
  8. 7.1.1
    1. 7.2 US MARKET SIZE ESTIMATES; FORECAST
      1. 7.2.1 BY TREATMENT TYPE, 2025-2035 (USD Million)
      2. 7.2.2 BY DIAGNOSIS METHOD, 2025-2035 (USD Million)
      3. 7.2.3 BY LOCATION OF TUMOR, 2025-2035 (USD Million)
      4. 7.2.4 BY PATIENT AGE GROUP, 2025-2035 (USD Million)
    2. 7.3 PRODUCT LAUNCH/PRODUCT DEVELOPMENT/APPROVAL
  9. 7.3.1
    1. 7.4 ACQUISITION/PARTNERSHIP
  10. 7.4.1

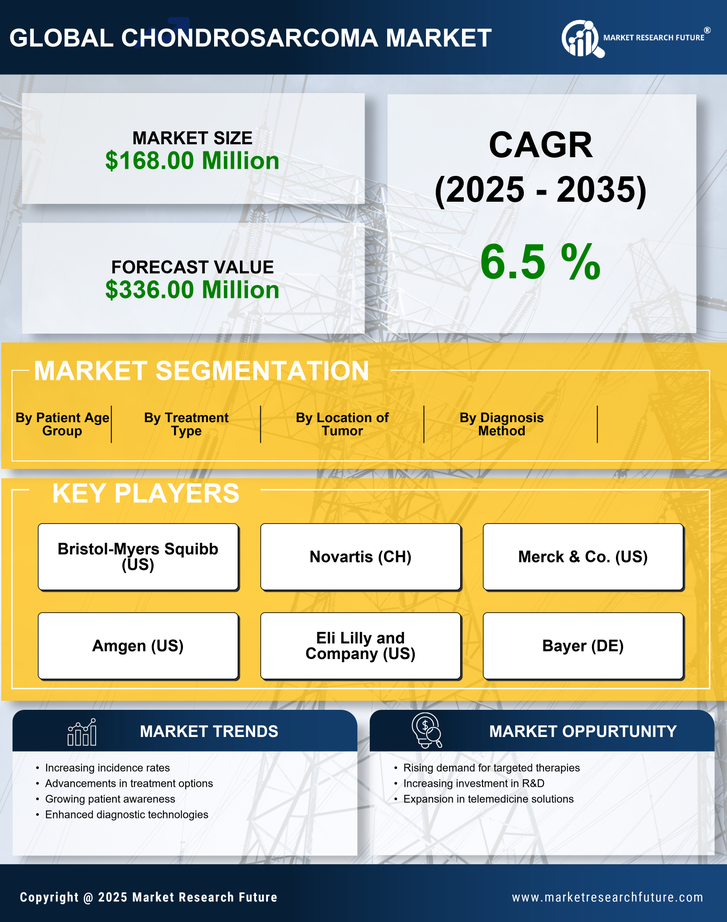
US Construction Market Segmentation

Construction By Treatment Type (USD Million, 2025-2035)

  • Surgery
  • Radiation Therapy
  • Chemotherapy
  • Targeted Therapy

Construction By Diagnosis Method (USD Million, 2025-2035)

  • Imaging Tests
  • Biopsy
  • Physical Examination
  • Blood Tests

Construction By Location of Tumor (USD Million, 2025-2035)

  • Pelvis
  • Femur
  • Humerus
  • Ribs

Construction By Patient Age Group (USD Million, 2025-2035)

  • Pediatric
  • Adult
  • Geriatric

Compare Licence

×
Features License Type
Single User Multiuser License Enterprise User
Price $4,950 $5,950 $7,250
Maximum User Access Limit 1 User Upto 10 Users Unrestricted Access Throughout the Organization
Free Customization
Direct Access to Analyst
Deliverable Format
Platform Access
Discount on Next Purchase 10% 15% 15%
Printable Versions