Request Free Sample ×

Kindly complete the form below to receive a free sample of this Report

* Please use a valid business email

Leading companies partner with us for data-driven Insights

clients tt-cursor
Hero Background

US Canned Alcoholic Beverages Market

ID: MRFR/FnB/11545-HCR
100 Pages
Garvit Vyas
Last Updated: April 06, 2026

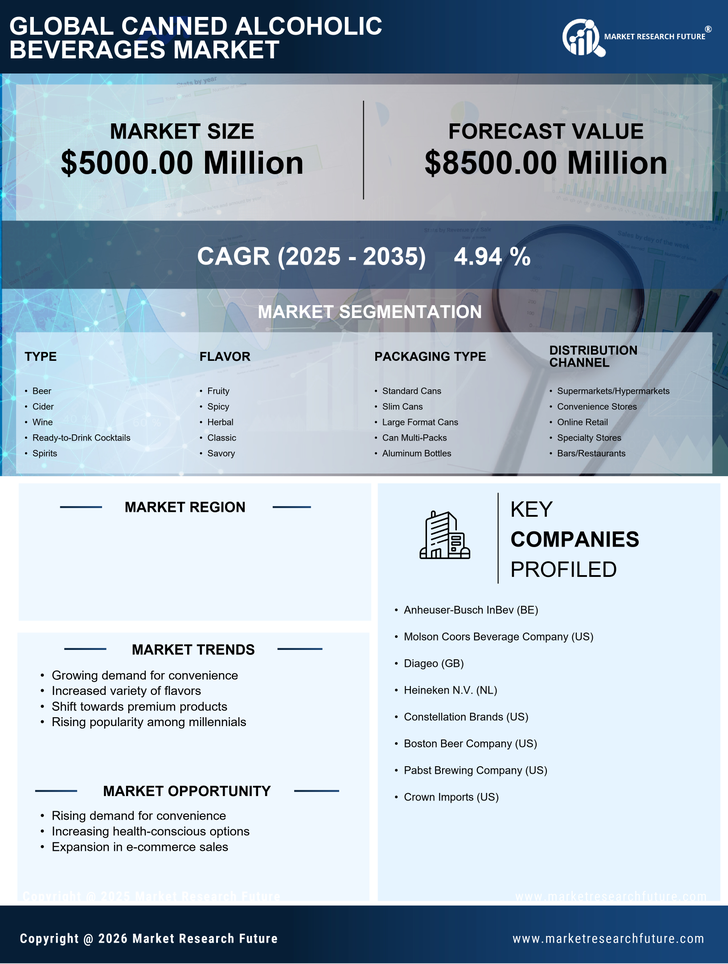
US Canned Alcoholic Beverages Market Size, Share, Industry Trend & Analysis Research Report: By Type (Beer, Cider, Wine, Ready-to-Drink Cocktails, Spirits), By Flavor (Fruity, Spicy, Herbal, Classic, Savory), By Packaging Type (Standard Cans, Slim Cans, Large Format Cans, Can Multi-Packs, Aluminum Bottles) andBy Distribution Channel (Supermarkets/Hypermarkets, Convenience Stores, Online Retail, Specialty Stores, Bars/Restaurants)- Forecast to 2035

Share:
Download PDF ×

We do not share your information with anyone. However, we may send you emails based on your report interest from time to time. You may contact us at any time to opt-out.

US Canned Alcoholic Beverages Market Infographic
Purchase Options
  1. 1 SECTION I: EXECUTIVE SUMMARY AND KEY HIGHLIGHTS
  2.   1.1 EXECUTIVE SUMMARY
  3.     1.1.1 Market Overview
  4.     1.1.2 Key Findings
  5.     1.1.3 Market Segmentation
  6.     1.1.4 Competitive Landscape
  7.     1.1.5 Challenges and Opportunities
  8.     1.1.6 Future Outlook
  9. 2 SECTION II: SCOPING, METHODOLOGY AND MARKET STRUCTURE
  10.   2.1 MARKET INTRODUCTION
  11.     2.1.1 Definition
  12.     2.1.2 Scope of the study
  13.       2.1.2.1 Research Objective
  14.       2.1.2.2 Assumption
  15.       2.1.2.3 Limitations
  16.   2.2 RESEARCH METHODOLOGY
  17.     2.2.1 Overview
  18.     2.2.2 Data Mining
  19.     2.2.3 Secondary Research
  20.     2.2.4 Primary Research
  21.       2.2.4.1 Primary Interviews and Information Gathering Process
  22.       2.2.4.2 Breakdown of Primary Respondents
  23.     2.2.5 Forecasting Model
  24.     2.2.6 Market Size Estimation
  25.       2.2.6.1 Bottom-Up Approach
  26.       2.2.6.2 Top-Down Approach
  27.     2.2.7 Data Triangulation
  28.     2.2.8 Validation
  29. 3 SECTION III: QUALITATIVE ANALYSIS
  30.   3.1 MARKET DYNAMICS
  31.     3.1.1 Overview
  32.     3.1.2 Drivers
  33.     3.1.3 Restraints
  34.     3.1.4 Opportunities
  35.   3.2 MARKET FACTOR ANALYSIS
  36.     3.2.1 Value chain Analysis
  37.     3.2.2 Porter's Five Forces Analysis
  38.       3.2.2.1 Bargaining Power of Suppliers
  39.       3.2.2.2 Bargaining Power of Buyers
  40.       3.2.2.3 Threat of New Entrants
  41.       3.2.2.4 Threat of Substitutes
  42.       3.2.2.5 Intensity of Rivalry
  43.     3.2.3 COVID-19 Impact Analysis
  44.       3.2.3.1 Market Impact Analysis
  45.       3.2.3.2 Regional Impact
  46.       3.2.3.3 Opportunity and Threat Analysis
  47. 4 SECTION IV: QUANTITATIVE ANALYSIS
  48.   4.1 Security, Access Control and Robotics, BY Type (USD Million)
  49.     4.1.1 Beer
  50.     4.1.2 Cider
  51.     4.1.3 Wine
  52.     4.1.4 Ready-to-Drink Cocktails
  53.     4.1.5 Spirits
  54.   4.2 Security, Access Control and Robotics, BY Flavor (USD Million)
  55.     4.2.1 Fruity
  56.     4.2.2 Spicy
  57.     4.2.3 Herbal
  58.     4.2.4 Classic
  59.     4.2.5 Savory
  60.   4.3 Security, Access Control and Robotics, BY Packaging Type (USD Million)
  61.     4.3.1 Standard Cans
  62.     4.3.2 Slim Cans
  63.     4.3.3 Large Format Cans
  64.     4.3.4 Can Multi-Packs
  65.     4.3.5 Aluminum Bottles
  66.   4.4 Security, Access Control and Robotics, BY Distribution Channel (USD Million)
  67.     4.4.1 Supermarkets/Hypermarkets
  68.     4.4.2 Convenience Stores
  69.     4.4.3 Online Retail
  70.     4.4.4 Specialty Stores
  71.     4.4.5 Bars/Restaurants
  72. 5 SECTION V: COMPETITIVE ANALYSIS
  73.   5.1 Competitive Landscape
  74.     5.1.1 Overview
  75.     5.1.2 Competitive Analysis
  76.     5.1.3 Market share Analysis
  77.     5.1.4 Major Growth Strategy in the Security, Access Control and Robotics
  78.     5.1.5 Competitive Benchmarking
  79.     5.1.6 Leading Players in Terms of Number of Developments in the Security, Access Control and Robotics
  80.     5.1.7 Key developments and growth strategies
  81.       5.1.7.1 New Product Launch/Service Deployment
  82.       5.1.7.2 Merger & Acquisitions
  83.       5.1.7.3 Joint Ventures
  84.     5.1.8 Major Players Financial Matrix
  85.       5.1.8.1 Sales and Operating Income
  86.       5.1.8.2 Major Players R&D Expenditure. 2023
  87.   5.2 Company Profiles
  88.     5.2.1 Anheuser-Busch InBev (BE)
  89.       5.2.1.1 Financial Overview
  90.       5.2.1.2 Products Offered
  91.       5.2.1.3 Key Developments
  92.       5.2.1.4 SWOT Analysis
  93.       5.2.1.5 Key Strategies
  94.     5.2.2 Molson Coors Beverage Company (US)
  95.       5.2.2.1 Financial Overview
  96.       5.2.2.2 Products Offered
  97.       5.2.2.3 Key Developments
  98.       5.2.2.4 SWOT Analysis
  99.       5.2.2.5 Key Strategies
  100.     5.2.3 Diageo (GB)
  101.       5.2.3.1 Financial Overview
  102.       5.2.3.2 Products Offered
  103.       5.2.3.3 Key Developments
  104.       5.2.3.4 SWOT Analysis
  105.       5.2.3.5 Key Strategies
  106.     5.2.4 Heineken N.V. (NL)
  107.       5.2.4.1 Financial Overview
  108.       5.2.4.2 Products Offered
  109.       5.2.4.3 Key Developments
  110.       5.2.4.4 SWOT Analysis
  111.       5.2.4.5 Key Strategies
  112.     5.2.5 Constellation Brands (US)
  113.       5.2.5.1 Financial Overview
  114.       5.2.5.2 Products Offered
  115.       5.2.5.3 Key Developments
  116.       5.2.5.4 SWOT Analysis
  117.       5.2.5.5 Key Strategies
  118.     5.2.6 Boston Beer Company (US)
  119.       5.2.6.1 Financial Overview
  120.       5.2.6.2 Products Offered
  121.       5.2.6.3 Key Developments
  122.       5.2.6.4 SWOT Analysis
  123.       5.2.6.5 Key Strategies
  124.     5.2.7 Pabst Brewing Company (US)
  125.       5.2.7.1 Financial Overview
  126.       5.2.7.2 Products Offered
  127.       5.2.7.3 Key Developments
  128.       5.2.7.4 SWOT Analysis
  129.       5.2.7.5 Key Strategies
  130.     5.2.8 Crown Imports (US)
  131.       5.2.8.1 Financial Overview
  132.       5.2.8.2 Products Offered
  133.       5.2.8.3 Key Developments
  134.       5.2.8.4 SWOT Analysis
  135.       5.2.8.5 Key Strategies
  136.   5.3 Appendix
  137.     5.3.1 References
  138.     5.3.2 Related Reports
  139. 6 LIST OF FIGURES
  140.   6.1 MARKET SYNOPSIS
  141.   6.2 US MARKET ANALYSIS BY TYPE
  142.   6.3 US MARKET ANALYSIS BY FLAVOR
  143.   6.4 US MARKET ANALYSIS BY PACKAGING TYPE
  144.   6.5 US MARKET ANALYSIS BY DISTRIBUTION CHANNEL
  145.   6.6 KEY BUYING CRITERIA OF SECURITY, ACCESS CONTROL AND ROBOTICS
  146.   6.7 RESEARCH PROCESS OF MRFR
  147.   6.8 DRO ANALYSIS OF SECURITY, ACCESS CONTROL AND ROBOTICS
  148.   6.9 DRIVERS IMPACT ANALYSIS: SECURITY, ACCESS CONTROL AND ROBOTICS
  149.   6.10 RESTRAINTS IMPACT ANALYSIS: SECURITY, ACCESS CONTROL AND ROBOTICS
  150.   6.11 SUPPLY / VALUE CHAIN: SECURITY, ACCESS CONTROL AND ROBOTICS
  151.   6.12 SECURITY, ACCESS CONTROL AND ROBOTICS, BY TYPE, 2024 (% SHARE)
  152.   6.13 SECURITY, ACCESS CONTROL AND ROBOTICS, BY TYPE, 2024 TO 2035 (USD Million)
  153.   6.14 SECURITY, ACCESS CONTROL AND ROBOTICS, BY FLAVOR, 2024 (% SHARE)
  154.   6.15 SECURITY, ACCESS CONTROL AND ROBOTICS, BY FLAVOR, 2024 TO 2035 (USD Million)
  155.   6.16 SECURITY, ACCESS CONTROL AND ROBOTICS, BY PACKAGING TYPE, 2024 (% SHARE)
  156.   6.17 SECURITY, ACCESS CONTROL AND ROBOTICS, BY PACKAGING TYPE, 2024 TO 2035 (USD Million)
  157.   6.18 SECURITY, ACCESS CONTROL AND ROBOTICS, BY DISTRIBUTION CHANNEL, 2024 (% SHARE)
  158.   6.19 SECURITY, ACCESS CONTROL AND ROBOTICS, BY DISTRIBUTION CHANNEL, 2024 TO 2035 (USD Million)
  159.   6.20 BENCHMARKING OF MAJOR COMPETITORS
  160. 7 LIST OF TABLES
  161.   7.1 LIST OF ASSUMPTIONS
  162.     7.1.1
  163.   7.2 US MARKET SIZE ESTIMATES; FORECAST
  164.     7.2.1 BY TYPE, 2025-2035 (USD Million)
  165.     7.2.2 BY FLAVOR, 2025-2035 (USD Million)
  166.     7.2.3 BY PACKAGING TYPE, 2025-2035 (USD Million)
  167.     7.2.4 BY DISTRIBUTION CHANNEL, 2025-2035 (USD Million)
  168.   7.3 PRODUCT LAUNCH/PRODUCT DEVELOPMENT/APPROVAL
  169.     7.3.1
  170.   7.4 ACQUISITION/PARTNERSHIP
  171.     7.4.1

US Security, Access Control and Robotics Market Segmentation

Security, Access Control and Robotics By Type (USD Million, 2025-2035)

  • Beer
  • Cider
  • Wine
  • Ready-to-Drink Cocktails
  • Spirits

Security, Access Control and Robotics By Flavor (USD Million, 2025-2035)

  • Fruity
  • Spicy
  • Herbal
  • Classic
  • Savory

Security, Access Control and Robotics By Packaging Type (USD Million, 2025-2035)

  • Standard Cans
  • Slim Cans
  • Large Format Cans
  • Can Multi-Packs
  • Aluminum Bottles

Security, Access Control and Robotics By Distribution Channel (USD Million, 2025-2035)

  • Supermarkets/Hypermarkets
  • Convenience Stores
  • Online Retail
  • Specialty Stores
  • Bars/Restaurants

Compare Licence

×
Features License Type
Single User Multiuser License Enterprise User
Price $4,950 $5,950 $7,250
Maximum User Access Limit 1 User Upto 10 Users Unrestricted Access Throughout the Organization
Free Customization
Direct Access to Analyst
Deliverable Format
Platform Access
Discount on Next Purchase 10% 15% 15%
Printable Versions