Request Free Sample ×

Kindly complete the form below to receive a free sample of this Report

* Please use a valid business email

Leading companies partner with us for data-driven Insights

clients tt-cursor
Hero Background

US Airport Passenger Screening Systems Market

ID: MRFR/AD/15574-HCR
100 Pages
Shubham Munde
Last Updated: April 06, 2026

US Airport Passenger Screening Systems Market Size, Share, Industry Trend & Analysis Research Report: By Technology (X-ray Screening, Computed Tomography, Millimeter Wave Scanner, Explosive Trace Detection, Biometric Screening), By Application (Baggage Screening, Passenger Screening, Cargo Screening, Airport Security Checkpoints), By End Use (Commercial Airports, Private Airports, Cargo Airports, Military Airports) andBy System Type (Fixed Systems, Portable Systems, Mobile Systems)- Forecast to 2035

Share:
Download PDF ×

We do not share your information with anyone. However, we may send you emails based on your report interest from time to time. You may contact us at any time to opt-out.

US Airport Passenger Screening Systems Market Infographic
Purchase Options
  1. 1 SECTION I: EXECUTIVE SUMMARY AND KEY HIGHLIGHTS
  2.   1.1 EXECUTIVE SUMMARY
  3.     1.1.1 Market Overview
  4.     1.1.2 Key Findings
  5.     1.1.3 Market Segmentation
  6.     1.1.4 Competitive Landscape
  7.     1.1.5 Challenges and Opportunities
  8.     1.1.6 Future Outlook
  9. 2 SECTION II: SCOPING, METHODOLOGY AND MARKET STRUCTURE
  10.   2.1 MARKET INTRODUCTION
  11.     2.1.1 Definition
  12.     2.1.2 Scope of the study
  13.       2.1.2.1 Research Objective
  14.       2.1.2.2 Assumption
  15.       2.1.2.3 Limitations
  16.   2.2 RESEARCH METHODOLOGY
  17.     2.2.1 Overview
  18.     2.2.2 Data Mining
  19.     2.2.3 Secondary Research
  20.     2.2.4 Primary Research
  21.       2.2.4.1 Primary Interviews and Information Gathering Process
  22.       2.2.4.2 Breakdown of Primary Respondents
  23.     2.2.5 Forecasting Model
  24.     2.2.6 Market Size Estimation
  25.       2.2.6.1 Bottom-Up Approach
  26.       2.2.6.2 Top-Down Approach
  27.     2.2.7 Data Triangulation
  28.     2.2.8 Validation
  29. 3 SECTION III: QUALITATIVE ANALYSIS
  30.   3.1 MARKET DYNAMICS
  31.     3.1.1 Overview
  32.     3.1.2 Drivers
  33.     3.1.3 Restraints
  34.     3.1.4 Opportunities
  35.   3.2 MARKET FACTOR ANALYSIS
  36.     3.2.1 Value chain Analysis
  37.     3.2.2 Porter's Five Forces Analysis
  38.       3.2.2.1 Bargaining Power of Suppliers
  39.       3.2.2.2 Bargaining Power of Buyers
  40.       3.2.2.3 Threat of New Entrants
  41.       3.2.2.4 Threat of Substitutes
  42.       3.2.2.5 Intensity of Rivalry
  43.     3.2.3 COVID-19 Impact Analysis
  44.       3.2.3.1 Market Impact Analysis
  45.       3.2.3.2 Regional Impact
  46.       3.2.3.3 Opportunity and Threat Analysis
  47. 4 SECTION IV: QUANTITATIVE ANALYSIS
  48.   4.1 Pharmaceutical, BY Technology (USD Million)
  49.     4.1.1 X-ray Screening
  50.     4.1.2 Computed Tomography
  51.     4.1.3 Millimeter Wave Scanner
  52.     4.1.4 Explosive Trace Detection
  53.     4.1.5 Biometric Screening
  54.   4.2 Pharmaceutical, BY Application (USD Million)
  55.     4.2.1 Baggage Screening
  56.     4.2.2 Passenger Screening
  57.     4.2.3 Cargo Screening
  58.     4.2.4 Airport Security Checkpoints
  59.   4.3 Pharmaceutical, BY End Use (USD Million)
  60.     4.3.1 Commercial Airports
  61.     4.3.2 Private Airports
  62.     4.3.3 Cargo Airports
  63.     4.3.4 Military Airports
  64.   4.4 Pharmaceutical, BY System Type (USD Million)
  65.     4.4.1 Fixed Systems
  66.     4.4.2 Portable Systems
  67.     4.4.3 Mobile Systems
  68. 5 SECTION V: COMPETITIVE ANALYSIS
  69.   5.1 Competitive Landscape
  70.     5.1.1 Overview
  71.     5.1.2 Competitive Analysis
  72.     5.1.3 Market share Analysis
  73.     5.1.4 Major Growth Strategy in the Pharmaceutical
  74.     5.1.5 Competitive Benchmarking
  75.     5.1.6 Leading Players in Terms of Number of Developments in the Pharmaceutical
  76.     5.1.7 Key developments and growth strategies
  77.       5.1.7.1 New Product Launch/Service Deployment
  78.       5.1.7.2 Merger & Acquisitions
  79.       5.1.7.3 Joint Ventures
  80.     5.1.8 Major Players Financial Matrix
  81.       5.1.8.1 Sales and Operating Income
  82.       5.1.8.2 Major Players R&D Expenditure. 2023
  83.   5.2 Company Profiles
  84.     5.2.1 Smiths Detection (GB)
  85.       5.2.1.1 Financial Overview
  86.       5.2.1.2 Products Offered
  87.       5.2.1.3 Key Developments
  88.       5.2.1.4 SWOT Analysis
  89.       5.2.1.5 Key Strategies
  90.     5.2.2 L3Harris Technologies (US)
  91.       5.2.2.1 Financial Overview
  92.       5.2.2.2 Products Offered
  93.       5.2.2.3 Key Developments
  94.       5.2.2.4 SWOT Analysis
  95.       5.2.2.5 Key Strategies
  96.     5.2.3 Rapiscan Systems (US)
  97.       5.2.3.1 Financial Overview
  98.       5.2.3.2 Products Offered
  99.       5.2.3.3 Key Developments
  100.       5.2.3.4 SWOT Analysis
  101.       5.2.3.5 Key Strategies
  102.     5.2.4 Nuctech Company Limited (CN)
  103.       5.2.4.1 Financial Overview
  104.       5.2.4.2 Products Offered
  105.       5.2.4.3 Key Developments
  106.       5.2.4.4 SWOT Analysis
  107.       5.2.4.5 Key Strategies
  108.     5.2.5 SITA (CH)
  109.       5.2.5.1 Financial Overview
  110.       5.2.5.2 Products Offered
  111.       5.2.5.3 Key Developments
  112.       5.2.5.4 SWOT Analysis
  113.       5.2.5.5 Key Strategies
  114.     5.2.6 Thales Group (FR)
  115.       5.2.6.1 Financial Overview
  116.       5.2.6.2 Products Offered
  117.       5.2.6.3 Key Developments
  118.       5.2.6.4 SWOT Analysis
  119.       5.2.6.5 Key Strategies
  120.     5.2.7 Analogic Corporation (US)
  121.       5.2.7.1 Financial Overview
  122.       5.2.7.2 Products Offered
  123.       5.2.7.3 Key Developments
  124.       5.2.7.4 SWOT Analysis
  125.       5.2.7.5 Key Strategies
  126.     5.2.8 Cognex Corporation (US)
  127.       5.2.8.1 Financial Overview
  128.       5.2.8.2 Products Offered
  129.       5.2.8.3 Key Developments
  130.       5.2.8.4 SWOT Analysis
  131.       5.2.8.5 Key Strategies
  132.   5.3 Appendix
  133.     5.3.1 References
  134.     5.3.2 Related Reports
  135. 6 LIST OF FIGURES
  136.   6.1 MARKET SYNOPSIS
  137.   6.2 US MARKET ANALYSIS BY TECHNOLOGY
  138.   6.3 US MARKET ANALYSIS BY APPLICATION
  139.   6.4 US MARKET ANALYSIS BY END USE
  140.   6.5 US MARKET ANALYSIS BY SYSTEM TYPE
  141.   6.6 KEY BUYING CRITERIA OF PHARMACEUTICAL
  142.   6.7 RESEARCH PROCESS OF MRFR
  143.   6.8 DRO ANALYSIS OF PHARMACEUTICAL
  144.   6.9 DRIVERS IMPACT ANALYSIS: PHARMACEUTICAL
  145.   6.10 RESTRAINTS IMPACT ANALYSIS: PHARMACEUTICAL
  146.   6.11 SUPPLY / VALUE CHAIN: PHARMACEUTICAL
  147.   6.12 PHARMACEUTICAL, BY TECHNOLOGY, 2024 (% SHARE)
  148.   6.13 PHARMACEUTICAL, BY TECHNOLOGY, 2024 TO 2035 (USD Million)
  149.   6.14 PHARMACEUTICAL, BY APPLICATION, 2024 (% SHARE)
  150.   6.15 PHARMACEUTICAL, BY APPLICATION, 2024 TO 2035 (USD Million)
  151.   6.16 PHARMACEUTICAL, BY END USE, 2024 (% SHARE)
  152.   6.17 PHARMACEUTICAL, BY END USE, 2024 TO 2035 (USD Million)
  153.   6.18 PHARMACEUTICAL, BY SYSTEM TYPE, 2024 (% SHARE)
  154.   6.19 PHARMACEUTICAL, BY SYSTEM TYPE, 2024 TO 2035 (USD Million)
  155.   6.20 BENCHMARKING OF MAJOR COMPETITORS
  156. 7 LIST OF TABLES
  157.   7.1 LIST OF ASSUMPTIONS
  158.     7.1.1
  159.   7.2 US MARKET SIZE ESTIMATES; FORECAST
  160.     7.2.1 BY TECHNOLOGY, 2025-2035 (USD Million)
  161.     7.2.2 BY APPLICATION, 2025-2035 (USD Million)
  162.     7.2.3 BY END USE, 2025-2035 (USD Million)
  163.     7.2.4 BY SYSTEM TYPE, 2025-2035 (USD Million)
  164.   7.3 PRODUCT LAUNCH/PRODUCT DEVELOPMENT/APPROVAL
  165.     7.3.1
  166.   7.4 ACQUISITION/PARTNERSHIP
  167.     7.4.1

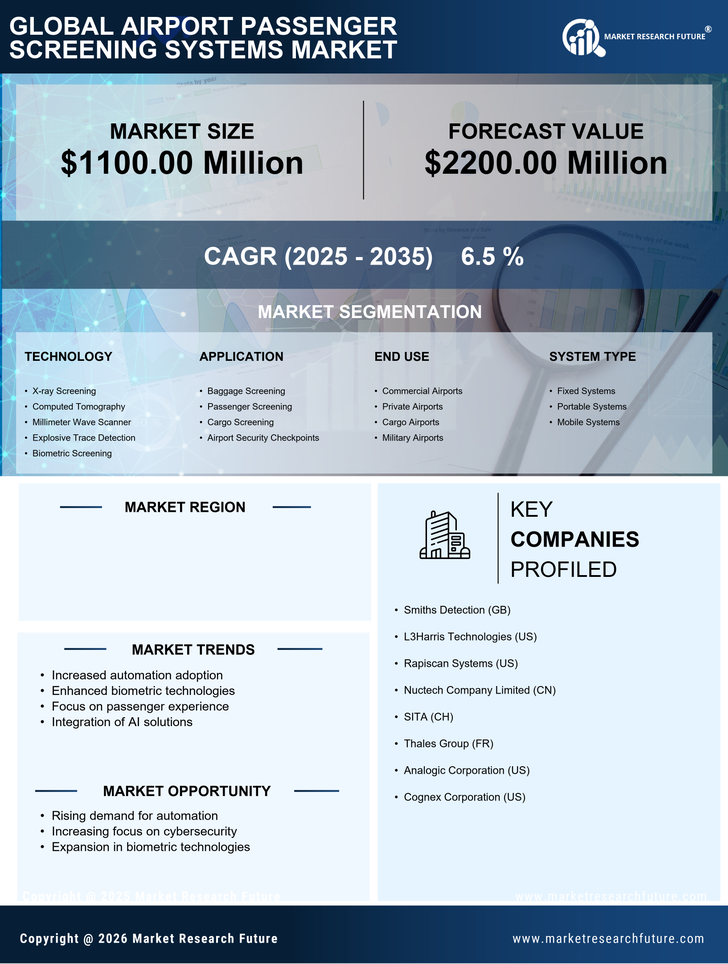
US Pharmaceutical Market Segmentation

Pharmaceutical By Technology (USD Million, 2025-2035)

  • X-ray Screening
  • Computed Tomography
  • Millimeter Wave Scanner
  • Explosive Trace Detection
  • Biometric Screening

Pharmaceutical By Application (USD Million, 2025-2035)

  • Baggage Screening
  • Passenger Screening
  • Cargo Screening
  • Airport Security Checkpoints

Pharmaceutical By End Use (USD Million, 2025-2035)

  • Commercial Airports
  • Private Airports
  • Cargo Airports
  • Military Airports

Pharmaceutical By System Type (USD Million, 2025-2035)

  • Fixed Systems
  • Portable Systems
  • Mobile Systems

Compare Licence

×
Features License Type
Single User Multiuser License Enterprise User
Price $4,950 $5,950 $7,250
Maximum User Access Limit 1 User Upto 10 Users Unrestricted Access Throughout the Organization
Free Customization
Direct Access to Analyst
Deliverable Format
Platform Access
Discount on Next Purchase 10% 15% 15%
Printable Versions