Request Free Sample ×

Kindly complete the form below to receive a free sample of this Report

* Please use a valid business email

Leading companies partner with us for data-driven Insights

clients tt-cursor
Hero Background

US Agricultural Packaging Market

ID: MRFR/PCM/11654-CR
100 Pages
Garvit Vyas
Last Updated: May 12, 2026

US Agricultural Packaging Market Research Report by Material (Plastic, Paper & Paperboard, Metal, Glass), Product (Pouches, Bags, Bottles, Trays), Barrier Strength (High, Medium, Low), Application (Chemical Pesticides, Chemical Fertilizers, Biologicals) and Region — Forecast till 2035

Share:
Download PDF ×

We do not share your information with anyone. However, we may send you emails based on your report interest from time to time. You may contact us at any time to opt-out.

US Agricultural Packaging Market Infographic
Purchase Options
  1. SECTION I: EXECUTIVE SUMMARY AND KEY HIGHLIGHTS |
    1. 1.1 EXECUTIVE SUMMARY | |
      1. 1.1.1 Market Overview | |
      2. 1.1.2 Key Findings | |
      3. 1.1.3 Market Segmentation | |
      4. 1.1.4 Competitive Landscape | |
      5. 1.1.5 Challenges and Opportunities | |
      6. 1.1.6 Future Outlook 2
  2. SECTION II: SCOPING, METHODOLOGY AND MARKET STRUCTURE |
    1. 2.1 MARKET INTRODUCTION | |
      1. 2.1.1 Definition | |
      2. 2.1.2 Scope of the study | | |
        1. 2.1.2.1 Research Objective | | |
        2. 2.1.2.2 Assumption | | |
        3. 2.1.2.3 Limitations |
    2. 2.2 RESEARCH METHODOLOGY | |
      1. 2.2.1 Overview | |
      2. 2.2.2 Data Mining | |
      3. 2.2.3 Secondary Research | |
      4. 2.2.4 Primary Research | | |
        1. 2.2.4.1 Primary Interviews and Information Gathering Process | | |
        2. 2.2.4.2 Breakdown of Primary Respondents | |
      5. 2.2.5 Forecasting Model | |
      6. 2.2.6 Market Size Estimation | | |
        1. 2.2.6.1 Bottom-Up Approach | | |
        2. 2.2.6.2 Top-Down Approach | |
      7. 2.2.7 Data Triangulation | |
      8. 2.2.8 Validation 3
  3. SECTION III: QUALITATIVE ANALYSIS |
    1. 3.1 MARKET DYNAMICS | |
      1. 3.1.1 Overview | |
      2. 3.1.2 Drivers | |
      3. 3.1.3 Restraints | |
      4. 3.1.4 Opportunities |
    2. 3.2 MARKET FACTOR ANALYSIS | |
      1. 3.2.1 Value chain Analysis | |
      2. 3.2.2 Porter's Five Forces Analysis | | |
        1. 3.2.2.1 Bargaining Power of Suppliers | | |
        2. 3.2.2.2 Bargaining Power of Buyers | | |
        3. 3.2.2.3 Threat of New Entrants | | |
        4. 3.2.2.4 Threat of Substitutes | | |
        5. 3.2.2.5 Intensity of Rivalry | |
      3. 3.2.3 COVID-19 Impact Analysis | | |
        1. 3.2.3.1 Market Impact Analysis | | |
        2. 3.2.3.2 Regional Impact | | |
        3. 3.2.3.3 Opportunity and Threat Analysis 4
  4. SECTION IV: QUANTITATIVE ANALYSIS |
    1. 4.1 Packaging & Transport, BY Material (USD Million) | |
      1. 4.1.1 Plastic | |
      2. 4.1.2 Paper and Paperboard | |
      3. 4.1.3 Metal | |
      4. 4.1.4 Glass and Others |
    2. 4.2 Packaging & Transport, BY Product (USD Million) | |
      1. 4.2.1 Pouches | |
      2. 4.2.2 Bags | |
      3. 4.2.3 Bottles | |
      4. 4.2.4 Trays and Others |
    3. 4.3 Packaging & Transport, BY Barrier Strength (USD Million) | |
      1. 4.3.1 High | |
      2. 4.3.2 Medium | |
      3. 4.3.3 Low |
    4. 4.4 Packaging & Transport, BY Application (USD Million) | |
      1. 4.4.1 Chemical pesticides | |
      2. 4.4.2 Chemical fertilizers | |
      3. 4.4.3 Biological 5
  5. SECTION V: COMPETITIVE ANALYSIS |
    1. 5.1 Competitive Landscape | |
      1. 5.1.1 Overview | |
      2. 5.1.2 Competitive Analysis | |
      3. 5.1.3 Market share Analysis | |
      4. 5.1.4 Major Growth Strategy in the Packaging & Transport | |
      5. 5.1.5 Competitive Benchmarking | |
      6. 5.1.6 Leading Players in Terms of Number of Developments in the Packaging & Transport | |
      7. 5.1.7 Key developments and growth strategies | | |
        1. 5.1.7.1 New Product Launch/Service Deployment | | |
        2. 5.1.7.2 Merger & Acquisitions | | |
        3. 5.1.7.3 Joint Ventures | |
      8. 5.1.8 Major Players Financial Matrix | | |
        1. 5.1.8.1 Sales and Operating Income | | |
        2. 5.1.8.2 Major Players R&D Expenditure. 2023 |
    2. 5.2 Company Profiles | |
      1. 5.2.1 Amcor (AU) | | |
        1. 5.2.1.1 Financial Overview | | |
        2. 5.2.1.2 Products Offered | | |
        3. 5.2.1.3 Key Developments | | |
        4. 5.2.1.4 SWOT Analysis | | |
        5. 5.2.1.5 Key Strategies | |
      2. 5.2.2 Sealed Air (US) | | |
        1. 5.2.2.1 Financial Overview | | |
        2. 5.2.2.2 Products Offered | | |
        3. 5.2.2.3 Key Developments | | |
        4. 5.2.2.4 SWOT Analysis | | |
        5. 5.2.2.5 Key Strategies | |
      3. 5.2.3 Berry Global (US) | | |
        1. 5.2.3.1 Financial Overview | | |
        2. 5.2.3.2 Products Offered | | |
        3. 5.2.3.3 Key Developments | | |
        4. 5.2.3.4 SWOT Analysis | | |
        5. 5.2.3.5 Key Strategies | |
      4. 5.2.4 Mondi (GB) | | |
        1. 5.2.4.1 Financial Overview | | |
        2. 5.2.4.2 Products Offered | | |
        3. 5.2.4.3 Key Developments | | |
        4. 5.2.4.4 SWOT Analysis | | |
        5. 5.2.4.5 Key Strategies | |
      5. 5.2.5 Smurfit Kappa (IE) | | |
        1. 5.2.5.1 Financial Overview | | |
        2. 5.2.5.2 Products Offered | | |
        3. 5.2.5.3 Key Developments | | |
        4. 5.2.5.4 SWOT Analysis | | |
        5. 5.2.5.5 Key Strategies | |
      6. 5.2.6 Sonoco Products (US) | | |
        1. 5.2.6.1 Financial Overview | | |
        2. 5.2.6.2 Products Offered | | |
        3. 5.2.6.3 Key Developments | | |
        4. 5.2.6.4 SWOT Analysis | | |
        5. 5.2.6.5 Key Strategies | |
      7. 5.2.7 International Paper (US) | | |
        1. 5.2.7.1 Financial Overview | | |
        2. 5.2.7.2 Products Offered | | |
        3. 5.2.7.3 Key Developments | | |
        4. 5.2.7.4 SWOT Analysis | | |
        5. 5.2.7.5 Key Strategies | |
      8. 5.2.8 WestRock (US) | | |
        1. 5.2.8.1 Financial Overview | | |
        2. 5.2.8.2 Products Offered | | |
        3. 5.2.8.3 Key Developments | | |
        4. 5.2.8.4 SWOT Analysis | | |
        5. 5.2.8.5 Key Strategies |
    3. 5.3 Appendix | |
      1. 5.3.1 References | |
      2. 5.3.2 Related Reports 6 LIST OF FIGURES |
    4. 6.1 MARKET SYNOPSIS |
    5. 6.2 US MARKET ANALYSIS BY MATERIAL |
    6. 6.3 US MARKET ANALYSIS BY PRODUCT |
    7. 6.4 US MARKET ANALYSIS BY BARRIER STRENGTH |
    8. 6.5 US MARKET ANALYSIS BY APPLICATION |
    9. 6.6 KEY BUYING CRITERIA OF PACKAGING & TRANSPORT |
    10. 6.7 RESEARCH PROCESS OF MRFR |
    11. 6.8 DRO ANALYSIS OF PACKAGING & TRANSPORT |
    12. 6.9 DRIVERS IMPACT ANALYSIS: PACKAGING & TRANSPORT |
    13. 6.10 RESTRAINTS IMPACT ANALYSIS: PACKAGING & TRANSPORT |
    14. 6.11 SUPPLY / VALUE CHAIN: PACKAGING & TRANSPORT |
    15. 6.12 PACKAGING & TRANSPORT, BY MATERIAL, 2024 (% SHARE) |
    16. 6.13 PACKAGING & TRANSPORT, BY MATERIAL, 2024 TO 2035 (USD Million) |
    17. 6.14 PACKAGING & TRANSPORT, BY PRODUCT, 2024 (% SHARE) |
    18. 6.15 PACKAGING & TRANSPORT, BY PRODUCT, 2024 TO 2035 (USD Million) |
    19. 6.16 PACKAGING & TRANSPORT, BY BARRIER STRENGTH, 2024 (% SHARE) |
    20. 6.17 PACKAGING & TRANSPORT, BY BARRIER STRENGTH, 2024 TO 2035 (USD Million) |
    21. 6.18 PACKAGING & TRANSPORT, BY APPLICATION, 2024 (% SHARE) |
    22. 6.19 PACKAGING & TRANSPORT, BY APPLICATION, 2024 TO 2035 (USD Million) |
    23. 6.20 BENCHMARKING OF MAJOR COMPETITORS 7 LIST OF TABLES |
    24. 7.1 LIST OF ASSUMPTIONS | |
      1. 7.1.1 |
    25. 7.2 US MARKET SIZE ESTIMATES; FORECAST | |
      1. 7.2.1 BY MATERIAL, 2025-2035 (USD Million) | |
      2. 7.2.2 BY PRODUCT, 2025-2035 (USD Million) | |
      3. 7.2.3 BY BARRIER STRENGTH, 2025-2035 (USD Million) | |
      4. 7.2.4 BY APPLICATION, 2025-2035 (USD Million) |
    26. 7.3 PRODUCT LAUNCH/PRODUCT DEVELOPMENT/APPROVAL | |
      1. 7.3.1 |
    27. 7.4 ACQUISITION/PARTNERSHIP | |

US Packaging & Transport Market Segmentation

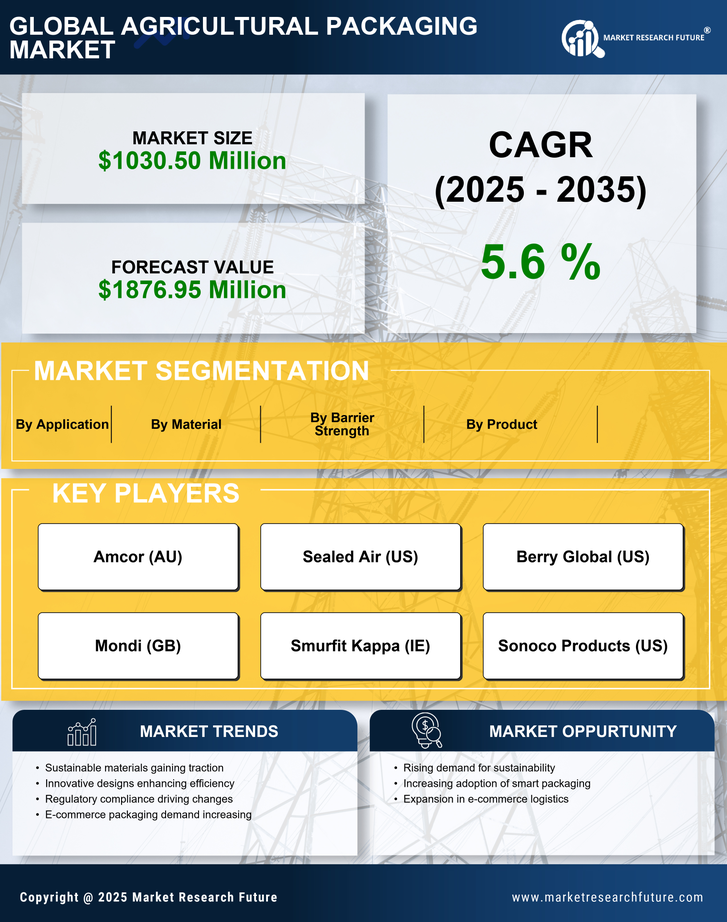
Packaging & Transport By Material (USD Million, 2025-2035)

  • Plastic
  • Paper and Paperboard
  • Metal
  • Glass and Others

Packaging & Transport By Product (USD Million, 2025-2035)

  • Pouches
  • Bags
  • Bottles
  • Trays and Others

Packaging & Transport By Barrier Strength (USD Million, 2025-2035)

  • High
  • Medium
  • Low

Packaging & Transport By Application (USD Million, 2025-2035)

  • Chemical pesticides
  • Chemical fertilizers
  • Biological

Compare Licence

×
Features License Type
Single User Multiuser License Enterprise User
Price $4,950 $5,950 $7,250
Maximum User Access Limit 1 User Upto 10 Users Unrestricted Access Throughout the Organization
Free Customization
Direct Access to Analyst
Deliverable Format
Platform Access
Discount on Next Purchase 10% 15% 15%
Printable Versions