Request Free Sample ×

Kindly complete the form below to receive a free sample of this Report

* Please use a valid business email

Leading companies partner with us for data-driven Insights

clients tt-cursor
Hero Background

US Aerospace High Performance Alloys Market

ID: MRFR/AD/13217-HCR
100 Pages
Shubham Munde
Last Updated: April 06, 2026

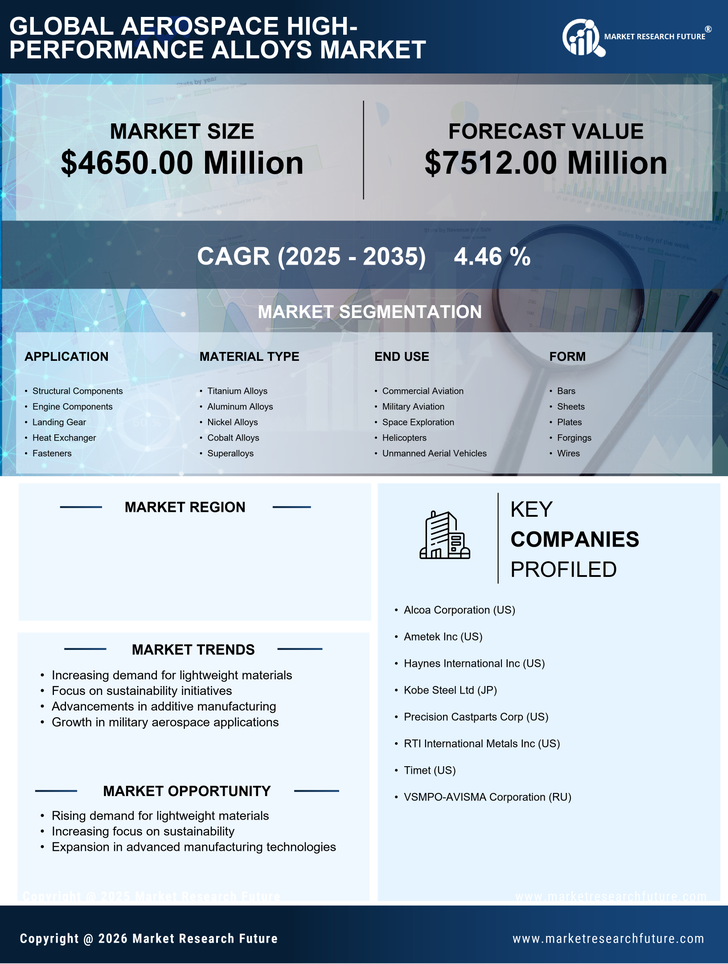
US Aerospace High Performance Alloys Market Size, Share, Industry Trend & Analysis Research Report: By Application (Structural Components, Engine Components, Landing Gear, Heat Exchanger, Fasteners), By Material Type (Titanium Alloys, Aluminum Alloys, Nickel Alloys, Cobalt Alloys, Superalloys), By End Use (Commercial Aviation, Military Aviation, Space Exploration, Helicopters, Unmanned Aerial Vehicles) andBy Form (Bars, Sheets, Plates, Forgings, Wires)- Forecast to 2035

Share:
Download PDF ×

We do not share your information with anyone. However, we may send you emails based on your report interest from time to time. You may contact us at any time to opt-out.

US Aerospace High Performance Alloys Market Infographic
Purchase Options
  1. 1 SECTION I: EXECUTIVE SUMMARY AND KEY HIGHLIGHTS
    1. 1.1 EXECUTIVE SUMMARY
      1. 1.1.1 Market Overview
      2. 1.1.2 Key Findings
      3. 1.1.3 Market Segmentation
      4. 1.1.4 Competitive Landscape
      5. 1.1.5 Challenges and Opportunities
      6. 1.1.6 Future Outlook
  2. 2 SECTION II: SCOPING, METHODOLOGY AND MARKET STRUCTURE
    1. 2.1 MARKET INTRODUCTION
      1. 2.1.1 Definition
      2. 2.1.2 Scope of the study
        1. 2.1.2.1 Research Objective
        2. 2.1.2.2 Assumption
        3. 2.1.2.3 Limitations
    2. 2.2 RESEARCH METHODOLOGY
      1. 2.2.1 Overview
      2. 2.2.2 Data Mining
      3. 2.2.3 Secondary Research
      4. 2.2.4 Primary Research
        1. 2.2.4.1 Primary Interviews and Information Gathering Process
        2. 2.2.4.2 Breakdown of Primary Respondents
      5. 2.2.5 Forecasting Model
      6. 2.2.6 Market Size Estimation
        1. 2.2.6.1 Bottom-Up Approach
        2. 2.2.6.2 Top-Down Approach
      7. 2.2.7 Data Triangulation
      8. 2.2.8 Validation
  3. 3 SECTION III: QUALITATIVE ANALYSIS
    1. 3.1 MARKET DYNAMICS
      1. 3.1.1 Overview
      2. 3.1.2 Drivers
      3. 3.1.3 Restraints
      4. 3.1.4 Opportunities
    2. 3.2 MARKET FACTOR ANALYSIS
      1. 3.2.1 Value chain Analysis
      2. 3.2.2 Porter's Five Forces Analysis
        1. 3.2.2.1 Bargaining Power of Suppliers
        2. 3.2.2.2 Bargaining Power of Buyers
        3. 3.2.2.3 Threat of New Entrants
        4. 3.2.2.4 Threat of Substitutes
        5. 3.2.2.5 Intensity of Rivalry
      3. 3.2.3 COVID-19 Impact Analysis
        1. 3.2.3.1 Market Impact Analysis
        2. 3.2.3.2 Regional Impact
        3. 3.2.3.3 Opportunity and Threat Analysis
  4. 4 SECTION IV: QUANTITATIVE ANALYSIS
    1. 4.1 Life Sciences, BY Application (USD Million)
      1. 4.1.1 Structural Components
      2. 4.1.2 Engine Components
      3. 4.1.3 Landing Gear
      4. 4.1.4 Heat Exchanger
      5. 4.1.5 Fasteners
    2. 4.2 Life Sciences, BY Material Type (USD Million)
      1. 4.2.1 Titanium Alloys
      2. 4.2.2 Aluminum Alloys
      3. 4.2.3 Nickel Alloys
      4. 4.2.4 Cobalt Alloys
      5. 4.2.5 Superalloys
    3. 4.3 Life Sciences, BY End Use (USD Million)
      1. 4.3.1 Commercial Aviation
      2. 4.3.2 Military Aviation
      3. 4.3.3 Space Exploration
      4. 4.3.4 Helicopters
      5. 4.3.5 Unmanned Aerial Vehicles
    4. 4.4 Life Sciences, BY Form (USD Million)
      1. 4.4.1 Bars
      2. 4.4.2 Sheets
      3. 4.4.3 Plates
      4. 4.4.4 Forgings
      5. 4.4.5 Wires
  5. 5 SECTION V: COMPETITIVE ANALYSIS
    1. 5.1 Competitive Landscape
      1. 5.1.1 Overview
      2. 5.1.2 Competitive Analysis
      3. 5.1.3 Market share Analysis
      4. 5.1.4 Major Growth Strategy in the Life Sciences
      5. 5.1.5 Competitive Benchmarking
      6. 5.1.6 Leading Players in Terms of Number of Developments in the Life Sciences
      7. 5.1.7 Key developments and growth strategies
        1. 5.1.7.1 New Product Launch/Service Deployment
        2. 5.1.7.2 Merger & Acquisitions
        3. 5.1.7.3 Joint Ventures
      8. 5.1.8 Major Players Financial Matrix
        1. 5.1.8.1 Sales and Operating Income
        2. 5.1.8.2 Major Players R&D Expenditure. 2023
    2. 5.2 Company Profiles
      1. 5.2.1 Alcoa Corporation (US)
        1. 5.2.1.1 Financial Overview
        2. 5.2.1.2 Products Offered
        3. 5.2.1.3 Key Developments
        4. 5.2.1.4 SWOT Analysis
        5. 5.2.1.5 Key Strategies
      2. 5.2.2 Ametek Inc (US)
        1. 5.2.2.1 Financial Overview
        2. 5.2.2.2 Products Offered
        3. 5.2.2.3 Key Developments
        4. 5.2.2.4 SWOT Analysis
        5. 5.2.2.5 Key Strategies
      3. 5.2.3 Haynes International Inc (US)
        1. 5.2.3.1 Financial Overview
        2. 5.2.3.2 Products Offered
        3. 5.2.3.3 Key Developments
        4. 5.2.3.4 SWOT Analysis
        5. 5.2.3.5 Key Strategies
      4. 5.2.4 Kobe Steel Ltd (JP)
        1. 5.2.4.1 Financial Overview
        2. 5.2.4.2 Products Offered
        3. 5.2.4.3 Key Developments
        4. 5.2.4.4 SWOT Analysis
        5. 5.2.4.5 Key Strategies
      5. 5.2.5 Precision Castparts Corp (US)
        1. 5.2.5.1 Financial Overview
        2. 5.2.5.2 Products Offered
        3. 5.2.5.3 Key Developments
        4. 5.2.5.4 SWOT Analysis
        5. 5.2.5.5 Key Strategies
      6. 5.2.6 RTI International Metals Inc (US)
        1. 5.2.6.1 Financial Overview
        2. 5.2.6.2 Products Offered
        3. 5.2.6.3 Key Developments
        4. 5.2.6.4 SWOT Analysis
        5. 5.2.6.5 Key Strategies
      7. 5.2.7 Timet (US)
        1. 5.2.7.1 Financial Overview
        2. 5.2.7.2 Products Offered
        3. 5.2.7.3 Key Developments
        4. 5.2.7.4 SWOT Analysis
        5. 5.2.7.5 Key Strategies
      8. 5.2.8 VSMPO-AVISMA Corporation (RU)
        1. 5.2.8.1 Financial Overview
        2. 5.2.8.2 Products Offered
        3. 5.2.8.3 Key Developments
        4. 5.2.8.4 SWOT Analysis
        5. 5.2.8.5 Key Strategies
    3. 5.3 Appendix
      1. 5.3.1 References
      2. 5.3.2 Related Reports
  6. 6 LIST OF FIGURES
    1. 6.1 MARKET SYNOPSIS
    2. 6.2 US MARKET ANALYSIS BY APPLICATION
    3. 6.3 US MARKET ANALYSIS BY MATERIAL TYPE
    4. 6.4 US MARKET ANALYSIS BY END USE
    5. 6.5 US MARKET ANALYSIS BY FORM
    6. 6.6 KEY BUYING CRITERIA OF LIFE SCIENCES
    7. 6.7 RESEARCH PROCESS OF MRFR
    8. 6.8 DRO ANALYSIS OF LIFE SCIENCES
    9. 6.9 DRIVERS IMPACT ANALYSIS: LIFE SCIENCES
    10. 6.10 RESTRAINTS IMPACT ANALYSIS: LIFE SCIENCES
    11. 6.11 SUPPLY / VALUE CHAIN: LIFE SCIENCES
    12. 6.12 LIFE SCIENCES, BY APPLICATION, 2024 (% SHARE)
    13. 6.13 LIFE SCIENCES, BY APPLICATION, 2024 TO 2035 (USD Million)
    14. 6.14 LIFE SCIENCES, BY MATERIAL TYPE, 2024 (% SHARE)
    15. 6.15 LIFE SCIENCES, BY MATERIAL TYPE, 2024 TO 2035 (USD Million)
    16. 6.16 LIFE SCIENCES, BY END USE, 2024 (% SHARE)
    17. 6.17 LIFE SCIENCES, BY END USE, 2024 TO 2035 (USD Million)
    18. 6.18 LIFE SCIENCES, BY FORM, 2024 (% SHARE)
    19. 6.19 LIFE SCIENCES, BY FORM, 2024 TO 2035 (USD Million)
    20. 6.20 BENCHMARKING OF MAJOR COMPETITORS
  7. 7 LIST OF TABLES
    1. 7.1 LIST OF ASSUMPTIONS
  8. 7.1.1
    1. 7.2 US MARKET SIZE ESTIMATES; FORECAST
      1. 7.2.1 BY APPLICATION, 2025-2035 (USD Million)
      2. 7.2.2 BY MATERIAL TYPE, 2025-2035 (USD Million)
      3. 7.2.3 BY END USE, 2025-2035 (USD Million)
      4. 7.2.4 BY FORM, 2025-2035 (USD Million)
    2. 7.3 PRODUCT LAUNCH/PRODUCT DEVELOPMENT/APPROVAL
  9. 7.3.1
    1. 7.4 ACQUISITION/PARTNERSHIP
  10. 7.4.1

US Life Sciences Market Segmentation

Life Sciences By Application (USD Million, 2025-2035)

  • Structural Components
  • Engine Components
  • Landing Gear
  • Heat Exchanger
  • Fasteners

Life Sciences By Material Type (USD Million, 2025-2035)

  • Titanium Alloys
  • Aluminum Alloys
  • Nickel Alloys
  • Cobalt Alloys
  • Superalloys

Life Sciences By End Use (USD Million, 2025-2035)

  • Commercial Aviation
  • Military Aviation
  • Space Exploration
  • Helicopters
  • Unmanned Aerial Vehicles

Life Sciences By Form (USD Million, 2025-2035)

  • Bars
  • Sheets
  • Plates
  • Forgings
  • Wires

Compare Licence

×
Features License Type
Single User Multiuser License Enterprise User
Price $4,950 $5,950 $7,250
Maximum User Access Limit 1 User Upto 10 Users Unrestricted Access Throughout the Organization
Free Customization
Direct Access to Analyst
Deliverable Format
Platform Access
Discount on Next Purchase 10% 15% 15%
Printable Versions