Request Free Sample ×

Kindly complete the form below to receive a free sample of this Report

* Please use a valid business email

Leading companies partner with us for data-driven Insights

clients tt-cursor
Hero Background

UK Overactive Bladder Treatment Market

ID: MRFR/MED/55265-HCR
200 Pages
Rahul Gotadki
Last Updated: April 24, 2026

UK Overactive Bladder Treatment Market Research Report: Size, Share, Trend Analysis By Treatment Type (Anticholinergics, Beta-3 Adrenergic Agonists, Neuromodulation, Botulinum Toxin Injections, Behavioral Therapies), By Route of Administration (Oral, Intravesical, Transdermal, Injectable), By Patient Type (Adult, Geriatric, Pediatric) and By Distribution Channel (Hospital Pharmacies, Retail Pharmacies, Online Pharmacies) - Growth Outlook & Industry Forecast 2025 To 2035

Share:
Download PDF ×

We do not share your information with anyone. However, we may send you emails based on your report interest from time to time. You may contact us at any time to opt-out.

UK Overactive Bladder Treatment Market Infographic
Purchase Options
  1. 1 SECTION I: EXECUTIVE SUMMARY AND KEY HIGHLIGHTS
    1. 1.1 EXECUTIVE SUMMARY
      1. 1.1.1 Market Overview
      2. 1.1.2 Key Findings
      3. 1.1.3 Market Segmentation
      4. 1.1.4 Competitive Landscape
      5. 1.1.5 Challenges and Opportunities
      6. 1.1.6 Future Outlook
  2. 2 SECTION II: SCOPING, METHODOLOGY AND MARKET STRUCTURE
    1. 2.1 MARKET INTRODUCTION
      1. 2.1.1 Definition
      2. 2.1.2 Scope of the study
        1. 2.1.2.1 Research Objective
        2. 2.1.2.2 Assumption
        3. 2.1.2.3 Limitations
    2. 2.2 RESEARCH METHODOLOGY
      1. 2.2.1 Overview
      2. 2.2.2 Data Mining
      3. 2.2.3 Secondary Research
      4. 2.2.4 Primary Research
        1. 2.2.4.1 Primary Interviews and Information Gathering Process
        2. 2.2.4.2 Breakdown of Primary Respondents
      5. 2.2.5 Forecasting Model
      6. 2.2.6 Market Size Estimation
        1. 2.2.6.1 Bottom-Up Approach
        2. 2.2.6.2 Top-Down Approach
      7. 2.2.7 Data Triangulation
      8. 2.2.8 Validation
  3. 3 SECTION III: QUALITATIVE ANALYSIS
    1. 3.1 MARKET DYNAMICS
      1. 3.1.1 Overview
      2. 3.1.2 Drivers
      3. 3.1.3 Restraints
      4. 3.1.4 Opportunities
    2. 3.2 MARKET FACTOR ANALYSIS
      1. 3.2.1 Value chain Analysis
      2. 3.2.2 Porter's Five Forces Analysis
        1. 3.2.2.1 Bargaining Power of Suppliers
        2. 3.2.2.2 Bargaining Power of Buyers
        3. 3.2.2.3 Threat of New Entrants
        4. 3.2.2.4 Threat of Substitutes
        5. 3.2.2.5 Intensity of Rivalry
      3. 3.2.3 COVID-19 Impact Analysis
        1. 3.2.3.1 Market Impact Analysis
        2. 3.2.3.2 Regional Impact
        3. 3.2.3.3 Opportunity and Threat Analysis
  4. 4 SECTION IV: QUANTITATIVE ANALYSIS
    1. 4.1 Security, Access Control and Robotics, BY Type (USD Million)
      1. 4.1.1 Anticholinergics
      2. 4.1.2 Beta-3 Adrenergic Agonists
      3. 4.1.3 Neuromodulation
      4. 4.1.4 Botulinum Toxin Injections
      5. 4.1.5 Behavioral Therapies
    2. 4.2 Security, Access Control and Robotics, BY Route of Administration (USD Million)
      1. 4.2.1 Oral
      2. 4.2.2 Intravesical
      3. 4.2.3 Transdermal
      4. 4.2.4 Injectable
    3. 4.3 Security, Access Control and Robotics, BY Patient Type (USD Million)
      1. 4.3.1 Adult
      2. 4.3.2 Geriatric
      3. 4.3.3 Pediatric
    4. 4.4 Security, Access Control and Robotics, BY Distribution Channel (USD Million)
      1. 4.4.1 Hospital Pharmacies
      2. 4.4.2 Retail Pharmacies
      3. 4.4.3 Online Pharmacies
  5. 5 SECTION V: COMPETITIVE ANALYSIS
    1. 5.1 Competitive Landscape
      1. 5.1.1 Overview
      2. 5.1.2 Competitive Analysis
      3. 5.1.3 Market share Analysis
      4. 5.1.4 Major Growth Strategy in the Security, Access Control and Robotics
      5. 5.1.5 Competitive Benchmarking
      6. 5.1.6 Leading Players in Terms of Number of Developments in the Security, Access Control and Robotics
      7. 5.1.7 Key developments and growth strategies
        1. 5.1.7.1 New Product Launch/Service Deployment
        2. 5.1.7.2 Merger & Acquisitions
        3. 5.1.7.3 Joint Ventures
      8. 5.1.8 Major Players Financial Matrix
        1. 5.1.8.1 Sales and Operating Income
        2. 5.1.8.2 Major Players R&D Expenditure. 2023
    2. 5.2 Company Profiles
      1. 5.2.1 Astellas Pharma (JP)
        1. 5.2.1.1 Financial Overview
        2. 5.2.1.2 Products Offered
        3. 5.2.1.3 Key Developments
        4. 5.2.1.4 SWOT Analysis
        5. 5.2.1.5 Key Strategies
      2. 5.2.2 Pfizer (US)
        1. 5.2.2.1 Financial Overview
        2. 5.2.2.2 Products Offered
        3. 5.2.2.3 Key Developments
        4. 5.2.2.4 SWOT Analysis
        5. 5.2.2.5 Key Strategies
      3. 5.2.3 Boehringer Ingelheim (DE)
        1. 5.2.3.1 Financial Overview
        2. 5.2.3.2 Products Offered
        3. 5.2.3.3 Key Developments
        4. 5.2.3.4 SWOT Analysis
        5. 5.2.3.5 Key Strategies
      4. 5.2.4 Novartis (CH)
        1. 5.2.4.1 Financial Overview
        2. 5.2.4.2 Products Offered
        3. 5.2.4.3 Key Developments
        4. 5.2.4.4 SWOT Analysis
        5. 5.2.4.5 Key Strategies
      5. 5.2.5 Eli Lilly (US)
        1. 5.2.5.1 Financial Overview
        2. 5.2.5.2 Products Offered
        3. 5.2.5.3 Key Developments
        4. 5.2.5.4 SWOT Analysis
        5. 5.2.5.5 Key Strategies
      6. 5.2.6 Teva Pharmaceutical Industries (IL)
        1. 5.2.6.1 Financial Overview
        2. 5.2.6.2 Products Offered
        3. 5.2.6.3 Key Developments
        4. 5.2.6.4 SWOT Analysis
        5. 5.2.6.5 Key Strategies
      7. 5.2.7 Santen Pharmaceutical (JP)
        1. 5.2.7.1 Financial Overview
        2. 5.2.7.2 Products Offered
        3. 5.2.7.3 Key Developments
        4. 5.2.7.4 SWOT Analysis
        5. 5.2.7.5 Key Strategies
      8. 5.2.8 Helsinn Healthcare (CH)
        1. 5.2.8.1 Financial Overview
        2. 5.2.8.2 Products Offered
        3. 5.2.8.3 Key Developments
        4. 5.2.8.4 SWOT Analysis
        5. 5.2.8.5 Key Strategies
      9. 5.2.9 Ferring Pharmaceuticals (CH)
        1. 5.2.9.1 Financial Overview
        2. 5.2.9.2 Products Offered
        3. 5.2.9.3 Key Developments
        4. 5.2.9.4 SWOT Analysis
        5. 5.2.9.5 Key Strategies
    3. 5.3 Appendix
      1. 5.3.1 References
      2. 5.3.2 Related Reports
  6. 6 LIST OF FIGURES
    1. 6.1 MARKET SYNOPSIS
    2. 6.2 UK MARKET ANALYSIS BY TYPE
    3. 6.3 UK MARKET ANALYSIS BY ROUTE OF ADMINISTRATION
    4. 6.4 UK MARKET ANALYSIS BY PATIENT TYPE
    5. 6.5 UK MARKET ANALYSIS BY DISTRIBUTION CHANNEL
    6. 6.6 KEY BUYING CRITERIA OF SECURITY, ACCESS CONTROL AND ROBOTICS
    7. 6.7 RESEARCH PROCESS OF MRFR
    8. 6.8 DRO ANALYSIS OF SECURITY, ACCESS CONTROL AND ROBOTICS
    9. 6.9 DRIVERS IMPACT ANALYSIS: SECURITY, ACCESS CONTROL AND ROBOTICS
    10. 6.10 RESTRAINTS IMPACT ANALYSIS: SECURITY, ACCESS CONTROL AND ROBOTICS
    11. 6.11 SUPPLY / VALUE CHAIN: SECURITY, ACCESS CONTROL AND ROBOTICS
    12. 6.12 SECURITY, ACCESS CONTROL AND ROBOTICS, BY TYPE, 2024 (% SHARE)
    13. 6.13 SECURITY, ACCESS CONTROL AND ROBOTICS, BY TYPE, 2024 TO 2035 (USD Million)
    14. 6.14 SECURITY, ACCESS CONTROL AND ROBOTICS, BY ROUTE OF ADMINISTRATION, 2024 (% SHARE)
    15. 6.15 SECURITY, ACCESS CONTROL AND ROBOTICS, BY ROUTE OF ADMINISTRATION, 2024 TO 2035 (USD Million)
    16. 6.16 SECURITY, ACCESS CONTROL AND ROBOTICS, BY PATIENT TYPE, 2024 (% SHARE)
    17. 6.17 SECURITY, ACCESS CONTROL AND ROBOTICS, BY PATIENT TYPE, 2024 TO 2035 (USD Million)
    18. 6.18 SECURITY, ACCESS CONTROL AND ROBOTICS, BY DISTRIBUTION CHANNEL, 2024 (% SHARE)
    19. 6.19 SECURITY, ACCESS CONTROL AND ROBOTICS, BY DISTRIBUTION CHANNEL, 2024 TO 2035 (USD Million)
    20. 6.20 BENCHMARKING OF MAJOR COMPETITORS
  7. 7 LIST OF TABLES
    1. 7.1 LIST OF ASSUMPTIONS
  8. 7.1.1
    1. 7.2 UK MARKET SIZE ESTIMATES; FORECAST
      1. 7.2.1 BY TYPE, 2025-2035 (USD Million)
      2. 7.2.2 BY ROUTE OF ADMINISTRATION, 2025-2035 (USD Million)
      3. 7.2.3 BY PATIENT TYPE, 2025-2035 (USD Million)
      4. 7.2.4 BY DISTRIBUTION CHANNEL, 2025-2035 (USD Million)
    2. 7.3 PRODUCT LAUNCH/PRODUCT DEVELOPMENT/APPROVAL
  9. 7.3.1
    1. 7.4 ACQUISITION/PARTNERSHIP
  10. 7.4.1

UK Security, Access Control and Robotics Market Segmentation

Security, Access Control and Robotics By Type (USD Million, 2025-2035)
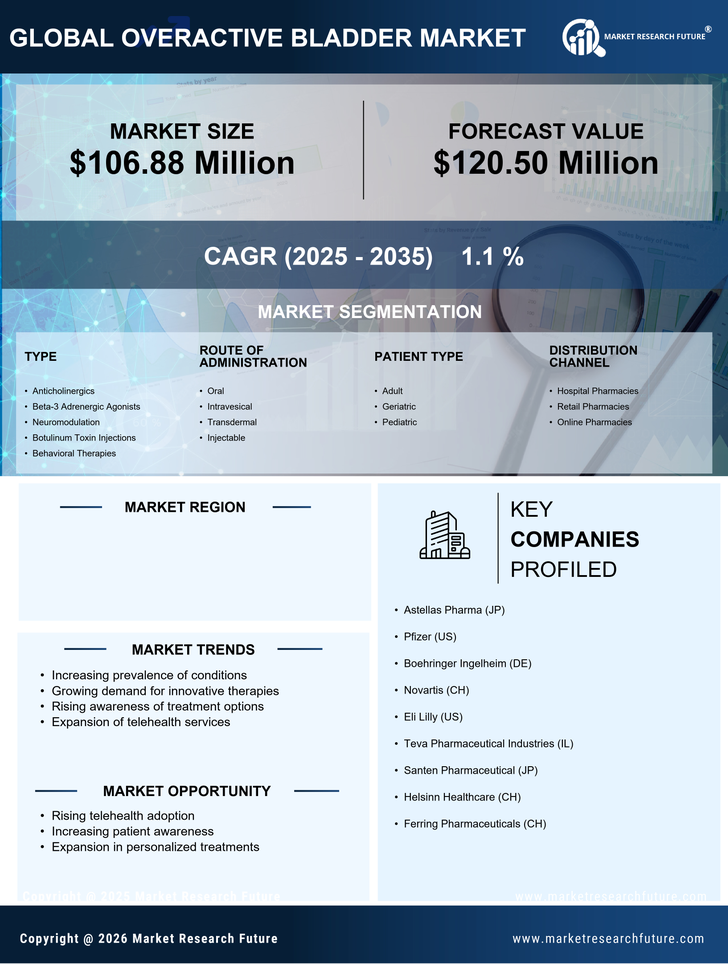
  • Anticholinergics
  • Beta-3 Adrenergic Agonists
  • Neuromodulation
  • Botulinum Toxin Injections
  • Behavioral Therapies

Security, Access Control and Robotics By Route of Administration (USD Million, 2025-2035)

  • Oral
  • Intravesical
  • Transdermal
  • Injectable

Security, Access Control and Robotics By Patient Type (USD Million, 2025-2035)

  • Adult
  • Geriatric
  • Pediatric

Security, Access Control and Robotics By Distribution Channel (USD Million, 2025-2035)

  • Hospital Pharmacies
  • Retail Pharmacies
  • Online Pharmacies

Compare Licence

×
Features License Type
Single User Multiuser License Enterprise User
Price $4,950 $5,950 $7,250
Maximum User Access Limit 1 User Upto 10 Users Unrestricted Access Throughout the Organization
Free Customization
Direct Access to Analyst
Deliverable Format
Platform Access
Discount on Next Purchase 10% 15% 15%
Printable Versions