Request Free Sample ×

Kindly complete the form below to receive a free sample of this Report

* Please use a valid business email

Leading companies partner with us for data-driven Insights

clients tt-cursor
Hero Background

UK Osteosynthesis Implants Market

ID: MRFR/MED/51649-HCR
200 Pages
Nidhi Mandole
Last Updated: February 06, 2026

UK Osteosynthesis Implants Market Research Report By Product (Screws and Plates, Wires and Pins, Intramedullary Rods and Nails, Spinal Fixation Devices), By Material (Stainless Steel, Titanium and Titanium Alloys, Bioabsorbable Polymers, Others), By Fracture Type (Hip Fracture, Knee Fracture, Spine Fracture, Shoulder Fracture, Others) and By End User (Hospitals, Orthopaedic Clinics, Ambulatory Surgical Centers) - Growth & Industry Forecast 2025 To 2035

Share:
Download PDF ×

We do not share your information with anyone. However, we may send you emails based on your report interest from time to time. You may contact us at any time to opt-out.

UK Osteosynthesis Implants Market Infographic
Purchase Options
  1. 1 SECTION I: EXECUTIVE SUMMARY AND KEY HIGHLIGHTS
  2.   1.1 EXECUTIVE SUMMARY
  3.     1.1.1 Market Overview
  4.     1.1.2 Key Findings
  5.     1.1.3 Market Segmentation
  6.     1.1.4 Competitive Landscape
  7.     1.1.5 Challenges and Opportunities
  8.     1.1.6 Future Outlook
  9. 2 SECTION II: SCOPING, METHODOLOGY AND MARKET STRUCTURE
  10.   2.1 MARKET INTRODUCTION
  11.     2.1.1 Definition
  12.     2.1.2 Scope of the study
  13.       2.1.2.1 Research Objective
  14.       2.1.2.2 Assumption
  15.       2.1.2.3 Limitations
  16.   2.2 RESEARCH METHODOLOGY
  17.     2.2.1 Overview
  18.     2.2.2 Data Mining
  19.     2.2.3 Secondary Research
  20.     2.2.4 Primary Research
  21.       2.2.4.1 Primary Interviews and Information Gathering Process
  22.       2.2.4.2 Breakdown of Primary Respondents
  23.     2.2.5 Forecasting Model
  24.     2.2.6 Market Size Estimation
  25.       2.2.6.1 Bottom-Up Approach
  26.       2.2.6.2 Top-Down Approach
  27.     2.2.7 Data Triangulation
  28.     2.2.8 Validation
  29. 3 SECTION III: QUALITATIVE ANALYSIS
  30.   3.1 MARKET DYNAMICS
  31.     3.1.1 Overview
  32.     3.1.2 Drivers
  33.     3.1.3 Restraints
  34.     3.1.4 Opportunities
  35.   3.2 MARKET FACTOR ANALYSIS
  36.     3.2.1 Value chain Analysis
  37.     3.2.2 Porter's Five Forces Analysis
  38.       3.2.2.1 Bargaining Power of Suppliers
  39.       3.2.2.2 Bargaining Power of Buyers
  40.       3.2.2.3 Threat of New Entrants
  41.       3.2.2.4 Threat of Substitutes
  42.       3.2.2.5 Intensity of Rivalry
  43.     3.2.3 COVID-19 Impact Analysis
  44.       3.2.3.1 Market Impact Analysis
  45.       3.2.3.2 Regional Impact
  46.       3.2.3.3 Opportunity and Threat Analysis
  47. 4 SECTION IV: QUANTITATIVE ANALYSIS
  48.   4.1 Food, Beverages & Nutrition, BY Product (USD Million)
  49.     4.1.1 Screws and Plates
  50.     4.1.2 Wires and Pins
  51.     4.1.3 Intramedullary Rods and Nails
  52.     4.1.4 Spinal Fixation Devices
  53.   4.2 Food, Beverages & Nutrition, BY Material (USD Million)
  54.     4.2.1 Stainless Steel
  55.     4.2.2 Titanium and Titanium Alloys
  56.     4.2.3 Bioabsorbable Polymers
  57.     4.2.4 Others
  58.   4.3 Food, Beverages & Nutrition, BY Fracture Type (USD Million)
  59.     4.3.1 Hip Fracture
  60.     4.3.2 Knee Fracture
  61.     4.3.3 Spine Fracture
  62.     4.3.4 Shoulder Fracture
  63.     4.3.5 Others
  64.   4.4 Food, Beverages & Nutrition, BY End User (USD Million)
  65.     4.4.1 Hospitals
  66.     4.4.2 Orthopedic Clinics
  67.     4.4.3 Ambulatory Surgical Centers
  68. 5 SECTION V: COMPETITIVE ANALYSIS
  69.   5.1 Competitive Landscape
  70.     5.1.1 Overview
  71.     5.1.2 Competitive Analysis
  72.     5.1.3 Market share Analysis
  73.     5.1.4 Major Growth Strategy in the Food, Beverages & Nutrition
  74.     5.1.5 Competitive Benchmarking
  75.     5.1.6 Leading Players in Terms of Number of Developments in the Food, Beverages & Nutrition
  76.     5.1.7 Key developments and growth strategies
  77.       5.1.7.1 New Product Launch/Service Deployment
  78.       5.1.7.2 Merger & Acquisitions
  79.       5.1.7.3 Joint Ventures
  80.     5.1.8 Major Players Financial Matrix
  81.       5.1.8.1 Sales and Operating Income
  82.       5.1.8.2 Major Players R&D Expenditure. 2023
  83.   5.2 Company Profiles
  84.     5.2.1 DePuy Synthes (US)
  85.       5.2.1.1 Financial Overview
  86.       5.2.1.2 Products Offered
  87.       5.2.1.3 Key Developments
  88.       5.2.1.4 SWOT Analysis
  89.       5.2.1.5 Key Strategies
  90.     5.2.2 Stryker (US)
  91.       5.2.2.1 Financial Overview
  92.       5.2.2.2 Products Offered
  93.       5.2.2.3 Key Developments
  94.       5.2.2.4 SWOT Analysis
  95.       5.2.2.5 Key Strategies
  96.     5.2.3 Zimmer Biomet (US)
  97.       5.2.3.1 Financial Overview
  98.       5.2.3.2 Products Offered
  99.       5.2.3.3 Key Developments
  100.       5.2.3.4 SWOT Analysis
  101.       5.2.3.5 Key Strategies
  102.     5.2.4 Smith & Nephew (GB)
  103.       5.2.4.1 Financial Overview
  104.       5.2.4.2 Products Offered
  105.       5.2.4.3 Key Developments
  106.       5.2.4.4 SWOT Analysis
  107.       5.2.4.5 Key Strategies
  108.     5.2.5 Medtronic (US)
  109.       5.2.5.1 Financial Overview
  110.       5.2.5.2 Products Offered
  111.       5.2.5.3 Key Developments
  112.       5.2.5.4 SWOT Analysis
  113.       5.2.5.5 Key Strategies
  114.     5.2.6 B. Braun Melsungen AG (DE)
  115.       5.2.6.1 Financial Overview
  116.       5.2.6.2 Products Offered
  117.       5.2.6.3 Key Developments
  118.       5.2.6.4 SWOT Analysis
  119.       5.2.6.5 Key Strategies
  120.     5.2.7 Orthofix Medical Inc. (US)
  121.       5.2.7.1 Financial Overview
  122.       5.2.7.2 Products Offered
  123.       5.2.7.3 Key Developments
  124.       5.2.7.4 SWOT Analysis
  125.       5.2.7.5 Key Strategies
  126.     5.2.8 NuVasive (US)
  127.       5.2.8.1 Financial Overview
  128.       5.2.8.2 Products Offered
  129.       5.2.8.3 Key Developments
  130.       5.2.8.4 SWOT Analysis
  131.       5.2.8.5 Key Strategies
  132.   5.3 Appendix
  133.     5.3.1 References
  134.     5.3.2 Related Reports
  135. 6 LIST OF FIGURES
  136.   6.1 MARKET SYNOPSIS
  137.   6.2 UK MARKET ANALYSIS BY PRODUCT
  138.   6.3 UK MARKET ANALYSIS BY MATERIAL
  139.   6.4 UK MARKET ANALYSIS BY FRACTURE TYPE
  140.   6.5 UK MARKET ANALYSIS BY END USER
  141.   6.6 KEY BUYING CRITERIA OF FOOD, BEVERAGES & NUTRITION
  142.   6.7 RESEARCH PROCESS OF MRFR
  143.   6.8 DRO ANALYSIS OF FOOD, BEVERAGES & NUTRITION
  144.   6.9 DRIVERS IMPACT ANALYSIS: FOOD, BEVERAGES & NUTRITION
  145.   6.10 RESTRAINTS IMPACT ANALYSIS: FOOD, BEVERAGES & NUTRITION
  146.   6.11 SUPPLY / VALUE CHAIN: FOOD, BEVERAGES & NUTRITION
  147.   6.12 FOOD, BEVERAGES & NUTRITION, BY PRODUCT, 2024 (% SHARE)
  148.   6.13 FOOD, BEVERAGES & NUTRITION, BY PRODUCT, 2024 TO 2035 (USD Million)
  149.   6.14 FOOD, BEVERAGES & NUTRITION, BY MATERIAL, 2024 (% SHARE)
  150.   6.15 FOOD, BEVERAGES & NUTRITION, BY MATERIAL, 2024 TO 2035 (USD Million)
  151.   6.16 FOOD, BEVERAGES & NUTRITION, BY FRACTURE TYPE, 2024 (% SHARE)
  152.   6.17 FOOD, BEVERAGES & NUTRITION, BY FRACTURE TYPE, 2024 TO 2035 (USD Million)
  153.   6.18 FOOD, BEVERAGES & NUTRITION, BY END USER, 2024 (% SHARE)
  154.   6.19 FOOD, BEVERAGES & NUTRITION, BY END USER, 2024 TO 2035 (USD Million)
  155.   6.20 BENCHMARKING OF MAJOR COMPETITORS
  156. 7 LIST OF TABLES
  157.   7.1 LIST OF ASSUMPTIONS
  158.     7.1.1
  159.   7.2 UK MARKET SIZE ESTIMATES; FORECAST
  160.     7.2.1 BY PRODUCT, 2025-2035 (USD Million)
  161.     7.2.2 BY MATERIAL, 2025-2035 (USD Million)
  162.     7.2.3 BY FRACTURE TYPE, 2025-2035 (USD Million)
  163.     7.2.4 BY END USER, 2025-2035 (USD Million)
  164.   7.3 PRODUCT LAUNCH/PRODUCT DEVELOPMENT/APPROVAL
  165.     7.3.1
  166.   7.4 ACQUISITION/PARTNERSHIP
  167.     7.4.1

UK Food, Beverages & Nutrition Market Segmentation

Food, Beverages & Nutrition By Product (USD Million, 2025-2035)
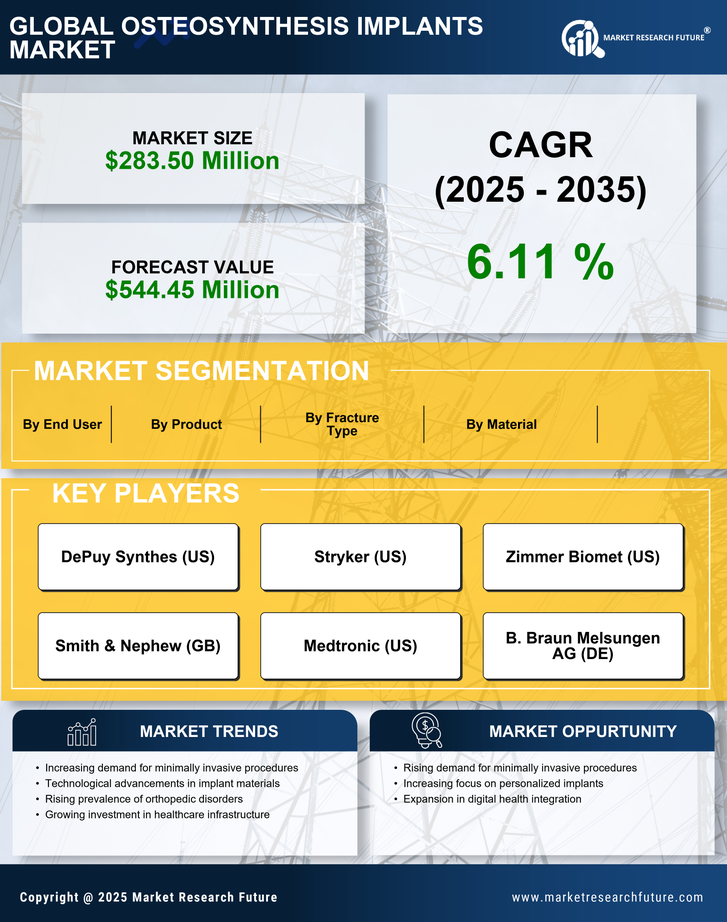
  • Screws and Plates
  • Wires and Pins
  • Intramedullary Rods and Nails
  • Spinal Fixation Devices

Food, Beverages & Nutrition By Material (USD Million, 2025-2035)

  • Stainless Steel
  • Titanium and Titanium Alloys
  • Bioabsorbable Polymers
  • Others

Food, Beverages & Nutrition By Fracture Type (USD Million, 2025-2035)

  • Hip Fracture
  • Knee Fracture
  • Spine Fracture
  • Shoulder Fracture
  • Others

Food, Beverages & Nutrition By End User (USD Million, 2025-2035)

  • Hospitals
  • Orthopedic Clinics
  • Ambulatory Surgical Centers

Compare Licence

×
Features License Type
Single User Multiuser License Enterprise User
Price $4,950 $5,950 $7,250
Maximum User Access Limit 1 User Upto 10 Users Unrestricted Access Throughout the Organization
Free Customization
Direct Access to Analyst
Deliverable Format
Platform Access
Discount on Next Purchase 10% 15% 15%
Printable Versions