Request Free Sample ×

Kindly complete the form below to receive a free sample of this Report

* Please use a valid business email

Leading companies partner with us for data-driven Insights

clients tt-cursor
Hero Background

UK Genetic Counseling Market

ID: MRFR/LS/50612-HCR
200 Pages
Vikita Thakur
Last Updated: February 06, 2026

UK Genetic Counseling Market Research Report: By Counseling Approach (Integrated, Independent, Discretionary Genetic Counseling), By Key Players Business Model (Core Genetic Counseling Companies, Direct-to-Consumer Genetic Testing Companies, Clinical Genetic Testing Companies), By Channel (Providers, Self-Referred Individuals), By Type of Service (Risk Assessment, Pharmacogenomics, Other Genetic Pediatric Care Counseling Services), By Application (Proactive Risk Assessment, GC For Intent-to-Treat Patients (ITT), Prenatal and Preconception Care, Other), By Target Population Segment (General Population, Patient Population) andBy Level of Service (Pre-counseling Support, Post Counseling Support) - Growth & Industry Forecast 2025 To 2035

Share:
Download PDF ×

We do not share your information with anyone. However, we may send you emails based on your report interest from time to time. You may contact us at any time to opt-out.

UK Genetic Counseling Market Infographic
Purchase Options
  1. 1 SECTION I: EXECUTIVE SUMMARY AND KEY HIGHLIGHTS
    1. 1.1 EXECUTIVE SUMMARY
      1. 1.1.1 Market Overview
      2. 1.1.2 Key Findings
      3. 1.1.3 Market Segmentation
      4. 1.1.4 Competitive Landscape
      5. 1.1.5 Challenges and Opportunities
      6. 1.1.6 Future Outlook
  2. 2 SECTION II: SCOPING, METHODOLOGY AND MARKET STRUCTURE
    1. 2.1 MARKET INTRODUCTION
      1. 2.1.1 Definition
      2. 2.1.2 Scope of the study
        1. 2.1.2.1 Research Objective
        2. 2.1.2.2 Assumption
        3. 2.1.2.3 Limitations
    2. 2.2 RESEARCH METHODOLOGY
      1. 2.2.1 Overview
      2. 2.2.2 Data Mining
      3. 2.2.3 Secondary Research
      4. 2.2.4 Primary Research
        1. 2.2.4.1 Primary Interviews and Information Gathering Process
        2. 2.2.4.2 Breakdown of Primary Respondents
      5. 2.2.5 Forecasting Model
      6. 2.2.6 Market Size Estimation
        1. 2.2.6.1 Bottom-Up Approach
        2. 2.2.6.2 Top-Down Approach
      7. 2.2.7 Data Triangulation
      8. 2.2.8 Validation
  3. 3 SECTION III: QUALITATIVE ANALYSIS
    1. 3.1 MARKET DYNAMICS
      1. 3.1.1 Overview
      2. 3.1.2 Drivers
      3. 3.1.3 Restraints
      4. 3.1.4 Opportunities
    2. 3.2 MARKET FACTOR ANALYSIS
      1. 3.2.1 Value chain Analysis
      2. 3.2.2 Porter's Five Forces Analysis
        1. 3.2.2.1 Bargaining Power of Suppliers
        2. 3.2.2.2 Bargaining Power of Buyers
        3. 3.2.2.3 Threat of New Entrants
        4. 3.2.2.4 Threat of Substitutes
        5. 3.2.2.5 Intensity of Rivalry
      3. 3.2.3 COVID-19 Impact Analysis
        1. 3.2.3.1 Market Impact Analysis
        2. 3.2.3.2 Regional Impact
        3. 3.2.3.3 Opportunity and Threat Analysis
  4. 4 SECTION IV: QUANTITATIVE ANALYSIS
    1. 4.1 Life Sciences, BY Counseling Approach (USD Million)
      1. 4.1.1 Integrated
      2. 4.1.2 Independent
      3. 4.1.3 Discretionary Genetic Counseling
    2. 4.2 Life Sciences, BY Key Players Business Model (USD Million)
      1. 4.2.1 Core Genetic Counseling Companies
      2. 4.2.2 Direct-to-Consumer Genetic Testing Companies
      3. 4.2.3 Clinical Genetic Testing Companies
    3. 4.3 Life Sciences, BY Channel (USD Million)
      1. 4.3.1 Providers
      2. 4.3.2 Self-Referred Individuals
    4. 4.4 Life Sciences, BY Type of Service (USD Million)
      1. 4.4.1 Risk Assessment
      2. 4.4.2 Pharmacogenomics
      3. 4.4.3 Other Genetic Pediatric Care Counseling Services
    5. 4.5 Life Sciences, BY Application (USD Million)
      1. 4.5.1 Proactive Risk Assessment
      2. 4.5.2 GC For Intent-to-Treat Patients (ITT)
      3. 4.5.3 Prenatal and Preconception Care
      4. 4.5.4 Others
    6. 4.6 Life Sciences, BY Target Population Segment (USD Million)
      1. 4.6.1 General Population
      2. 4.6.2 Patient Population
    7. 4.7 Life Sciences, BY Level of Service (USD Million)
      1. 4.7.1 Pre-counseling Support
      2. 4.7.2 Post Counseling Support
  5. 5 SECTION V: COMPETITIVE ANALYSIS
    1. 5.1 Competitive Landscape
      1. 5.1.1 Overview
      2. 5.1.2 Competitive Analysis
      3. 5.1.3 Market share Analysis
      4. 5.1.4 Major Growth Strategy in the Life Sciences
      5. 5.1.5 Competitive Benchmarking
      6. 5.1.6 Leading Players in Terms of Number of Developments in the Life Sciences
      7. 5.1.7 Key developments and growth strategies
        1. 5.1.7.1 New Product Launch/Service Deployment
        2. 5.1.7.2 Merger & Acquisitions
        3. 5.1.7.3 Joint Ventures
      8. 5.1.8 Major Players Financial Matrix
        1. 5.1.8.1 Sales and Operating Income
        2. 5.1.8.2 Major Players R&D Expenditure. 2023
    2. 5.2 Company Profiles
      1. 5.2.1 Myriad Genetics (US)
        1. 5.2.1.1 Financial Overview
        2. 5.2.1.2 Products Offered
        3. 5.2.1.3 Key Developments
        4. 5.2.1.4 SWOT Analysis
        5. 5.2.1.5 Key Strategies
      2. 5.2.2 Invitae Corporation (US)
        1. 5.2.2.1 Financial Overview
        2. 5.2.2.2 Products Offered
        3. 5.2.2.3 Key Developments
        4. 5.2.2.4 SWOT Analysis
        5. 5.2.2.5 Key Strategies
      3. 5.2.3 Ambry Genetics (US)
        1. 5.2.3.1 Financial Overview
        2. 5.2.3.2 Products Offered
        3. 5.2.3.3 Key Developments
        4. 5.2.3.4 SWOT Analysis
        5. 5.2.3.5 Key Strategies
      4. 5.2.4 GeneDx (US)
        1. 5.2.4.1 Financial Overview
        2. 5.2.4.2 Products Offered
        3. 5.2.4.3 Key Developments
        4. 5.2.4.4 SWOT Analysis
        5. 5.2.4.5 Key Strategies
      5. 5.2.5 Fulgent Genetics (US)
        1. 5.2.5.1 Financial Overview
        2. 5.2.5.2 Products Offered
        3. 5.2.5.3 Key Developments
        4. 5.2.5.4 SWOT Analysis
        5. 5.2.5.5 Key Strategies
      6. 5.2.6 23andMe (US)
        1. 5.2.6.1 Financial Overview
        2. 5.2.6.2 Products Offered
        3. 5.2.6.3 Key Developments
        4. 5.2.6.4 SWOT Analysis
        5. 5.2.6.5 Key Strategies
      7. 5.2.7 Color Genomics (US)
        1. 5.2.7.1 Financial Overview
        2. 5.2.7.2 Products Offered
        3. 5.2.7.3 Key Developments
        4. 5.2.7.4 SWOT Analysis
        5. 5.2.7.5 Key Strategies
      8. 5.2.8 Natera (US)
        1. 5.2.8.1 Financial Overview
        2. 5.2.8.2 Products Offered
        3. 5.2.8.3 Key Developments
        4. 5.2.8.4 SWOT Analysis
        5. 5.2.8.5 Key Strategies
    3. 5.3 Appendix
      1. 5.3.1 References
      2. 5.3.2 Related Reports
  6. 6 LIST OF FIGURES
    1. 6.1 MARKET SYNOPSIS
    2. 6.2 UK MARKET ANALYSIS BY COUNSELING APPROACH
    3. 6.3 UK MARKET ANALYSIS BY KEY PLAYERS BUSINESS MODEL
    4. 6.4 UK MARKET ANALYSIS BY CHANNEL
    5. 6.5 UK MARKET ANALYSIS BY TYPE OF SERVICE
    6. 6.6 UK MARKET ANALYSIS BY APPLICATION
    7. 6.7 UK MARKET ANALYSIS BY TARGET POPULATION SEGMENT
    8. 6.8 UK MARKET ANALYSIS BY LEVEL OF SERVICE
    9. 6.9 KEY BUYING CRITERIA OF LIFE SCIENCES
    10. 6.10 RESEARCH PROCESS OF MRFR
    11. 6.11 DRO ANALYSIS OF LIFE SCIENCES
    12. 6.12 DRIVERS IMPACT ANALYSIS: LIFE SCIENCES
    13. 6.13 RESTRAINTS IMPACT ANALYSIS: LIFE SCIENCES
    14. 6.14 SUPPLY / VALUE CHAIN: LIFE SCIENCES
    15. 6.15 LIFE SCIENCES, BY COUNSELING APPROACH, 2024 (% SHARE)
    16. 6.16 LIFE SCIENCES, BY COUNSELING APPROACH, 2024 TO 2035 (USD Million)
    17. 6.17 LIFE SCIENCES, BY KEY PLAYERS BUSINESS MODEL, 2024 (% SHARE)
    18. 6.18 LIFE SCIENCES, BY KEY PLAYERS BUSINESS MODEL, 2024 TO 2035 (USD Million)
    19. 6.19 LIFE SCIENCES, BY CHANNEL, 2024 (% SHARE)
    20. 6.20 LIFE SCIENCES, BY CHANNEL, 2024 TO 2035 (USD Million)
    21. 6.21 LIFE SCIENCES, BY TYPE OF SERVICE, 2024 (% SHARE)
    22. 6.22 LIFE SCIENCES, BY TYPE OF SERVICE, 2024 TO 2035 (USD Million)
    23. 6.23 LIFE SCIENCES, BY APPLICATION, 2024 (% SHARE)
    24. 6.24 LIFE SCIENCES, BY APPLICATION, 2024 TO 2035 (USD Million)
    25. 6.25 LIFE SCIENCES, BY TARGET POPULATION SEGMENT, 2024 (% SHARE)
    26. 6.26 LIFE SCIENCES, BY TARGET POPULATION SEGMENT, 2024 TO 2035 (USD Million)
    27. 6.27 LIFE SCIENCES, BY LEVEL OF SERVICE, 2024 (% SHARE)
    28. 6.28 LIFE SCIENCES, BY LEVEL OF SERVICE, 2024 TO 2035 (USD Million)
    29. 6.29 BENCHMARKING OF MAJOR COMPETITORS
  7. 7 LIST OF TABLES
    1. 7.1 LIST OF ASSUMPTIONS
  8. 7.1.1
    1. 7.2 UK MARKET SIZE ESTIMATES; FORECAST
      1. 7.2.1 BY COUNSELING APPROACH, 2025-2035 (USD Million)
      2. 7.2.2 BY KEY PLAYERS BUSINESS MODEL, 2025-2035 (USD Million)
      3. 7.2.3 BY CHANNEL, 2025-2035 (USD Million)
      4. 7.2.4 BY TYPE OF SERVICE, 2025-2035 (USD Million)
      5. 7.2.5 BY APPLICATION, 2025-2035 (USD Million)
      6. 7.2.6 BY TARGET POPULATION SEGMENT, 2025-2035 (USD Million)
      7. 7.2.7 BY LEVEL OF SERVICE, 2025-2035 (USD Million)
    2. 7.3 PRODUCT LAUNCH/PRODUCT DEVELOPMENT/APPROVAL
  9. 7.3.1
    1. 7.4 ACQUISITION/PARTNERSHIP
  10. 7.4.1

UK Life Sciences Market Segmentation

Life Sciences By Counseling Approach (USD Million, 2025-2035)
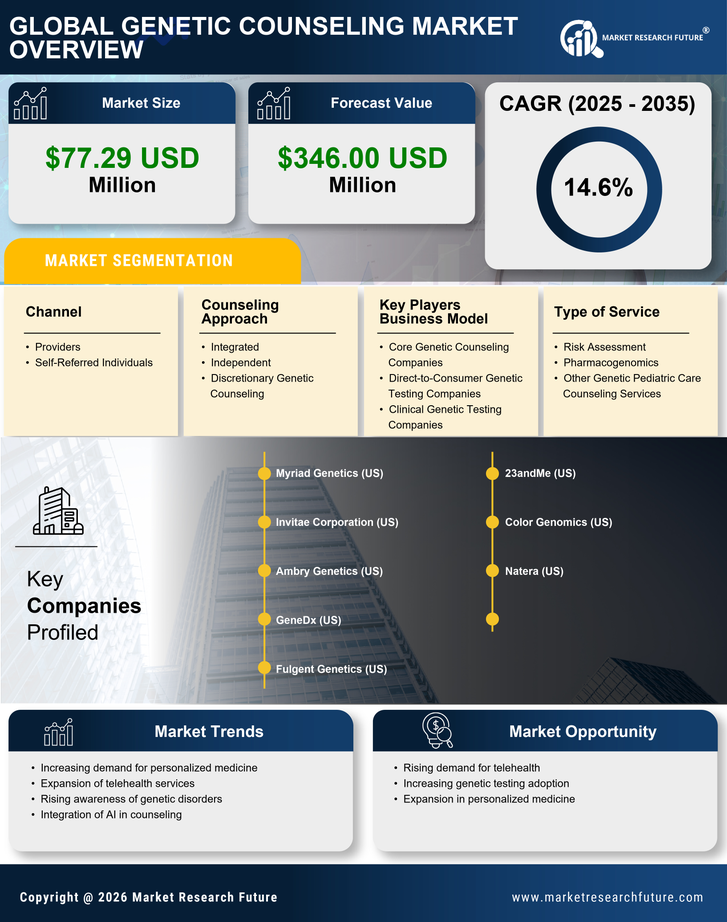
  • Integrated
  • Independent
  • Discretionary Genetic Counseling

Life Sciences By Key Players Business Model (USD Million, 2025-2035)

  • Core Genetic Counseling Companies
  • Direct-to-Consumer Genetic Testing Companies
  • Clinical Genetic Testing Companies

Life Sciences By Channel (USD Million, 2025-2035)

  • Providers
  • Self-Referred Individuals

Life Sciences By Type of Service (USD Million, 2025-2035)

  • Risk Assessment
  • Pharmacogenomics
  • Other Genetic Pediatric Care Counseling Services

Life Sciences By Application (USD Million, 2025-2035)

  • Proactive Risk Assessment
  • GC For Intent-to-Treat Patients (ITT)
  • Prenatal and Preconception Care
  • Others

Life Sciences By Target Population Segment (USD Million, 2025-2035)

  • General Population
  • Patient Population

Life Sciences By Level of Service (USD Million, 2025-2035)

  • Pre-counseling Support
  • Post Counseling Support

Compare Licence

×
Features License Type
Single User Multiuser License Enterprise User
Price $4,950 $5,950 $7,250
Maximum User Access Limit 1 User Upto 10 Users Unrestricted Access Throughout the Organization
Free Customization
Direct Access to Analyst
Deliverable Format
Platform Access
Discount on Next Purchase 10% 15% 15%
Printable Versions