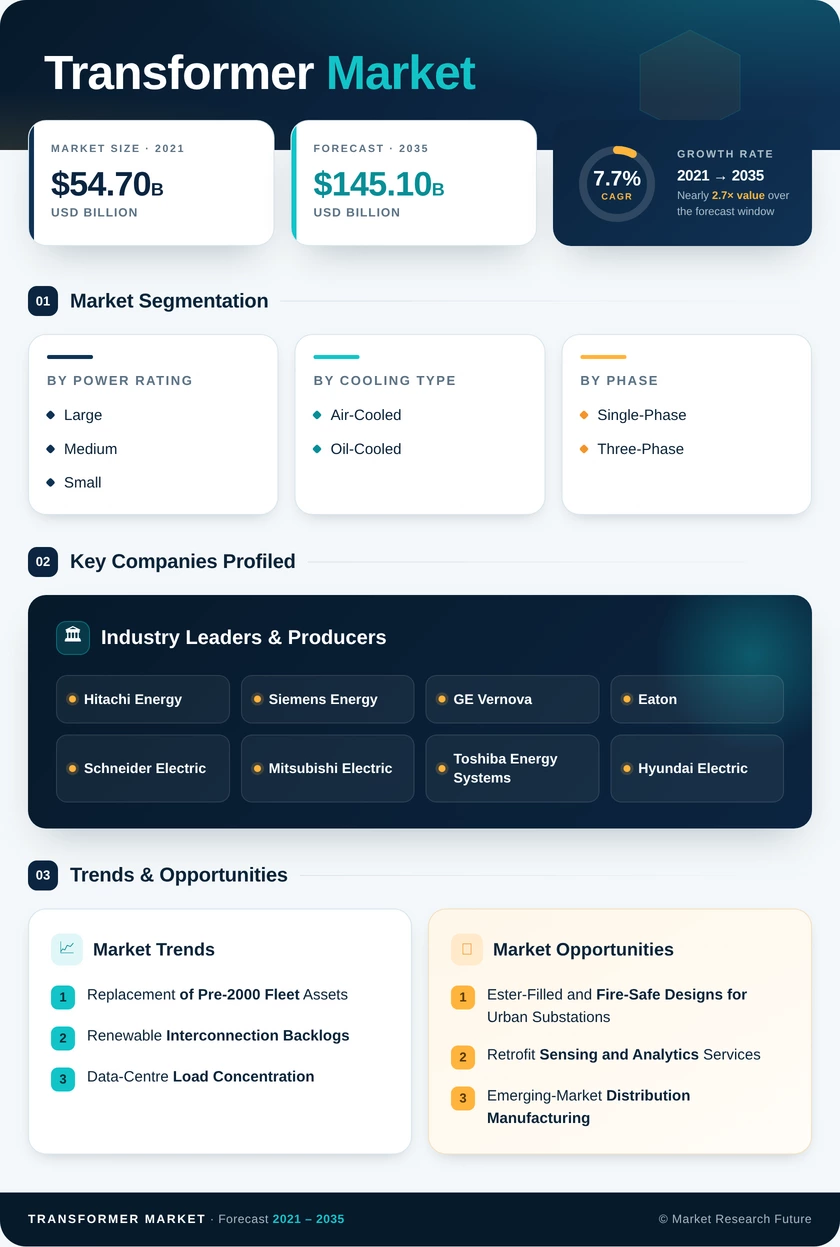
Transformers Market (2026 - 2035)

ID: MRFR/EnP/4524-CR 261 Pages Chitranshi Jaiswal Last Updated: October 17, 2026
Transformer Market Research Report By Power Rating (Large, Medium, Small), By Cooling Type (Air-Cooled, Oil-Cooled), By Phase (Single-Phase, Three-Phase), By Transformer Type (Power, Distribution), By End-User (Power Utilities, Industrial, Commercial, Residential) - Forecast to 2035
Transformers Market
Market Size
Forecast Period2026-2035
CAGR (2026-2035)7.7%
2025 Market SizeUSD 69.5 Billion
2035 Market SizeUSD 145.1 Billion
Key Players
Hitachi Energy
Siemens Energy
GE Vernova
Eaton
Schneider Electric
Mitsubishi Electric
Opportunities
  • Ester-Filled and Fire-Safe Designs for Urban Substations
  • Retrofit Sensing and Analytics Services
  • Emerging-Market Distribution Manufacturing
  1. 1 Market Summary | |
    1. 1.1 Study Assumptions & Market Definition | |
    2. 1.2 Scope of the Study | |
    3. 1.3 Research Methodology | |
  2. 2 Key Report Takeaways | |
    1. 2.1 By Cooling Type | |
    2. 2.2 By Power Rating | |
    3. 2.3 By Phase | |
    4. 2.4 By End User | |
    5. 2.5 By Region | |
  3. 3 Market Size & Forecast (2021–2035) | |
    1. 3.1 Historical Market Size (2021–2024) | |
    2. 3.2 Base Year Assessment (2025) | |
    3. 3.3 Forecast Market Size (2026–2035) | |
    4. 3.4 Year-over-Year Growth Analysis | |
  4. 4 Driver Impact Analysis | |
    1. 4.1 Replacement of Pre-2000 Fleet Assets | |
    2. 4.2 Renewable Interconnection Backlogs | |
    3. 4.3 Data-Centre Load Concentration | |
    4. 4.4 Distribution Expansion in Emerging Economies | |
  5. 5 Restraints Impact Analysis | |
    1. 5.1 Core Steel Supply Concentration | |
    2. 5.2 Lead Times That Outrun Project Schedules | |
    3. 5.3 Workforce and Certification Bottlenecks | |
  6. 6 Opportunities | |
    1. 6.1 Ester-Filled and Fire-Safe Designs for Urban Substations | |
    2. 6.2 Retrofit Sensing and Analytics Services | |
    3. 6.3 Emerging-Market Distribution Manufacturing | |
    4. 6.4 Modular and Prefabricated Substation Packages | |
    5. 6.5 Asset-Health Data Monetisation | |
  7. 7 Regional Market Share & Country-Level Analysis | |
    1. 7.1 North America | | |
      1. 7.1.1 US | | |
      2. 7.1.2 Canada | | |
      3. 7.1.3 Mexico | |
    2. 7.2 Europe | | |
      1. 7.2.1 Germany | | |
      2. 7.2.2 UK | | |
      3. 7.2.3 France | | |
      4. 7.2.4 Italy | | |
      5. 7.2.5 Spain | | |
      6. 7.2.6 Nordic Countries | | |
      7. 7.2.7 Russia | | |
      8. 7.2.8 Rest of Europe | |
    3. 7.3 Asia-Pacific | | |
      1. 7.3.1 China | | |
      2. 7.3.2 India | | |
      3. 7.3.3 Japan | | |
      4. 7.3.4 South Korea | | |
      5. 7.3.5 ASEAN | | |
      6. 7.3.6 Rest of Asia-Pacific | |
    4. 7.4 South America | | |
      1. 7.4.1 Brazil | | |
      2. 7.4.2 Argentina | | |
      3. 7.4.3 Rest of South America | |
    5. 7.5 Middle East & Africa | | |
      1. 7.5.1 Saudi Arabia | | |
      2. 7.5.2 UAE | | |
      3. 7.5.3 South Africa | | |
      4. 7.5.4 Egypt | | |
      5. 7.5.5 Rest of Middle East & Africa | |
  8. 8 Future Outlook (2026–2035) | |
    1. 8.1 Autonomous Asset Management | |
    2. 8.2 The Electrification Supercycle | |
    3. 8.3 Materials Substitution and Circularity | |
    4. 8.4 Supply Chain Regionalisation | |
  9. 9 Segmentation Analysis | |
    1. 9.1 By Power Rating | | |
      1. 9.1.1 Large | | |
      2. 9.1.2 Medium | | |
      3. 9.1.3 Small | |
    2. 9.2 By Cooling Type | | |
      1. 9.2.1 Air-Cooled | | |
      2. 9.2.2 Oil-Cooled | |
    3. 9.3 By Phase | | |
      1. 9.3.1 Single-Phase | | |
      2. 9.3.2 Three-Phase | |
    4. 9.4 By Transformer Type | | |
      1. 9.4.1 Power | | |
      2. 9.4.2 Distribution | |
    5. 9.5 By End-User | | |
      1. 9.5.1 Power Utilities | | |
      2. 9.5.2 Industrial | | |
      3. 9.5.3 Commercial | | |
      4. 9.5.4 Residential | |
  10. 10 Competitive Landscape | |
    1. 10.1 Market Concentration Analysis (2026) | |
    2. 10.2 Competitive Benchmarking Matrix | |
    3. 10.3 Company Profiles | | |
      1. 10.3.1 Hitachi Energy | | |
      2. 10.3.2 Siemens Energy | | |
      3. 10.3.3 GE Vernova | | |
      4. 10.3.4 Eaton | | |
      5. 10.3.5 Schneider Electric | | |
      6. 10.3.6 Mitsubishi Electric | | |
      7. 10.3.7 Toshiba Energy Systems | | |
      8. 10.3.8 Hyundai Electric | | |
      9. 10.3.9 TBEA | | |
      10. 10.3.10 Hyosung Heavy Industries | | |
      11. 10.3.11 Bharat Heavy Electricals | | |
      12. 10.3.12 WEG | |
  11. 11 Recent News & Developments | |
  12. 12 Report Scope & Methodology | |
    1. 12.1 Study Period & Base Year | |
    2. 12.2 Data Sources & Citations | |
    3. 12.3 Abbreviations | |
  13. 13 Detailed Sources and Citations | |
  14. 14 Frequently Asked Questions | | LIST OF TABLES | |
  15. TABLE 1 Global Transformer Market Size & Forecast, by Revenue (USD Billion), 2021–2035 | |
  16. TABLE 2 Global Transformer Market — Year-over-Year Growth Analysis, 2021–2035 | |
  17. TABLE 3 Driver Impact Analysis — Global Transformer Market, 2026–2035 | |
  18. TABLE 4 Restraint Impact Analysis — Global Transformer Market, 2026–2035 | |
  19. TABLE 5 Global Transformer Market Size, by Region, 2021–2035 (USD Billion) | |
  20. TABLE 6 North America Transformer Market Size, by Country, 2021–2035 (USD Billion) | |
  21. TABLE 7 Europe Transformer Market Size, by Country, 2021–2035 (USD Billion) | |
  22. TABLE 8 Asia-Pacific Transformer Market Size, by Country, 2021–2035 (USD Billion) | |
  23. TABLE 9 South America Transformer Market Size, by Country, 2021–2035 (USD Billion) | |
  24. TABLE 10 Middle East & Africa Transformer Market Size, by Country, 2021–2035 (USD Billion) | |
  25. TABLE 11 Global Transformer Market Size, by Power Rating, 2021–2035 (USD Billion) | |
  26. TABLE 12 Global Transformer Market Size, by Cooling Type, 2021–2035 (USD Billion) | |
  27. TABLE 13 Global Transformer Market Size, by Phase, 2021–2035 (USD Billion) | |
  28. TABLE 14 Global Transformer Market Size, by Transformer Type, 2021–2035 (USD Billion) | |
  29. TABLE 15 Global Transformer Market Size, by End-User, 2021–2035 (USD Billion) | |
  30. TABLE 16 North America Transformer Market Size, by Power Rating, 2021–2035 (USD Billion) | |
  31. TABLE 17 North America Transformer Market Size, by Cooling Type, 2021–2035 (USD Billion) | |
  32. TABLE 18 North America Transformer Market Size, by Transformer Type, 2021–2035 (USD Billion) | |
  33. TABLE 19 North America Transformer Market Size, by End-User, 2021–2035 (USD Billion) | |
  34. TABLE 20 Europe Transformer Market Size, by Power Rating, 2021–2035 (USD Billion) | |
  35. TABLE 21 Europe Transformer Market Size, by Cooling Type, 2021–2035 (USD Billion) | |
  36. TABLE 22 Europe Transformer Market Size, by Transformer Type, 2021–2035 (USD Billion) | |
  37. TABLE 23 Europe Transformer Market Size, by End-User, 2021–2035 (USD Billion) | |
  38. TABLE 24 Asia-Pacific Transformer Market Size, by Power Rating, 2021–2035 (USD Billion) | |
  39. TABLE 25 Asia-Pacific Transformer Market Size, by Cooling Type, 2021–2035 (USD Billion) | |
  40. TABLE 26 Asia-Pacific Transformer Market Size, by Transformer Type, 2021–2035 (USD Billion) | |
  41. TABLE 27 Asia-Pacific Transformer Market Size, by End-User, 2021–2035 (USD Billion) | |
  42. TABLE 28 South America Transformer Market Size, by Power Rating, 2021–2035 (USD Billion) | |
  43. TABLE 29 South America Transformer Market Size, by Transformer Type, 2021–2035 (USD Billion) | |
  44. TABLE 30 South America Transformer Market Size, by End-User, 2021–2035 (USD Billion) | |
  45. TABLE 31 Middle East & Africa Transformer Market Size, by Power Rating, 2021–2035 (USD Billion) | |
  46. TABLE 32 Middle East & Africa Transformer Market Size, by Transformer Type, 2021–2035 (USD Billion) | |
  47. TABLE 33 Middle East & Africa Transformer Market Size, by End-User, 2021–2035 (USD Billion) | |
  48. TABLE 34 US Transformer Market Size, by Transformer Type, 2021–2035 (USD Billion) | |
  49. TABLE 35 China Transformer Market Size, by Transformer Type, 2021–2035 (USD Billion) | |
  50. TABLE 36 India Transformer Market Size, by Transformer Type, 2021–2035 (USD Billion) | |
  51. TABLE 37 Germany Transformer Market Size, by Transformer Type, 2021–2035 (USD Billion) | |
  52. TABLE 38 Competitive Benchmarking Matrix — Global Transformer Market, 2026 | |
  53. TABLE 39 Company Profiles — Key Players, Global Transformer Market | |
  54. TABLE 40 Recent Developments & Strategic Announcements, 2023–2025 | |
  55. TABLE 41 Report Scope & Methodology Summary | |
  56. TABLE 42 Detailed Sources and Citations | | LIST OF FIGURES | |
  57. FIGURE 1 Global Transformer Market — Market Dynamics Overview (Drivers, Restraints, Opportunities) | |
  58. FIGURE 2 Industry Value Chain Analysis — Core Steel to Utility Commissioning | |
  59. FIGURE 3 Porter's Five Forces Analysis — Global Transformer Market, 2026 | |
  60. FIGURE 4 Global Transformer Market Size Trend, 2021–2035 (USD Billion) | |
  61. FIGURE 5 Year-over-Year Growth Trajectory, 2022–2035 (%) | |
  62. FIGURE 6 Market Share by Power Rating, 2025 vs 2035 (%) | |
  63. FIGURE 7 Market Share by Cooling Type, 2025 vs 2035 (%) | |
  64. FIGURE 8 Market Share by Phase, 2025 (%) | |
  65. FIGURE 9 Market Share by Transformer Type, 2025 vs 2035 (%) | |
  66. FIGURE 10 Market Share by End-User, 2025 (%) | |
  67. FIGURE 11 Regional Revenue Share Distribution, 2025 (%) | |
  68. FIGURE 12 Regional CAGR Comparison, 2026–2035 (%) | |
  69. FIGURE 13 North America Country-Level Share Breakdown, 2025 (%) | |
  70. FIGURE 14 Asia-Pacific Country-Level Share Breakdown, 2025 (%) | |
  71. FIGURE 15 Europe Country-Level Share Breakdown, 2025 (%) | |
  72. FIGURE 16 Competitive Landscape — Estimated Revenue Share Ranges, 2026 | |
  73. FIGURE 17 Competitive Positioning Matrix — Portfolio Breadth vs Delivery Capability | |
  74. FIGURE 18 Lead Time and Backlog Trend Analysis, 2021–2028 | |
  75. FIGURE 19 Grid Investment Correlation with Equipment Demand, 2021–2035

Segmentation Quick Reference

DimensionSub-SegmentsDominant SegmentFastest Growing Segment
By Power RatingLarge, Medium, SmallSmallSmall
By Cooling TypeAir-Cooled, Oil-CooledOil-CooledAir-Cooled
By PhaseSingle-Phase, Three-PhaseThree-PhaseThree-Phase
By Transformer TypePower, DistributionDistributionDistribution
By End-UserPower Utilities, Industrial, Commercial, ResidentialPower UtilitiesIndustrial
By GeographyNorth America, Europe, Asia-Pacific, South America, Middle East & AfricaAsia-PacificAsia-Pacific


Market Segmentation Overview

By Power Rating

Sub-SegmentKey Trend
LargeOrder books extend past 30 months; premium pricing on transmission-class units
MediumStandardised designs for industrial campuses and mid-voltage substations
SmallHighest unit volumes; loss-reduction mandates accelerating replacement cycles


Rating structure follows where networks are physically expanding. Small units multiply with every new feeder and rooftop solar connection, while large ratings track corridor-level transmission projects that carry longer approval and construction timelines.

By Cooling Type

Sub-SegmentKey Trend
Air-CooledPreferred for indoor, offshore, and fire-sensitive installations; no containment required
Oil-CooledRetains transmission dominance; migration toward biodegradable ester dielectrics


Cooling selection has become a siting decision rather than a purely thermal one. Urban substations and offshore platforms increasingly reject liquid designs outright, while transmission duty continues to demand the overload headroom that immersion provides.

By Phase

Sub-SegmentKey Trend
Single-PhaseConcentrated in North American residential feeders; storm-driven replacement demand
Three-PhaseStandard for utility transmission, industrial supply, and renewable step-up duty


Phase configuration mirrors network architecture more than buyer preference. Three-phase remains the global default outside North American residential distribution, where legacy single-phase topology sustains substantial ongoing unit volume.

By Transformer Type

Sub-SegmentKey Trend
PowerLongest lead times; highest engineering content and test facility dependency
DistributionVolume engine of the sector; efficiency regulation reshaping design baselines


Product split defines two very different commercial models. Power units are engineered-to-order with multi-year cycles and negotiated pricing, while distribution units are catalogue products competing on cost, efficiency class, and delivery speed.

By End-User

Sub-SegmentKey Trend
Power UtilitiesMulti-year framework agreements replacing project-by-project tendering
IndustrialElectrolysers, mining fleets, and fabrication plants driving dedicated substation demand
CommercialHyperscale data centres bypassing intermediaries for direct factory orders
ResidentialNew housing stock and distributed solar connections sustaining steady replacement


Buyer composition has broadened meaningfully since 2022. Utilities still set technical standards, but commercial and industrial customers now influence delivery priorities in ways that were unusual a decade ago, particularly where single sites request utility-scale capacity.




Download PDF ×

We do not share your information with anyone. However, we may send you emails based on your report interest from time to time. You may contact us at any time to opt-out.