ID: MRFR/SEM/5587-HCR | February 2021 | Region: Global | 100 pages
Market Synopsis
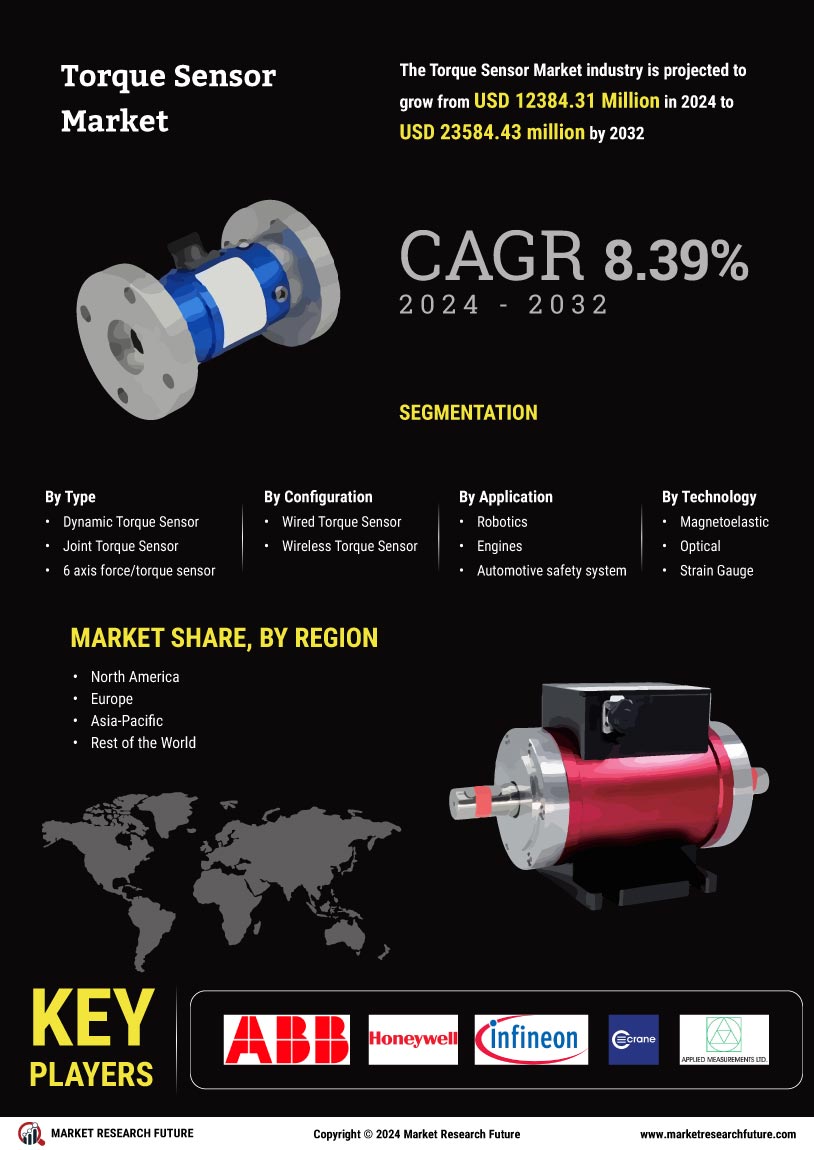
Torque sensor have numerous applications across various industry verticals such as automotive, industrial, aerospace among others. Torque sensors are used for measuring the torque on rotating systems which include electric motors, engines, crankshafts, and gearboxes. Growing demand for electric and hybrid vehicles across the globe coupled with rising need for electric power steering (EPS) systems is driving the market for Torque sensor. The torque sensors are suited in a wide variety of applications including torsional test machines, motor dynamometers, electric motor testing, fan testing, hydraulic pump testing among others. The installation of reaction torque sensors is cost effective as these do not comprise of slip-rings, bearings, or other rotating elements. However, rotary torque sensors provide high accuracies and (revolutions per minute) RPM ratings. Rotary torque sensors are used for electric motor testing, dynamometer testing, gearbox testing, automotive engine testing and drive train measurements. Recently, there have been lot of developments in wireless and non-contact torque sensors including optical torque, and magnetoelastic which is expected to increase the application of torque sensors in several industries such as robotics.
Among all the application segments, automotive segment is the largest revenue generating segment and is expected to continue its dominance throughout the forecast period. The growing demand for better fuel efficiency, electrical power steering and condition-based maintenance is one of the major factors impacting the growth of torque sensor market. Application of torque sensors in robotics is expected to create opportunities for the market during the forecast period. However, low reliability in high end applications is expected to hamper the growth of torque sensor market.
Segmentation
By type, the market is segmented into rotary torque sensor and reaction torque sensor. Rotary torque sensor is further bifurcated into contact-based sensing and noncontact-based sensing. By technology, the market is segmented into surface acoustic wave (SAW), magnetoelastic, optical and strain gauge. By application, the market is segmented into automotive, industrial, test & measurement, aerospace & defense and others.
Regional analysis
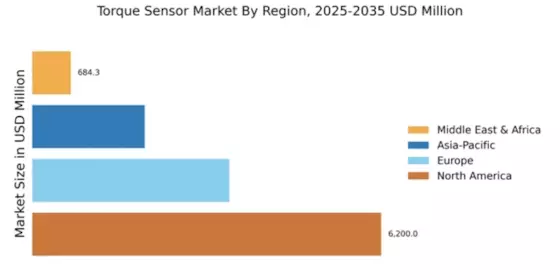
The global market for torque sensor is estimated to grow at a significant rate during the forecast period from 2018 to 2023. The geographical analysis of torque sensor market is studied for North America, Europe, Asia-Pacific, and the rest of the world (including the Middle East, Africa, and Latin America). Among the regions mentioned, Asia-Pacific is expected to dominate the torque sensor market. Countries such as china, Japan and South Korea are some of the major contributors to the market. Also, rise in industrial automation and production of light vehicles in this region is driving the torque sensor market. Furthermore, the growth of sectors such as aerospace and oil and gas in China and India is expected to propel the demand for torque sensors during the forecast period. Asia-Pacific is followed by Europe owing to the presence of automotive manufacturers in the region. New standards such as corporate average fuel economy (CAFE) standards are enabling the the development of electric and hybrid vehicles in the region along with improving fuel economy in vehicles, which is driving the demand for torque sensors.
Global Torque Sensor Market, USD Billions
Source: MRFR Analysis
The global torque sensor market was valued at USD 8.25 billion in 2017 and is exected to reach USD 12.69 billion by the end of forecast period with a CAGR of 7.82%.
Key players
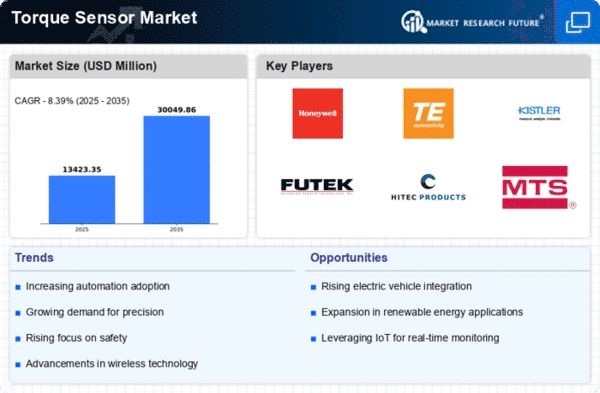
The key players in the Torque Sensor market are identified across all the major regions based on their country of origin, presence across different regions, recent key developments, product diversification, and industry expertise. Some of them are – ABB (Switzerland), Honeywell International (US), Infineon Technologies (Germany), Crane Electronics (UK), Applied Measurements (UK), Kistler Holding (Switzerland), Norbar Torque Tools (UK), Sensor Technology (UK), Hottinger Baldwin Messtechnik (Germany), and FUTEK Advanced Sensor Technology (US). These players contribute a major share in the growth of Torque Sensor market.
Apart from the top key players, there are other players that contribute to the market growth. These include Datum Electronics Ltd. (UK), PCB Piezotronics Inc. (US), TE Connectivity (Switzerland) and HBM Test and Measurement (US), and others.
Intended Audience
Frequently Asked Questions (FAQ) :
At 7.82% CAGR, the torque sensor market poised to value at USD 12.69 Bn by 2023.
Infineon Technologies (Germany), Applied Measurements (UK), Crane Electronics (UK), and Kistler Holding (Switzerland) are some prominent names in the torque sensor market.
Torque sensors is largely adopted by the automobile industry. Aerospace and defense are other sectors that deploy torque sensor.
Magnetoelastic, acoustic wave (SAW), and optical and strain gauge technologies adopted by torque sensor.
The high automobile production rate in APAC is expected to win high profit for the regional torque sensor market.
TABLE OF CONTENTS
1 Executive Summary
2 Scope of the Report
2.1 Market Definition
2.2 Scope of the Study
2.3 Research Objectives
2.4 Markets Structure
3 Market Research Methodology
3.1 Research Process
3.2 Secondary Research
3.3 Primary Research
3.4 Forecast Model
4 Market Landscape
4.1 Porter’s Five Forces Analysis
4.1.1 Threat of New Entrants
4.1.2 Bargaining Power of Buyers
4.1.3 Threat of Substitutes
4.1.4 Segment Rivalry
4.1.5 Bargaining Power of Suppliers
4.2 Value Chain/Supply Chain of Torque Sensor
5 Market Landscape
5.1 Introduction
5.2 Growth Drivers
5.3 Impact Analysis
5.4 Market Challenges
6 Market Trends
6.1 Introduction
6.2 Growth Trends
6.3 Impact Analysis
7 Torque Sensor Market by Type
7.1 Introduction
7.2 Reaction Torque Sensor
7.2.1 Market Estimates & Forecast, 2018–2023
7.2.2 Market Estimates & Forecast by Region, 2018–2023
7.3 Rotary Torque Sensor
7.3.1 Market Estimates & Forecast, 2018–2023
7.3.2 Market Estimates & Forecast by Region, 2018–2023
7.3.3 Contact Based Sensing
7.3.3.1 Market Estimates & Forecast, 2018–2023
7.3.3.2 Market Estimates & Forecast by Region, 2018–2023
7.3.4 Non-Contact-Based Sensing
7.3.4.1 Market Estimates & Forecast, 2018–2023
7.3.4.2 Market Estimates & Forecast by Region, 2018–2023
8 Torque Sensor Market by Technology
8.1 Introduction
8.2 Surface Acoustic Wave
8.2.1 Market Estimates & Forecast, 2018–2023
8.2.2 Market Estimates & Forecast by Region, 2018–2023
8.3 Magnetoelastic
8.3.1 Market Estimates & Forecast, 2018–2023
8.3.2 Market Estimates & Forecast by Region, 2018–2023
8.4 Optical
8.4.1 Market Estimates & Forecast, 2018–2023
8.4.2 Market Estimates & Forecast by Region, 2018–2023
8.5 Strain Gauge
8.5.1 Market Estimates & Forecast, 2018–2023
8.5.2 Market Estimates & Forecast by Region, 2018–2023
9 Torque Sensor Market by Application
9.1 Introduction
9.2 Automotive
9.2.1 Market Estimates & Forecast, 2018–2023
9.2.2 Market Estimates & Forecast by Region, 2018–2023
9.3 Industrial
9.3.1 Market Estimates & Forecast, 2018–2023
9.3.2 Market Estimates & Forecast by Region, 2018–2023
9.4 Test & Measurement
9.4.1 Market Estimates & Forecast, 2018–2023
9.4.2 Market Estimates & Forecast by Region, 2018–2023
9.5 Aerospace & Defense
9.5.1 Market Estimates & Forecast, 2018–2023
9.5.2 Market Estimates & Forecast by Region, 2018–2023
9.6 Others
9.6.1 Market Estimates & Forecast, 2018–2023
9.6.2 Market Estimates & Forecast by Region, 2018–2023
10 Torque Sensor Market by Region
10.1 Introduction
10.2 North America
10.2.1 Market Estimates & Forecast by Country, 2018–2023
10.2.2 Market Estimates & Forecast by Type, 2018–2023
10.2.3 Market Estimates & Forecast by Technology, 2018–2023
10.2.4 Market Estimates & Forecast by Application, 2018–2023
10.2.5 US
10.2.5.1 Market Estimates & Forecast by Type, 2018–2023
10.2.5.2 Market Estimates & Forecast by Technology, 2018–2023
10.2.5.3 Market Estimates & Forecast by Application, 2018–2023
10.2.6 Mexico
10.2.6.1 Market Estimates & Forecast by Type, 2018–2023
10.2.6.2 Market Estimates & Forecast by Technology, 2018–2023
10.2.6.3 Market Estimates & Forecast by Application, 2018–2023
10.2.7 Canada
10.2.7.1 Market Estimates & Forecast by Type, 2018–2023
10.2.7.2 Market Estimates & Forecast by Technology, 2018–2023
10.2.7.3 Market Estimates & Forecast by Application, 2018–2023
10.3 Europe
10.3.1 Market Estimates & Forecast by Country, 2018–2023
10.3.2 Market Estimates & Forecast by Type, 2018–2023
10.3.3 Market Estimates & Forecast by Technology, 2018–2023
10.3.4 Market Estimates & Forecast by Application, 2018–2023
10.3.5 Germany
10.3.5.1 Market Estimates & Forecast by Type, 2018–2023
10.3.5.2 Market Estimates & Forecast by Technology, 2018–2023
10.3.5.3 Market Estimates & Forecast by Application, 2018–2023
10.3.6 UK
10.3.6.1 Market Estimates & Forecast by Type, 2018–2023
10.3.6.2 Market Estimates & Forecast by Technology, 2018–2023
10.3.6.3 Market Estimates & Forecast by Application, 2018–2023
10.3.7 France
10.3.7.1 Market Estimates & Forecast by Type, 2018–2023
10.3.7.2 Market Estimates & Forecast by Technology, 2018–2023
10.3.7.3 Market Estimates & Forecast by Application, 2018–2023
10.3.8 Rest of Europe
10.3.8.1 Market Estimates & Forecast by Type, 2018–2023
10.3.8.2 Market Estimates & Forecast by Technology, 2018–2023
10.3.8.3 Market Estimates & Forecast by Application, 2018–2023
10.4 Asia-Pacific
10.4.1 Market Estimates & Forecast by Country, 2018–2023
10.4.2 Market Estimates & Forecast by Type, 2018–2023
10.4.3 Market Estimates & Forecast by Technology, 2018–2023
10.4.4 Market Estimates & Forecast by Application, 2018–2023
10.4.5 China
10.4.5.1 Market Estimates & Forecast by Type, 2018–2023
10.4.5.2 Market Estimates & Forecast by Technology, 2018–2023
10.4.5.3 Market Estimates & Forecast by Application, 2018–2023
10.4.6 India
10.4.6.1 Market Estimates & Forecast by Type, 2018–2023
10.4.6.2 Market Estimates & Forecast by Technology, 2018–2023
10.4.6.3 Market Estimates & Forecast by Application, 2018–2023
10.4.7 Japan
10.4.7.1 Market Estimates & Forecast by Type, 2018–2023
10.4.7.2 Market Estimates & Forecast by Technology, 2018–2023
10.4.7.3 Market Estimates & Forecast by Application, 2018–2023
10.4.8 Rest of Asia-Pacific
10.4.8.1 Market Estimates & Forecast by Type, 2018–2023
10.4.8.2 Market Estimates & Forecast by Technology, 2018–2023
10.4.8.3 Market Estimates & Forecast by Application, 2018–2023
10.5 Rest of the World
10.5.1 Market Estimates & Forecast by Country, 2018–2023
10.5.2 Market Estimates & Forecast by Type, 2018–2023
10.5.3 Market Estimates & Forecast by Technology, 2018–2023
10.5.4 Market Estimates & Forecast by Application, 2018–2023
10.5.5 Middle East & Africa
10.5.5.1 Market Estimates & Forecast by Type, 2018–2023
10.5.5.2 Market Estimates & Forecast by Technology, 2018–2023
10.5.5.3 Market Estimates & Forecast by Application, 2018–2023
10.5.6 Latin America
10.5.6.1 Market Estimates & Forecast by Type, 2018–2023
10.5.6.2 Market Estimates & Forecast by Technology, 2018–2023
10.5.6.3 Market Estimates & Forecast by Application, 2018–2023
11 Competitive Landscape
12 Company Profiles
12.1 ABB
12.1.1 Company Overview
12.1.2 Product/Business Segment Overview
12.1.3 Financial Updates
12.1.4 Key Developments
12.1.5 SWOT Analysis
12.1.6 Key Strategy
12.2 Honeywell International
12.2.1 Company Overview
12.2.2 Product/Business Segment Overview
12.2.3 Financial Updates
12.2.4 Key Developments
12.2.5 SWOT Analysis
12.2.6 Key Strategy
12.3 Infineon Technologies
12.3.1 Company Overview
12.3.2 Product/Business Segment Overview
12.3.3 Financial Updates
12.3.4 Key Developments
12.3.5 SWOT Analysis
12.3.6 Key Strategy
12.4 Crane Electronics
12.4.1 Company Overview
12.4.2 Product/Business Segment Overview
12.4.3 Financial Updates
12.4.4 Key Developments
12.4.5 SWOT Analysis
12.4.6 Key Strategy
12.5 Applied Measurements
12.5.1 Company Overview
12.5.2 Product/Business Segment Overview
12.5.3 Financial Updates
12.5.4 Key Developments
12.5.5 SWOT Analysis
12.5.6 Key Strategy
12.6 Kistler Holding
12.6.1 Company Overview
12.6.2 Product/Business Segment Overview
12.6.3 Financial Updates
12.6.4 Key Developments
12.6.5 SWOT Analysis
12.6.6 Key Strategy
12.7 Norbar Torque Tools
12.7.1 Company Overview
12.7.2 Product/Business Segment Overview
12.7.3 Financial Updates
12.7.4 Key Developments
12.7.5 SWOT Analysis
12.7.6 Key Strategy
12.8 Sensor Technology
12.8.1 Company Overview
12.8.2 Product/Business Segment Overview
12.8.3 Financial Updates
12.8.4 Key Developments
12.8.5 SWOT Analysis
12.8.6 Key Strategy
12.9 Hottinger Baldwin Messtechnik
12.9.1 Company Overview
12.9.2 Product/Business Segment Overview
12.9.3 Financial Updates
12.9.4 Key Developments
12.9.5 SWOT Analysis
12.9.6 Key Strategy
12.10 FUTEK Advanced Sensor Technology
12.10.1 Company Overview
12.10.2 Product/Business Segment Overview
12.10.3 Financial Updates
12.10.4 Key Developments
12.10.5 SWOT Analysis
12.10.6 Key Strategy
13 Conclusion
LIST OF TABLES
Table 1 Torque Sensor Market, by Region, 2018–2023
Table 2 North America: Torque Sensor Market, by Country, 2018–2023
Table 3 Europe: Torque Sensor Market, by Country, 2018–2023
Table 4 Asia-Pacific: Torque Sensor Market, by Country, 2018–2023
Table 5 Middle East & Africa: Torque Sensor Market, by Country, 2018–2023
Table 6 Latin America: Torque Sensor Market, by Country, 2018–2023
Table 7 Global Torque Sensor Type Market, by Region, 2018–2023
Table 8 North America: Torque Sensor Type Market, by Country, 2018–2023
Table 9 Europe: Torque Sensor Type Market, by Country, 2018–2023
Table 10 Asia-Pacific: Torque Sensor Type Market, by Country, 2018–2023
Table 11 Middle East & Africa: Torque Sensor Type Market, by Country, 2018–2023
Table 12 Latin America: Torque Sensor Type Market, by Country, 2018–2023
Table 13 Global Torque Sensor Technology Market, by Region, 2018–2023
Table 14 North America: Torque Sensor Technology Market, by Country, 2018–2023
Table 15 Europe: Torque Sensor Technology Market, by Country, 2018–2023
Table 16 Asia-Pacific: Torque Sensor Technology Market, by Country, 2018–2023
Table 17 Middle East & Africa: Torque Sensor Technology Market, by Country, 2018–2023
Table 18 Global Torque Sensor Application Market, by Region, 2018–2023
Table 19 North America: Torque Sensor Application Market, by Country, 2018–2023
Table 20 Europe: Torque Sensor Application Market, by Country, 2018–2023
Table 21 Asia-Pacific: Torque Sensor Application Market, by Country, 2018–2023
Table 22 Middle East & Africa: Torque Sensor Application Market, by Country, 2018–2023
Table 23 Latin America: Torque Sensor Application Market, by Country, 2018–2023
LIST OF FIGURES
FIGURE 1 Global Torque Sensor Market Segmentation
FIGURE 2 Forecast Methodology
FIGURE 3 Porter’s Five Forces Analysis of Global Torque Sensor Market
FIGURE 4 Value Chain of Global Torque Sensor Market
FIGURE 5 Share of Global Torque Sensor Market in 2017, by Country (in %)
FIGURE 6 Global Torque Sensor Market, 2018–2023
FIGURE 7 Global Torque Sensor Market Size, by Type, 2017
FIGURE 8 Share of Global Torque Sensor Market, by Type, 2018 to 2023
FIGURE 9 Global Torque Sensor Market Size, by Technology, 2017
FIGURE 10 Share of Global Torque Sensor Market, by Technology, 2018 to 2023
FIGURE 11 Global Torque Sensor Market Size, by Application, 2017
FIGURE 12 Share of Global Torque Sensor Market, by Application, 2018 to 2023