Tonic Water Market (2026 - 2035)

ID: MRFR/FnB/4982-CR 128 Pages Snehal Singh Last Updated: October 12, 2026
Tonic Water Market Size, Share, Industry Trend & Analysis Research Report Information By Type (Regular, Low-Calorie, Slimline/Light), By Packaging Type (PET/Glass Bottles, Metal Can), By Distribution Channel (HoReCa, Retail), By Geography (North America, Europe, Asia-Pacific, South America, Middle East & Africa) – Forecast Till 2035
Tonic Water Market
Market Size
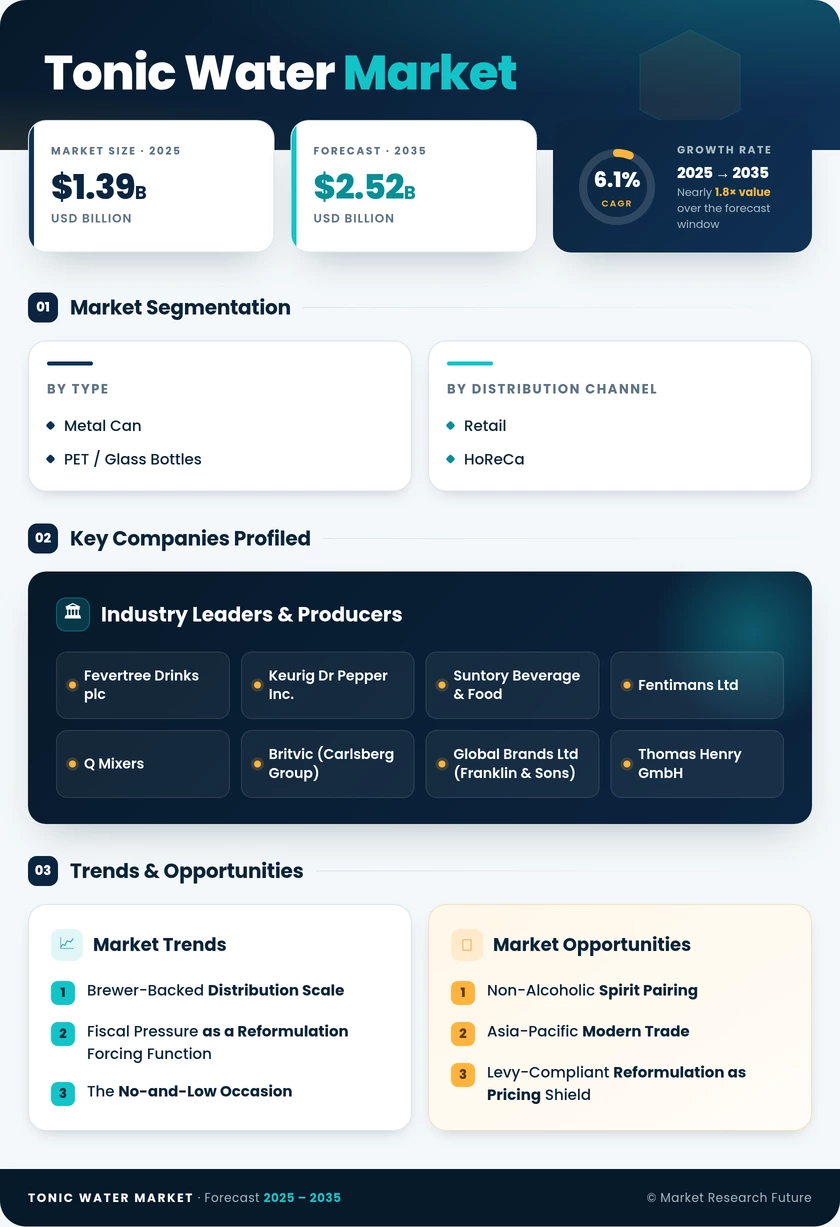
Forecast Period2026-2035
CAGR (2026-2035)6.1%
2025 Market SizeUSD 1.39 billion
2026 Market SizeUSD 1.48 billion
2035 Market SizeUSD 2.52 billion
Key Players
Fevertree Drinks plc
Keurig Dr Pepper Inc.
Suntory Beverage & Food
Fentimans Ltd
Q Mixers
Britvic
Opportunities
  • Non-Alcoholic Spirit Pairing
  • Asia-Pacific Modern Trade
  • Levy-Compliant Reformulation as Pricing Shield
  1. 1 Market Overview |
    1. 1.1 Study Assumptions & Market Definition |
    2. 1.2 Scope of the Study |
    3. 1.3 Research Methodology
  2. 2 Market Summary & Key Takeaways
  3. 3 Global Market Size & Forecast (2021–2035) |
    1. 3.1 Historical Market Size (2021–2025) |
    2. 3.2 Current & Forecast Market Size (2026–2035) |
    3. 3.3 Market Size by Revenue (USD billion) |
    4. 3.4 Year-over-Year Growth Analysis
  4. 4 Market Drivers Analysis |
    1. 4.1 Brewer-Backed Distribution Scale |
    2. 4.2 Fiscal Pressure as a Reformulation Forcing Function |
    3. 4.3 The No-and-Low Occasion |
    4. 4.4 Driver Impact Weighting Matrix
  5. 5 Market Restraints Analysis |
    1. 5.1 Private Label at the Chilled Shelf |
    2. 5.2 Botanical Input Concentration |
    3. 5.3 Ready-to-Drink Substitution |
    4. 5.4 Restraint Impact Weighting Matrix
  6. 6 Market Opportunity Analysis |
    1. 6.1 Non-Alcoholic Spirit Pairing |
    2. 6.2 Asia-Pacific Modern Trade |
    3. 6.3 Levy-Compliant Reformulation as Pricing Shield |
    4. 6.4 Scan-Data Licensing and Direct Subscription |
    5. 6.5 Circular Packaging Economics
  7. 7 Regional Analysis |
    1. 7.1 North America | |
      1. 7.1.1 US | |
      2. 7.1.2 Canada | |
      3. 7.1.3 Mexico |
    2. 7.2 Europe | |
      1. 7.2.1 Germany | |
      2. 7.2.2 UK | |
      3. 7.2.3 France | |
      4. 7.2.4 Italy | |
      5. 7.2.5 Spain | |
      6. 7.2.6 Nordic Countries | |
      7. 7.2.7 Russia | |
      8. 7.2.8 Rest of Europe |
    3. 7.3 Asia-Pacific | |
      1. 7.3.1 China | |
      2. 7.3.2 India | |
      3. 7.3.3 Japan | |
      4. 7.3.4 South Korea | |
      5. 7.3.5 ASEAN | |
      6. 7.3.6 Rest of Asia-Pacific |
    4. 7.4 South America | |
      1. 7.4.1 Brazil | |
      2. 7.4.2 Argentina | |
      3. 7.4.3 Rest of South America |
    5. 7.5 Middle East & Africa | |
      1. 7.5.1 Saudi Arabia | |
      2. 7.5.2 UAE | |
      3. 7.5.3 South Africa | |
      4. 7.5.4 Egypt | |
      5. 7.5.5 Rest of Middle East & Africa
  8. 8 Future Outlook (2026–2035) |
    1. 8.1 Sweetener Science |
    2. 8.2 Packaging Circularity |
    3. 8.3 Channel Economics |
    4. 8.4 Botanical Traceability
  9. 9 Segmentation Analysis |
    1. 9.1 By Type | |
      1. 9.1.1 Regular | |
      2. 9.1.2 Low-Calorie | |
      3. 9.1.3 Slimline / Light |
    2. 9.2 By Packaging Type | |
      1. 9.2.1 PET / Glass Bottles | |
      2. 9.2.2 Metal Can |
    3. 9.3 By Distribution Channel | |
      1. 9.3.1 HoReCa | |
      2. 9.3.2 Retail
  10. 10 Competitive Landscape |
    1. 10.1 Market Concentration Analysis (2026) |
    2. 10.2 Competitive Benchmarking Matrix |
    3. 10.3 Company Profiles | |
      1. 10.3.1 Fevertree Drinks plc | |
      2. 10.3.2 Keurig Dr Pepper Inc. | |
      3. 10.3.3 The Coca-Cola Company | |
      4. 10.3.4 Suntory Beverage & Food | |
      5. 10.3.5 Molson Coors Beverage Company | |
      6. 10.3.6 Fentimans Ltd | |
      7. 10.3.7 Q Mixers | |
      8. 10.3.8 Britvic (Carlsberg Group) | |
      9. 10.3.9 Global Brands Ltd (Franklin & Sons) | |
      10. 10.3.10 Thomas Henry GmbH | |
      11. 10.3.11 Double Dutch Drinks
  11. 11 Recent Developments & News
  12. 12 Report Scope & Methodology |
    1. 12.1 Study Period & Base Year |
    2. 12.2 Data Sources & Citations |
    3. 12.3 Abbreviations
  13. 13 Detailed Sources and Citations
  14. 14 Frequently Asked Questions
  15. 15 LIST OF TABLES |
  16. TABLE 1 Global Tonic Water Market Size & Forecast, by Revenue (USD billion), 2021–2035 |
  17. TABLE 2 Global Tonic Water Market — Year-over-Year Growth Analysis, 2021–2035 |
  18. TABLE 3 Global Tonic Water Market — Driver Impact Weighting Matrix, 2026–2035 |
  19. TABLE 4 Global Tonic Water Market — Restraint Impact Weighting Matrix, 2026–2035 |
  20. TABLE 5 Global Tonic Water Market Size, by Region, 2021–2035 (USD billion) |
  21. TABLE 6 North America Tonic Water Market Size, by Country, 2021–2035 (USD billion) |
  22. TABLE 7 Europe Tonic Water Market Size, by Country, 2021–2035 (USD billion) |
  23. TABLE 8 Asia-Pacific Tonic Water Market Size, by Country, 2021–2035 (USD billion) |
  24. TABLE 9 South America Tonic Water Market Size, by Country, 2021–2035 (USD billion) |
  25. TABLE 10 Middle East & Africa Tonic Water Market Size, by Country, 2021–2035 (USD billion) |
  26. TABLE 11 Global Tonic Water Market Size, by Type, 2021–2035 (USD billion) |
  27. TABLE 12 Global Tonic Water Market Size, by Packaging Type, 2021–2035 (USD billion) |
  28. TABLE 13 Global Tonic Water Market Size, by Distribution Channel, 2021–2035 (USD billion) |
  29. TABLE 14 North America Tonic Water Market Size, by Type, 2021–2035 (USD billion) |
  30. TABLE 15 North America Tonic Water Market Size, by Packaging Type, 2021–2035 (USD billion) |
  31. TABLE 16 North America Tonic Water Market Size, by Distribution Channel, 2021–2035 (USD billion) |
  32. TABLE 17 Europe Tonic Water Market Size, by Type, 2021–2035 (USD billion) |
  33. TABLE 18 Europe Tonic Water Market Size, by Packaging Type, 2021–2035 (USD billion) |
  34. TABLE 19 Europe Tonic Water Market Size, by Distribution Channel, 2021–2035 (USD billion) |
  35. TABLE 20 Asia-Pacific Tonic Water Market Size, by Type, 2021–2035 (USD billion) |
  36. TABLE 21 Asia-Pacific Tonic Water Market Size, by Packaging Type, 2021–2035 (USD billion) |
  37. TABLE 22 Asia-Pacific Tonic Water Market Size, by Distribution Channel, 2021–2035 (USD billion) |
  38. TABLE 23 South America Tonic Water Market Size, by Type, 2021–2035 (USD billion) |
  39. TABLE 24 South America Tonic Water Market Size, by Packaging Type, 2021–2035 (USD billion) |
  40. TABLE 25 South America Tonic Water Market Size, by Distribution Channel, 2021–2035 (USD billion) |
  41. TABLE 26 Middle East & Africa Tonic Water Market Size, by Type, 2021–2035 (USD billion) |
  42. TABLE 27 Middle East & Africa Tonic Water Market Size, by Packaging Type, 2021–2035 (USD billion) |
  43. TABLE 28 Middle East & Africa Tonic Water Market Size, by Distribution Channel, 2021–2035 (USD billion) |
  44. TABLE 29 United States Tonic Water Market Size, by Type, 2021–2035 (USD billion) |
  45. TABLE 30 United Kingdom Tonic Water Market Size, by Type, 2021–2035 (USD billion) |
  46. TABLE 31 Germany Tonic Water Market Size, by Type, 2021–2035 (USD billion) |
  47. TABLE 32 China Tonic Water Market Size, by Type, 2021–2035 (USD billion) |
  48. TABLE 33 India Tonic Water Market Size, by Type, 2021–2035 (USD billion) |
  49. TABLE 34 Brazil Tonic Water Market Size, by Type, 2021–2035 (USD billion) |
  50. TABLE 35 Competitive Benchmarking Matrix — Global Tonic Water Market, 2026 |
  51. TABLE 36 Company Profiles — Key Players, Global Tonic Water Market |
  52. TABLE 37 Recent Developments & Strategic Announcements, 2024–2026 |
  53. TABLE 38 Report Scope & Methodology Summary |
  54. TABLE 39 Detailed Sources and Citations
  55. 16 LIST OF FIGURES |
  56. FIGURE 1 Global Tonic Water Market — Market Dynamics Overview (Drivers, Restraints, Opportunities) |
  57. FIGURE 2 Global Tonic Water Market — Industry Value Chain Analysis |
  58. FIGURE 3 Global Tonic Water Market — Porter's Five Forces Analysis |
  59. FIGURE 4 Global Tonic Water Market Size Trend, 2021–2035 (USD billion) |
  60. FIGURE 5 Global Tonic Water Market — Year-over-Year Growth Trajectory, 2022–2035 |
  61. FIGURE 6 Global Tonic Water Market Share, by Type, 2025 vs 2035 (%) |
  62. FIGURE 7 Global Tonic Water Market Share, by Packaging Type, 2025 vs 2035 (%) |
  63. FIGURE 8 Global Tonic Water Market Share, by Distribution Channel, 2025 vs 2035 (%) |
  64. FIGURE 9 Global Tonic Water Market Share, by Region, 2025 (%) |
  65. FIGURE 10 Regional Growth Comparison — CAGR by Region, 2026–2035 (%) |
  66. FIGURE 11 Europe Tonic Water Market — Country-Level Share Distribution, 2025 (%) |
  67. FIGURE 12 Asia-Pacific Tonic Water Market — Country-Level Growth Comparison, 2026–2035 |
  68. FIGURE 13 Competitive Landscape — Estimated Revenue Share Distribution, 2026 |
  69. FIGURE 14 Competitive Positioning Matrix — Premium vs Mainstream Tier |
  70. FIGURE 15 Sugar Levy Threshold Impact on Product Portfolio Mix, 2026–2030

Segmentation Quick Reference

DimensionSub-SegmentsDominant SegmentFastest Growing Segment
By TypeRegular; Low-Calorie; Slimline/LightRegularSlimline/Light
By Packaging TypePET/Glass Bottles; Metal CanMetal CanMetal Can
By Distribution ChannelHoReCa; RetailRetailHoReCa
By GeographyNorth America; Europe; Asia-Pacific; South America; Middle East & AfricaEuropeAsia-Pacific


Market Segmentation Overview

By Type

Sub-SegmentKey Trend
RegularHolds bar-programme standardisation but faces levy exposure above 4.5g per 100ml from 2028
Low-CalorieReformulation target tier; stevia and allulose blends replacing partial sugar loads
Slimline / LightFastest expansion as at-home label-reading consumers shift retail mix


Type migration is fiscally driven as much as consumer-driven. Producers reformulating ahead of the 2028 UK threshold convert a compliance obligation into a shelf-price advantage over competitors that absorb the levy, which accelerates the shift out of regular formulations across levied jurisdictions.

By Packaging Type

Sub-SegmentKey Trend
PET / Glass BottlesRetained in on-trade presentation and returnable systems; pressured by freight and breakage cost
Metal CanLeading format on portability, recycled content, and single-serve freshness economics


Packaging economics increasingly favour aluminium. Recycled-content obligations under EU packaging rules and lower freight weight per litre both compound the advantage. At the same time, single-serve cans solve the residual-carbonation problem that suppressed repeat purchase in larger bottle formats.

By Distribution Channel

Sub-SegmentKey Trend
HoReCaFastest-growing channel; menu premiumisation and alcohol-free serves expand pour volume
RetailLargest value base; multipack and slim-can formats drive basket size


Channel strategy runs in sequence rather than parallel. Bar menus establish brand specification and price anchoring, and grocery conversion follows within weeks — which is why premium producers over-index marketing spend to on-trade despite retail carrying the larger revenue base.




Download PDF ×

We do not share your information with anyone. However, we may send you emails based on your report interest from time to time. You may contact us at any time to opt-out.