• Cat-intel
  • MedIntelliX
  • Resources
  • About Us
  • Hero Background
    English
    Chinese
    French
    Japanese
    Korean
    German
    Spanish

    Thrombus Treatment Market Size

    ID: MRFR/HC/9934-CR
    128 Pages
    Rahul Gotadki
    March 2023

    Thrombus Treatment Market Research Report Information by Type (Atrial Thrombus [Right Atrial Thrombus and Left Atrial Thrombus] and Venous Thrombus), by Treatment (Medical Therapy [Antiplatelets, Anticoagulants, and Thrombolytics], Surgery, and Others), and By Region (North America, Europe, Asia-Pacific, And Rest of the World) - Forecast till 2035

    Share:
    Download PDF ×

    We do not share your information with anyone. However, we may send you emails based on your report interest from time to time. You may contact us at any time to opt-out.

    Thrombus Treatment Market Infographic
    $ 4,950.0
    $ 5,950.0
    $ 7,250.0

    Thrombus Treatment Size

    Thrombus Treatment Market Growth Projections and Opportunities

    The thrombus treatment market is witnessing significant growth, driven by various factors that impact public health and well-being. This executive summary provides an overview of the key elements contributing to the expansion of the thrombus treatment market and highlights both the positive aspects and potential challenges in this evolving healthcare landscape.

    Market Growth Drivers: The thrombus treatment market is experiencing a notable upswing primarily due to the increasing incidence of trauma cases. Trauma, often resulting from accidents or injuries, has become more prevalent, necessitating effective treatment measures for conditions like thrombus. Additionally, the rise in the adoption of sedentary lifestyles is a key driver. Many people today lead less physically active lives, contributing to health issues, including complications related to blood clotting.

    Growing Awareness: A noteworthy factor contributing to the growth of the thrombus treatment market is the heightened awareness regarding thrombus-related complications. As individuals become more informed about the potential risks associated with blood clot formation, there is a growing tendency to seek medical attention and treatment. This increased awareness not only empowers individuals to take charge of their health but also creates a demand for effective thrombus treatments.

    New Product Launches and Approvals: The introduction of new and approved products is playing a pivotal role in shaping the thrombus treatment market. Advances in medical research and technology have led to the development of innovative treatment options. These new products provide healthcare professionals with a broader range of tools and strategies to address thrombus-related issues, contributing to the overall growth and evolution of the market.

    Risks Associated with Thrombosis Drugs: Despite the positive trajectory, it's crucial to acknowledge potential challenges. One such challenge is the inherent risks associated with drugs used for thrombus treatment. While these medications are effective in managing blood clots, there are potential side effects and complications that individuals and healthcare providers need to consider. The awareness of these risks may impact the decision-making process, posing a potential obstacle to the growth of the thrombus treatment market.

    Implications of Market Growth: The growth of the thrombus treatment market carries significant implications for public health. With more effective treatment options and increased awareness, there is an opportunity to enhance the quality of care for individuals dealing with thrombus-related conditions. The market growth also reflects the dynamism of the healthcare industry, with continuous efforts to address evolving health challenges.

    Future Outlook: Looking ahead, the thrombus treatment market is expected to continue its upward trajectory. The combination of increased trauma cases, sedentary lifestyles, and growing awareness is likely to sustain market growth. Additionally, ongoing research and development efforts may result in further innovations, expanding the array of treatment options available. However, it will be essential to navigate the challenges associated with the potential risks of thrombosis drugs, ensuring a balanced and informed approach to treatment decisions.

    The thrombus treatment market is in a phase of dynamic growth, driven by multiple factors that intersect with contemporary health trends. The market's response to trauma cases, the impact of sedentary lifestyles, and the growing awareness of thrombus-related complications highlight the evolving landscape of healthcare. The introduction of new and approved products adds a layer of optimism, offering enhanced solutions for healthcare professionals and individuals alike. As the market progresses, addressing the risks associated with thrombosis drugs will be crucial to ensuring sustained growth and positive health outcomes. The thrombus treatment market, with its multifaceted dynamics, is poised for a future marked by advancements in care and an ongoing commitment to addressing the complexities of thrombus-related conditions.
    Thrombus Treatment Market Size Graph

    Market Summary

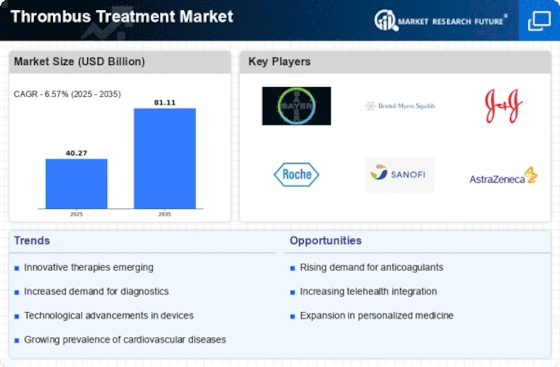
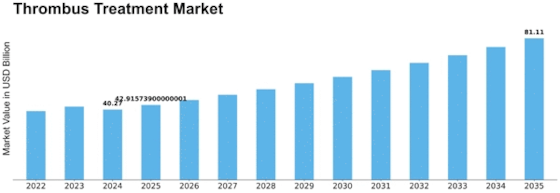
    The Global Thrombus Treatment Market is projected to grow from 40.27 USD Billion in 2024 to 81.11 USD Billion by 2035, reflecting a robust growth trajectory.

    Key Market Trends & Highlights

    Thrombus Treatment Key Trends and Highlights

    • The market is expected to experience a compound annual growth rate (CAGR) of 7.07% from 2025 to 2035.
    • By 2035, the market valuation is anticipated to reach 85.4 USD Billion, indicating substantial growth potential.
    • in 2024, the market is valued at 40.27 USD Billion, laying a strong foundation for future expansion.
    • Growing adoption of advanced thrombus treatment technologies due to increasing prevalence of cardiovascular diseases is a major market driver.

    Market Size & Forecast

    2024 Market Size 40.27 (USD Billion)
    2035 Market Size 81.11 (USD Billion)
    CAGR (2025-2035) 6.57%
    Largest Regional Market Share in 2024 latin_america)

    Major Players

    Teva Pharmaceutical Industries Ltd. (Israel), AngioDynamics Inc. (US), Bristol-Myers Squibb Company (US), Pfizer Inc. (US), Johnson & Johnson Services Inc. (US), Sanofi S.A. (France), Daiichi Sankyo Company, Limited (Tokyo), Boehringer Ingelheim International GmbH (Germany), Aspen Pharmacare Holdings Limited (US), Bayer AG (Germany)

    Market Trends

    Increasing incidence of trauma cases fuels market growth

    Trauma is considered as one of the most common causes for the formation of thrombus in the lower extremities. When any blood vessels get damages, the surround blood thickens and forms a clot. Hence, blood vessel damage due to trauma can cause the formation of a thrombus. The increases number trauma cases, especially road accidents have led to the increase in demand for thrombus treatment. According to the WHO in June 2022, around 1.3 million people lose their lives due to road accidents globally. Additionally, 20-30 trillion people suffer non-fatal injuries per year.

    Over 90% of such fatalities occur in low- and middle-income countries which is expected to drive the market of thrombus treatment significantly in those countries with a significant growth rate.

    Additionally, there were 178 million new fracture cases registered in 2019 globally which had increased by 33.4% since 1990. The total prevalence of acute and long-term fracture symptoms had reached 455 million in 2910 with an increase of 67.5% since 1990. Fracture is another common cause for thrombosis. Hence, the increasing incidence of trauma cases is driving market demand for the Thrombus Treatment.

    The Global Thrombus Treatment Market is poised for growth as advancements in medical technology and increasing awareness of thromboembolic disorders drive innovation in therapeutic options.

    U.S. National Institutes of Health

    Thrombus Treatment Market Market Drivers

    Market Growth Projections

    The Global Thrombus Treatment Market Industry is poised for substantial growth, with projections indicating a market value of 40.3 USD Billion in 2024 and an anticipated increase to 85.4 USD Billion by 2035. This growth trajectory reflects a compound annual growth rate of 7.07% from 2025 to 2035. The increasing incidence of thromboembolic disorders, advancements in medical technology, and heightened awareness are key factors driving this expansion. Furthermore, the evolving regulatory landscape is likely to facilitate the introduction of innovative therapies, enhancing treatment options for patients. As the market evolves, stakeholders are expected to capitalize on these trends to foster innovation and improve patient outcomes.

    Growing Geriatric Population

    The aging population is a critical driver of the Global Thrombus Treatment Market Industry. As individuals age, the risk of thromboembolic events increases, necessitating effective treatment options. The demographic shift towards an older population is particularly pronounced in developed nations, where healthcare systems are adapting to meet the needs of this demographic. This trend is expected to contribute significantly to the market's growth, with the geriatric population projected to reach unprecedented levels by 2035. Consequently, healthcare providers are increasingly focusing on developing tailored therapies that address the unique needs of older patients, thereby enhancing the overall treatment landscape.

    Regulatory Support and Approvals

    The Global Thrombus Treatment Market Industry benefits from favorable regulatory environments that facilitate the approval of new therapies and devices. Regulatory agencies, such as the FDA and EMA, are increasingly expediting the review processes for innovative thrombus treatments, recognizing the urgent need for effective solutions. This support encourages pharmaceutical and biotechnology companies to invest in research and development, leading to a diverse range of treatment options becoming available. The rapid approval of new anticoagulants and thrombolytics is indicative of this trend, which is likely to enhance competition and drive market expansion. As a result, the market is positioned for robust growth in the coming years.

    Advancements in Medical Technology

    Technological innovations are significantly shaping the Global Thrombus Treatment Market Industry. The development of novel anticoagulants, minimally invasive surgical techniques, and advanced imaging technologies enhances the efficacy of thrombus management. For instance, the introduction of catheter-directed thrombolysis has revolutionized treatment protocols, allowing for quicker and more effective interventions. These advancements not only improve patient outcomes but also reduce healthcare costs associated with prolonged hospital stays. As the market evolves, the integration of artificial intelligence in diagnostic processes is likely to further streamline treatment pathways, contributing to the anticipated growth of the market, projected to reach 85.4 USD Billion by 2035.

    Increased Awareness and Screening Programs

    There is a growing emphasis on awareness and screening programs aimed at thromboembolic disorders, which is positively impacting the Global Thrombus Treatment Market Industry. Public health initiatives and educational campaigns are informing individuals about the risks associated with thrombosis, leading to earlier diagnosis and treatment. For example, organizations are promoting awareness of risk factors such as obesity and sedentary lifestyles, which are known contributors to thrombus formation. This proactive approach is expected to enhance patient engagement and compliance with treatment regimens, thereby driving market growth. The anticipated compound annual growth rate of 7.07% from 2025 to 2035 reflects the potential of these initiatives to influence market dynamics.

    Rising Incidence of Thromboembolic Disorders

    The Global Thrombus Treatment Market Industry is witnessing a surge in demand due to the increasing prevalence of thromboembolic disorders, such as deep vein thrombosis and pulmonary embolism. According to health statistics, these conditions affect millions globally, leading to a heightened need for effective treatment options. As the population ages, the incidence of these disorders is expected to rise, further driving market growth. This trend is particularly evident in developed countries, where lifestyle factors contribute to higher rates of thrombosis. The projected market value of 40.3 USD Billion in 2024 underscores the urgency for innovative therapies and interventions in this sector.

    Market Segment Insights

    Thrombus Treatment Type Insights

    The market segments of thrombus treatment, based on type, includes atrial thrombus and venous thrombus. The atrial thrombus bifurcated into right atrial thrombus and left atrial thrombus.  Venous thrombus held the largest market share and contributed USD 22.58 billion in 2021 owing to the interaction between obesity and other risk factors doubles the risk of venous thrombus. The World Obesity Atlas 2022 stated that 1 billion people globally i.e., 1 in 5 women and 1 in 7 men will have diabetes by 2030.

    Therefore, the increase in obesity in the coming years will lead to venous thrombosis, fueling the venous thrombosis segment market.

    Thrombus Treatment Treatment Insights

    The Thrombus Treatment Market data has been segmented, based on treatment, by medical therapy, surgery, and others. The medical therapy segment has been segmented into antiplatelets, anticoagulants, and thrombolytics. Medical therapy held the largest market share and contributed USD 34.36 billion in 2021 and the surgery anticipated to register the highest CAGR of 7.78% from 2024 to 2032. The most common antiplatelets used to treat thrombus include acetylsalicylic acid (ASA), clopidogrel, prasugrel, and ticagrelor. Acetylsalicylic acid includes aspirin, which is effective in treating thrombosis.

    December 2021, Johnson & Johnson's (US) subsidiary Janssen Pharmaceutical Companies (Belgium) announced that the US Food and Drug Administration (FDA) had approved its two paediatric indications for XARELTO.

    Figure 2: Thrombus Treatment Market, by Treatment, 2022 & 2032 (USD Billion)

    Source: Secondary Research, Primary Research, Market Research Future Database and Analyst Review

    Get more detailed insights about Thrombus Treatment Market Research Report—Global Forecast till 2032

    Regional Insights

    By Region, the study segments the market into North America, Europe, Asia-Pacific, and Rest of the World. North America held the largest market share and contributed USD 16.19 billion in 2021 owing to developed healthcare infrastructure, research grants for producing safe and effective thrombus treatment, the growing aged and obese population in the region. For instance, according to the World Health Organization (WHO) 2021, the North America population over 80 years will triple from 143 million in 2019 to 426 million in 2050. Therefore, the growing aged and obese population supports the market growth of thrombus treatment.

    Further, the major countries studied are: The US, Canada, Germany, France, UK, Italy, Spain, China, Japan, India, Australia, South Korea, and Brazil.

    Figure 3: THROMBUS TREATMENT MARKET BY REGION 2022 & 2032THROMBUS TREATMENT MARKET BY REGION 2021 & 2030

    Source: Secondary Research, Primary Research, Market Research Future Database and Analyst Review

    Europe thrombus treatment market accounts for the second-largest market share owing to growing research and treatment of deep-vein thrombosis and growing awareness regarding thrombus complications are the major factors driving the market growth in Europe. For instance, according to the article published in National Center for Biotechnology Information (NCBI), deep vein thrombosis (DVT) is a healthcare burden in Europe. Furthermore, the Germany market of thrombus treatment held the largest market share, and the UK market of thrombus treatment is the fastest growing market in the Europe region.

    The Asia-Pacific thrombus treatment market is expected to grow at a significant share from 2024 to 2032. Owing to the presence of a diversified patient pool, the rising prevalence of deep vein thrombosis, and increasing awareness about the treatment and usage of drugs to treat different thrombosis events in countries such as China and India are likely to boost the market in the Asia-Pacific region. Moreover, China market of thrombus treatment held the largest market share, and the India market of thrombus treatment is the fastest growing market in the Asia-Pacific region.

    Key Players and Competitive Insights

    Major market players are spending a lot of money on R&D to increase their product lines, which will help the thrombus treatment market grow even more. Market participants are also taking a range of strategic initiatives to grow their worldwide footprint, including new product launches, contractual agreements, mergers and acquisitions, increased investments, and collaboration with other organizations. Competitors in the thrombus treatment industry must offer cost-effective items to expand and survive in an increasingly competitive and rising market environment.

    Teva Pharmaceutical Industries Ltd. (Israel) is one of the leaders in the pharmaceutical industry engaged in developing and providing services for generic medicines. The company utilizes its arrangement of more than 1,800 molecules to create a wide variety of generic products in almost every therapeutic area. It specializes in generic medicines, the central nervous system (CNS), brand and specialty medicines, oncology, active pharmaceutical ingredients, respiratory, women's health, and biologics. In June 2022, the company launched a generic version of apixaban oral anticoagulant that directly inhibits factor X, in UK.

    Key Companies in the Thrombus Treatment Market market include

    Industry Developments

    December 2021, Johnson & Johnson's (US) subsidiary Janssen Pharmaceutical Companies (Belgium) announced that the US Food and Drug Administration (FDA) had approved its two paediatric indications for XARELTO.

    In April 2021, The US Food and Drug Administration has granted AngioDynamics, Inc. (US) 510(k) clearance for its AlphaVac mechanical thrombectomy system. This allows for precise control of clot removal while minimizing patient blood loss. It has expanded the company's thrombus management portfolio, allowing it to serve the thrombectomy market.

    April 2018, Bristol-Myers Squibb Company (US) collaborated with Janssen Pharmaceuticals, Inc. (Belgium) on a Factor XIa (FXIa) inhibitor program that includes the development and commercialization of BMS-986177, an investigational anticoagulant compound being studied for the prevention and treatment of major thrombotic conditions.

    Future Outlook

    Thrombus Treatment Market Future Outlook

    The Global Thrombus Treatment Market is projected to grow at a 6.57% CAGR from 2025 to 2035, driven by advancements in medical technology, increasing prevalence of thrombotic disorders, and rising healthcare expenditure.

    New opportunities lie in:

    • Develop innovative thrombolytic agents targeting specific patient demographics.
    • Leverage telemedicine for remote monitoring and management of thrombus patients.
    • Invest in AI-driven diagnostic tools to enhance early detection of thrombotic conditions.

    By 2035, the market is expected to demonstrate robust growth, positioning itself as a leader in advanced thrombus treatment solutions.

    Market Segmentation

    Thrombus Treatment Type Outlook

    Atrial Thrombus
    • Right Atrial Thrombus
    • Left Atrial Thrombus

    Thrombus Treatment Regional Outlook

    North America
    • US
    • Canada

    Thrombus Treatment Treatment Outlook

    Medical Therapy
    • Antiplatelets
    • Anticoagulants
    • Thrombolytics

    Report Scope

    Report Attribute/Metric Details
    Market Size 2024 USD 40.27 billion
    Market Size 2035 81.11
    Compound Annual Growth Rate (CAGR) 6.57% (2025 - 2035)
    Base Year 2024
    Forecast Period 2025 - 2035
    Historical Data 2018 & 2022
    Forecast Units Value (USD Billion)
    Report Coverage Revenue Forecast, Competitive Landscape, Growth Factors, and Trends
    Segments Covered Type, Treatment, and Region
    Geographies Covered North America, Europe, Asia Pacific, and Rest of the World
    Countries Covered The US, Canada, Germany, France, UK, Italy, Spain, China, Japan, India, Australia, South Korea, and Brazil
    Key Companies Profiled Teva Pharmaceutical Industries Ltd. (Israel), AngioDynamics Inc. (US), Bristol-Myers Squibb Company (US), Pfizer Inc. (US), Johnson & Johnson Services Inc. (US), Sanofi S.A. (France), Daiichi Sankyo Company, Limited (Tokyo), Boehringer Ingelheim International GmbH (Germany), Aspen Pharmacare Holdings Limited (US), Bayer AG (Germany) and others
    Key Market Opportunities ·       New product approvals and launches
    Key Market Drivers ·       Increasing incidence of trauma cases ·       Rising adoption of sedentary lifestyle
    Market Size 2025 42.92

    Market Highlights

    Author

    Rahul Gotadki
    Assistant Manager

    She holds an experience of about 6+ years in market research and business consulting, working under the spectrum of information communication technology, telecommunications and semiconductor domains. aarti conceptualizes and implements a scalable business strategy and provides strategic leadership to the clients. her expertise lies in market estimation, competitive intelligence, pipeline analysis, customer assessment, etc.

    Leave a Comment

    Latest Comments

    John Doe
    john@example.com

    This is a great article! Really helped me understand the topic better.

    Posted on July 23, 2025, 10:15 AM
    Jane Smith
    jane@domain.com

    Thanks for sharing this. I’ve bookmarked it for later reference.

    Posted on July 22, 2025, 7:45 PM

    FAQs

    What is the projected growth of the Thrombus Treatment market?

    The Thrombus Treatment market is the expected increase in total market value of 81.11 USD billion over a defined forecast period 2025–2035. It is driven by factors such as demand trends, technological advances, regulatory changes, and geographic expansion.

    What is the size of the Thrombus Treatment market?

    Thrombus Treatment market size was valued at approximately 40.27 billion USD in 2024. This figure will reach 81.11 billion USD covering all regions (America, Europe, Asia, MEA and ROW), focusing its segments / services / distribution channels till 2035.

    What is the CAGR of the Thrombus Treatment market?

    Thrombus Treatment market is expected to grow at a CAGR of 6.57% between 2025 and 2035.

    How much will the Thrombus Treatment market be worth by 2035?

    Thrombus Treatment market is expected to be worth of 81.11 billion USD, reflecting growth driven by usage, technology and global demands by the end of 2035.

    How will the Thrombus Treatment market perform over the next 10 years?

    Over the next 10 years the Thrombus Treatment market is expected to shift from usd billion 40.27 to 81.11 billion USD, led by adoption of advanced tech, demographic trends, regulatory approvals, with potential headwinds from 2025 to 2035.

    How big is the US thrombus treatment market?

    The US is expected to hold a 73.52% share of the global market for thrombus treatment market during the forecast period of 2024-2035.

    Which region held the largest market share in the thrombus treatment market?

    The North America region market held the largest market share in thrombus treatment market.

    1. Table of Contents
    2. Executive Summary
      1. OVERVIEW
    3. Market Introduction
      1. DEFINITION
      2. Scope of the Study
      3. RESEARCH OBJECTIVE
      4. MARKET STRUCTURE
      5. ASSUMPTIONS & LIMITATIONS
    4. Research Methodology
      1. DATA MINING
      2. SECONDARY RESEARCH
      3. PRIMARY RESEARCH
      4. BREAKDOWN OF PRIMARY RESPONDENTS
      5. FORECASTING TECHNIQUES
      6. Research Methodology FOR MARKET SIZE ESTIMATION
        1. Bottom-up Approach
        2. TOP-DOWN APPROACH
      7. DATA TRIANGULATION
      8. VALIDATION
    5. MARKET DYNAMICS
      1. OVERVIEW
      2. DRIVERS
        1. INCREASING INCIDENCE OF TRAUMA CASES
        2. RISING ADOPTION OF SEDENTARY LIFESTYLE
      3. RESTRAINTS
        1. RISKS ASSOCIATED WITH THROMBOSIS DRUGS
      4. OPPORTUNITIES
        1. NEW PRODUCT APPROVALS AND LAUNCHES
    6. MARKET FACTOR ANALYSIS
      1. VALUE CHAIN ANALYSIS
        1. R&D
        2. MANUFACTURING
        3. DISTRIBUTION AND SALES
        4. POST-SALES MONITORING
      2. PORTER'S FIVE FORCES MODEL
        1. THREAT OF NEW ENTRANTS
        2. BARGAINING POWER OF SUPPLIERS
        3. THREAT OF SUBSTITUTES
        4. BARGAINING POWER OF BUYERS
        5. INTENSITY OF RIVALRY
      3. IMPACT OF COVID-19 ON THE GLOBAL THROMBUS TREATMENT MARKET
        1. IMPACT ON SUPPLY CHAIN
        2. IMPACT ON PRODUCTION
        3. DEMAND-SUPPLY GAP ANALYSIS
        4. IMPACT ON PRICING
      4. NUMBER OF PROCEDURES FOR PULMONARY EMBOLISM
    7. GLOBAL THROMBUS TREATMENT MARKET, BY TYPE
      1. OVERVIEW
      2. ATRIAL THROMBUS
      3. VENOUS THROMBUS
    8. GLOBAL THROMBUS TREATMENT MARKET, BY TREATMENT
      1. OVERVIEW
      2. MEDICAL THERAPY
      3. SURGERY
      4. OTHERS
    9. GLOBAL THROMBUS TREATMENT MARKET, BY REGION
      1. OVERVIEW
        1. NORTH AMERICA
        2. EUROPE
        3. ASIA-PACIFIC
        4. REST OF THE WORLD
    10. Competitive Landscape
      1. OVERVIEW
      2. COMPETITIVE BENCHMARKING
      3. MAJOR GROWTH STRATEGY IN THE GLOBAL THROMBUS TREATMENT MARKET
      4. THE LEADING PLAYERS IN TERMS OF NUMBER OF DEVELOPMENTS IN GLOBAL THROMBUS TREATMENT MARKET
      5. KEY DEVELOPMENT ANALYSIS
      6. KEY DEVELOPMENTS & GROWTH STRATEGIES
        1. PRODUCT APPROVALS/PRODUCT LAUNCHES
        2. PARTNERSHIP/COLLABORATION
      7. MAJOR PLAYERS FINANCIAL MATRIX
        1. SALES (USD MILLION), 2021
        2. R&D (USD MILLION), 2021
    11. COMPANY PROFILES
      1. TEVA PHARMACEUTICAL INDUSTRIES LTD.
        1. COMPANY OVERVIEW
        2. FINANCIAL ANALYSIS
        3. PRODUCTS OFFERED
        4. KEY DEVELOPMENTS
        5. SWOT ANALYSIS
        6. KEY STRATEGIES
      2. SANOFI
        1. COMPANY OVERVIEW
        2. FINANCIAL OVERVIEW
        3. PRODUCTS OFFERED
        4. KEY DEVELOPMENTS
        5. SWOT ANALYSIS
        6. KEY STRATEGIES
      3. PFIZER INC.
        1. COMPANY OVERVIEW
        2. FINANCIAL OVERVIEW
        3. PRODUCTS OFFERED
        4. KEY DEVELOPMENTS
        5. SWOT ANALYSIS
        6. KEY STRATEGIES
      4. BAYER AG
        1. COMPANY OVERVIEW
        2. FINANCIAL OVERVIEW
        3. PRODUCTS OFFERED
        4. KEY DEVELOPMENTS
        5. KEY STRATEGIES
      5. ANGIODYNAMICS.
        1. COMPANY OVERVIEW
        2. FINANCIAL OVERVIEW
        3. PRODUCTS OFFERED
        4. KEY DEVELOPMENTS
        5. KEY STRATEGIES
      6. BOEHRINGER INGELHEIM INTERNATIONAL GMBH
        1. COMPANY OVERVIEW
        2. FINANCIAL OVERVIEW
        3. PRODUCTS OFFERED
        4. KEY DEVELOPMENTS
        5. SWOT ANALYSIS
        6. KEY STRATEGIES
      7. BRISTOL-MYERS SQUIBB COMPANY
        1. COMPANY OVERVIEW
        2. FINANCIAL OVERVIEW
        3. PRODUCTS OFFERED
        4. KEY DEVELOPMENTS
        5. KEY STRATEGIES
      8. ASPEN HOLDINGS
        1. COMPANY OVERVIEW
        2. FINANCIAL OVERVIEW
        3. PRODUCTS OFFERED
        4. KEY DEVELOPMENTS
        5. KEY STRATEGIES
      9. JOHNSON & JOHNSON SERVICES, INC.
        1. COMPANY OVERVIEW
        2. FINANCIAL OVERVIEW
        3. PRODUCTS OFFERED
        4. KEY DEVELOPMENTS
        5. SWOT ANALYSIS
        6. KEY STRATEGIES
      10. DAIICHI SANKYO COMPANY, LIMITED
        1. COMPANY OVERVIEW
        2. FINANCIAL OVERVIEW
        3. PRODUCTS OFFERED
        4. KEY DEVELOPMENTS
        5. KEY STRATEGIES
    12. APPENDIX
      1. REFERENCES
      2. RELATED REPORTS
    13. List of Tables and Figures
      1. LIST OF TABLES
      2. TABLE 1 LIST OF ASSUMPTIONS & LIMITATIONS
      3. TABLE 2 PRIMARY INTERVIEWS AND INFORMATION GATHERING PROCESS
      4. TABLE 3 NUMBER OF PROCEDURES FOR PULMONARY EMBOLISM, BY REGION (2021)
      5. TABLE 4 GLOBAL THROMBUS TREATMENT MARKET, BY TYPE, 2018–2030 (USD MILLION)
      6. TABLE 5 GLOBAL THROMBUS TREATMENT MARKET, FOR ATRIAL THROMBUS, BY REGION, 2018–2030 (USD MILLION)
      7. TABLE 6 GLOBAL THROMBUS TREATMENT MARKET, FOR ATRIAL THROMBUS, BY TYPE, 2018–2030 (USD MILLION)
      8. TABLE 7 GLOBAL THROMBUS TREATMENT MARKET, FOR RIGHT ATRIAL THROMBUS, BY REGION, 2018–2030 (USD MILLION)
      9. TABLE 8 GLOBAL THROMBUS TREATMENT MARKET, FOR LEFT ATRIAL THROMBUS, BY REGION, 2018–2030 (USD MILLION)
      10. TABLE 9 GLOBAL THROMBUS TREATMENT MARKET, FOR VENOUS THROMBUS, BY REGION, 2018–2030 (USD MILLION)
      11. TABLE 10 GLOBAL THROMBUS TREATMENT MARKET, BY TREATMENT, 2018–2030 (USD MILLION)
      12. TABLE 11 GLOBAL THROMBUS TREATMENT MARKET, FOR MEDICAL THERAPY, BY REGION, 2018–2030 (USD MILLION)
      13. TABLE 12 GLOBAL THROMBUS TREATMENT MARKET, FOR MEDICAL THERAPY, BY TYPE, 2018–2030 (USD MILLION)
      14. TABLE 13 GLOBAL THROMBUS TREATMENT MARKET, FOR ANTIPLATELETS BY TYPE, 2018–2030 (USD MILLION)
      15. TABLE 14 GLOBAL THROMBUS TREATMENT MARKET, FOR ANTICOAGULANTS BY TYPE, 2018–2030 (USD MILLION)
      16. TABLE 15 GLOBAL THROMBUS TREATMENT MARKET, FOR THROMBOLYTICS BY TYPE, 2018–2030 (USD MILLION)
      17. TABLE 16 GLOBAL THROMBUS TREATMENT MARKET, FOR SURGERY, BY REGION, 2018–2030 (USD MILLION)
      18. TABLE 17 GLOBAL THROMBUS TREATMENT MARKET, FOR OTHERS, BY REGION, 2018–2030 (USD MILLION)
      19. TABLE 18 GLOBAL: THROMBUS TREATMENT MARKET, BY REGION, 2018–2030 (USD MILLION)
      20. TABLE 19 NORTH AMERICA: THROMBUS TREATMENT MARKET, BY COUNTRY, 2018–2030 (USD MILLION)
      21. TABLE 20 NORTH AMERICA: THROMBUS TREATMENT MARKET, BY TYPE, 2018–2030 (USD MILLION)
      22. TABLE 21 NORTH AMERICA: THROMBUS TREATMENT MARKET, FOR ATRIAL THROMBUS, BY TYPE, 2018-2030
      23. TABLE 22 NORTH AMERICA: THROMBUS TREATMENT MARKET, BY TREATMENT, 2018–2030 (USD MILLION)
      24. TABLE 23 NORTH AMERICA: THROMBUS TREATMENT MARKET, FOR MEDICAL THERAPY, BY TREATMENT, 2018–2030 (USD MILLION)
      25. TABLE 24 US: THROMBUS TREATMENT MARKET, BY TYPE, 2018–2030 (USD MILLION)
      26. TABLE 25 US: THROMBUS TREATMENT MARKET, FOR ATRIAL THROMBUS, BY TYPE, 2018–2030 (USD MILLION)
      27. TABLE 26 US: THROMBUS TREATMENT MARKET, BY TREATMENT, 2018-2030
      28. TABLE 27 US: THROMBUS TREATMENT MARKET, FOR MEDICAL THERAPY, BY TREATMENT, 2018–2030 (USD MILLION)
      29. TABLE 28 CANADA: THROMBUS TREATMENT MARKET, BY TYPE, 2018–2030 (USD MILLION)
      30. TABLE 29 CANADA: THROMBUS TREATMENT MARKET, FOR ATRIAL THROMBUS, BY TYPE, 2018-2030
      31. TABLE 30 CANADA: THROMBUS TREATMENT MARKET, BY TREATMENT, 2018–2030 (USD MILLION)
      32. TABLE 31 CANADA: THROMBUS TREATMENT MARKET, FOR MEDICAL THERAPY, BY TREATMENT, 2018–2030 (USD MILLION)
      33. TABLE 32 EUROPE: THROMBUS TREATMENT MARKET, BY COUNTRY, 2018–2030 (USD MILLION)
      34. TABLE 33 EUROPE: THROMBUS TREATMENT MARKET, BY TYPE, 2018–2030 (USD MILLION)
      35. TABLE 34 EUROPE: THROMBUS TREATMENT MARKET, FOR ATRIAL THROMBUS, BY TYPE, 2018–2030 (USD MILLION)
      36. TABLE 35 EUROPE: THROMBUS TREATMENT MARKET, BY TREATMENT, 2018–2030 (USD MILLION)
      37. TABLE 36 EUROPE: THROMBUS TREATMENT MARKET, FOR MEDICAL THERAPY, BY TYPE, 2018–2030 (USD MILLION)
      38. TABLE 37 GERMANY: THROMBUS TREATMENT MARKET, BY TYPE, 2018–2030 (USD MILLION)
      39. TABLE 38 GERMANY: THROMBUS TREATMENT MARKET, FOR ATRIAL THROMBUS, BY TYPE, 2018–2030 (USD MILLION)
      40. TABLE 39 GERMANY: THROMBUS TREATMENT MARKET, BY TREATMENT, 2018–2030 (USD MILLION)
      41. TABLE 40 GERMANY: THROMBUS TREATMENT MARKET, FOR MEDICAL THERAPY, BY TYPE, 2018–2030 (USD MILLION)
      42. TABLE 41 UK: THROMBUS TREATMENT MARKET, BY TYPE, 2018–2030 (USD MILLION)
      43. TABLE 42 UK: THROMBUS TREATMENT MARKET, FOR ATRIAL THROMBUS, BY TYPE, 2018–2030 (USD MILLION)
      44. TABLE 43 UK: THROMBUS TREATMENT MARKET, BY TREATMENT, 2018–2030 (USD MILLION)
      45. TABLE 44 UK: THROMBUS TREATMENT MARKET, FOR MEDICAL THERAPY, BY TYPE, 2018–2030 (USD MILLION)
      46. TABLE 45 FRANCE: THROMBUS TREATMENT MARKET, BY TYPE, 2018–2030 (USD MILLION)
      47. TABLE 46 FRANCE: THROMBUS TREATMENT MARKET, FOR ATRIAL THROMBUS, BY TYPE, 2018–2030 (USD MILLION)
      48. TABLE 47 FRANCE: THROMBUS TREATMENT MARKET, BY TREATMENT, 2018–2030 (USD MILLION)
      49. TABLE 48 FRANCE: THROMBUS TREATMENT MARKET, FOR MEDICAL THERAPY, BY TYPE, 2018–2030 (USD MILLION)
      50. TABLE 49 ITALY: THROMBUS TREATMENT MARKET, BY TYPE, 2018–2030 (USD MILLION)
      51. TABLE 50 ITALY: THROMBUS TREATMENT MARKET, FOR ATRIAL THROMBUS, BY TYPE, 2018–2030 (USD MILLION)
      52. TABLE 51 ITALY: THROMBUS TREATMENT MARKET, BY TREATMENT, 2018–2030 (USD MILLION)
      53. TABLE 52 ITALY: THROMBUS TREATMENT MARKET, FOR MEDICAL THERAPY, BY TYPE, 2018–2030 (USD MILLION)
      54. TABLE 53 SPAIN: THROMBUS TREATMENT MARKET, BY TYPE, 2018–2030 (USD MILLION)
      55. TABLE 54 SPAIN: THROMBUS TREATMENT MARKET, FOR ATRIAL THROMBUS, BY TYPE, 2018–2030 (USD MILLION)
      56. TABLE 55 SPAIN: THROMBUS TREATMENT MARKET, BY TREATMENT, 2018–2030 (USD MILLION)
      57. TABLE 56 SPAIN: THROMBUS TREATMENT MARKET, FOR MEDICAL THERAPY, BY TYPE, 2018–2030 (USD MILLION)
      58. TABLE 57 REST OF EUROPE: THROMBUS TREATMENT MARKET, BY TYPE, 2018–2030 (USD MILLION)
      59. TABLE 58 REST OF EUROPE: THROMBUS TREATMENT MARKET, FOR ATRIAL THROMBUS, BY TYPE, 2018–2030 (USD MILLION)
      60. TABLE 59 REST OF EUROPE: THROMBUS TREATMENT MARKET, BY TREATMENT, 2018–2030 (USD MILLION)
      61. TABLE 60 REST OF EUROPE: THROMBUS TREATMENT MARKET, FOR MEDICAL THERAPY, BY TYPE, 2018–2030 (USD MILLION)
      62. TABLE 61 ASIA-PACIFIC: THROMBUS TREATMENT MARKET, BY COUNTRY, 2018–2030 (USD MILLION)
      63. TABLE 62 ASIA-PACIFIC: THROMBUS TREATMENT MARKET, BY TYPE, 2018–2030 (USD MILLION)
      64. TABLE 63 ASIA-PACIFIC: THROMBUS TREATMENT MARKET, FOR ATRIAL THROMBUS, BY TYPE, 2018-2030
      65. TABLE 64 ASIA-PACIFIC: THROMBUS TREATMENT MARKET, BY TREATMENT, 2018–2030 (USD MILLION)
      66. TABLE 65 ASIA-PACIFIC: THROMBUS TREATMENT MARKET FOR MEDICAL THERAPY, BY TREATMENT, 2018–2030 (USD MILLION)
      67. TABLE 66 JAPAN: THROMBUS TREATMENT MARKET, BY TYPE, 2018–2030 (USD MILLION)
      68. TABLE 67 JAPAN: THROMBUS TREATMENT MARKET, FOR ATRIAL THROMBUS, BY TYPE, 2018-2030 (USD MILLION)
      69. TABLE 68 JAPAN: THROMBUS TREATMENT MARKET, BY TREATMENT, 2018–2030 (USD MILLION)
      70. TABLE 69 JAPAN: THROMBUS TREATMENT MARKET FOR MEDICAL THERAPY, BY TREATMENT, 2018–2030 (USD MILLION)
      71. TABLE 70 CHINA: THROMBUS TREATMENT MARKET, BY TYPE, 2018–2030 (USD MILLION)
      72. TABLE 71 CHINA: THROMBUS TREATMENT MARKET, FOR ATRIAL THROMBUS, BY TYPE, 2018-2030 (USD MILLION)
      73. TABLE 72 CHINA: THROMBUS TREATMENT MARKET, BY TREATMENT, 2018–2030 (USD MILLION)
      74. TABLE 73 CHINA: THROMBUS TREATMENT MARKET FOR MEDICAL THERAPY, BY TREATMENT, 2018–2030 (USD MILLION)
      75. TABLE 74 INDIA: THROMBUS TREATMENT MARKET, BY TYPE, 2018–2030 (USD MILLION)
      76. TABLE 75 INDIA: THROMBUS TREATMENT MARKET, FOR ATRIAL THROMBUS, BY TYPE, 2018-2030 (USD MILLION)
      77. TABLE 76 INDIA: THROMBUS TREATMENT MARKET, BY TREATMENT, 2018–2030 (USD MILLION)
      78. TABLE 77 INDIA: THROMBUS TREATMENT MARKET FOR MEDICAL THERAPY, BY TREATMENT, 2018–2030 (USD MILLION)
      79. TABLE 78 AUSTRALIA: THROMBUS TREATMENT MARKET, BY TYPE, 2018–2030 (USD MILLION)
      80. TABLE 79 AUSTRALIA: THROMBUS TREATMENT MARKET, FOR ATRIAL THROMBUS, BY TYPE, 2018-2030 (USD MILLION)
      81. TABLE 80 AUSTRALIA: THROMBUS TREATMENT MARKET, BY TREATMENT, 2018–2030 (USD MILLION)
      82. TABLE 81 AUSTRALIA: THROMBUS TREATMENT MARKET FOR MEDICAL THERAPY, BY TREATMENT, 2018–2030 (USD MILLION)
      83. TABLE 82 SOUTH KOREA: THROMBUS TREATMENT MARKET, BY TYPE, 2018–2030 (USD MILLION)
      84. TABLE 83 SOUTH KOREA: THROMBUS TREATMENT MARKET, FOR ATRIAL THROMBUS, BY TYPE, 2018-2030 (USD MILLION)
      85. TABLE 84 SOUTH KOREA: THROMBUS TREATMENT MARKET, BY TREATMENT, 2018–2030 (USD MILLION)
      86. TABLE 85 SOUTH KOREA: THROMBUS TREATMENT MARKET FOR MEDICAL THERAPY, BY TREATMENT, 2018–2030 (USD MILLION)
      87. TABLE 86 REST OF ASIA-PACIFIC: THROMBUS TREATMENT MARKET, BY TYPE, 2018–2030 (USD MILLION)
      88. TABLE 87 REST OF ASIA-PACIFIC: THROMBUS TREATMENT MARKET, FOR ATRIAL THROMBUS, BY TYPE, 2018-2030 (USD MILLION)
      89. TABLE 88 REST OF ASIA-PACIFIC: THROMBUS TREATMENT MARKET, BY TREATMENT, 2018–2030 (USD MILLION)
      90. TABLE 89 REST OF ASIA-PACIFIC: THROMBUS TREATMENT MARKET FOR MEDICAL THERAPY, BY TREATMENT, 2018–2030 (USD MILLION)
      91. TABLE 90 REST OF THE WORLD: THROMBUS TREATMENT MARKET, BY COUNTRY, 2018–2030 (USD MILLION)
      92. TABLE 91 REST OF THE WORLD: THROMBUS TREATMENT MARKET, BY TYPE, 2018–2030 (USD MILLION)
      93. TABLE 92 REST OF THE WORLD: THROMBUS TREATMENT MARKET, FOR ATRIAL THROMBUS, BY TYPE, 2018-2030
      94. TABLE 93 REST OF THE WORLD: THROMBUS TREATMENT MARKET, BY TREATMENT, 2018–2030 (USD MILLION)
      95. TABLE 94 REST OF THE WORLD: THROMBUS TREATMENT MARKET, FOR MEDICAL THERAPY, BY TREATMENT, 2018–2030 (USD MILLION)
      96. TABLE 95 MIDDLE EAST: THROMBUS TREATMENT MARKET, BY TYPE, 2018–2030 (USD MILLION)
      97. TABLE 96 MIDDLE EAST: THROMBUS TREATMENT MARKET, FOR ATRIAL THROMBUS, BY TYPE, 2018-2030
      98. TABLE 97 MIDDLE EAST: THROMBUS TREATMENT MARKET, BY TREATMENT, 2018–2030 (USD MILLION)
      99. TABLE 98 MIDDLE EAST: THROMBUS TREATMENT MARKET, FOR MEDICAL THERAPY, BY TREATMENT, 2018–2030 (USD MILLION)
      100. TABLE 99 AFRICA: THROMBUS TREATMENT MARKET, BY TYPE, 2018–2030 (USD MILLION)
      101. TABLE 100 AFRICA: THROMBUS TREATMENT MARKET, FOR ATRIAL THROMBUS, BY TYPE, 2018-2030
      102. TABLE 101 AFRICA: THROMBUS TREATMENT MARKET, BY TREATMENT, 2018–2030 (USD MILLION)
      103. TABLE 102 AFRICA: THROMBUS TREATMENT MARKET, FOR MEDICAL THERAPY, BY TREATMENT, 2018–2030 (USD MILLION)
      104. TABLE 103 LATIN AMERICA: THROMBUS TREATMENT MARKET, BY TYPE, 2018–2030 (USD MILLION)
      105. TABLE 104 LATIN AMERICA: THROMBUS TREATMENT MARKET, FOR ATRIAL THROMBUS, BY TYPE, 2018-2030
      106. TABLE 105 LATIN AMERICA: THROMBUS TREATMENT MARKET, BY TREATMENT, 2018–2030 (USD MILLION)
      107. TABLE 106 LATIN AMERICA: THROMBUS TREATMENT MARKET, FOR MEDICAL THERAPY, BY TREATMENT, 2018–2030 (USD MILLION)
      108. TABLE 107 MAJOR PLAYERS IN THE GLOBAL THROMBUS TREATMENT MARKET
      109. TABLE 108 MOST ACTIVE PLAYERS IN THE GLOBAL THROMBUS TREATMENT MARKET
      110. TABLE 109 PRODUCT APPROVALS/PRODUCT LAUNCHES
      111. TABLE 110 PARTNERSHIP/COLLABORATION
      112. TABLE 111 TEVA PHARMACEUTICAL INDUSTRIES LTD.: PRODUCTS OFFERED
      113. TABLE 112 TEVA PHARMACEUTICAL INDUSTRIES LTD.: KEY DEVELOPMENTS
      114. TABLE 113 SANOFI: PRODUCTS OFFERED
      115. TABLE 114 PFIZER INC.: PRODUCTS OFFERED
      116. TABLE 115 BAYER AG: PRODUCTS OFFERED
      117. TABLE 116 BAYER AG: KEY DEVELOPMENTS
      118. TABLE 117 ANGIODYNAMICS.: PRODUCTS OFFERED
      119. TABLE 118 ANGIODYNAMICS.: KEY DEVELOPMENTS
      120. TABLE 119 BOEHRINGER INGELHEIM INTERNATIONAL GMBH: PRODUCTS OFFERED
      121. TABLE 120 BRISTOL-MYERS SQUIBB COMPANY: PRODUCTS OFFERED
      122. TABLE 121 BRISTOL-MYERS SQUIBB COMPANY: KEY DEVELOPMENTS
      123. TABLE 122 ASPEN HOLDINGS: PRODUCTS OFFERED
      124. TABLE 123 JOHNSON & JOHNSON SERVICES, INC.: PRODUCTS OFFERED
      125. TABLE 124 JOHNSON & JOHNSON SERVICES INC.: KEY DEVELOPMENTS
      126. TABLE 125 DAIICHI SANKYO COMPANY, LIMITED: PRODUCTS OFFERED   LIST OF FIGURES
      127. FIGURE 1 MARKET SYNOPSIS
      128. FIGURE 2 GLOBAL THROMBUS TREATMENT MARKET
      129. FIGURE 3 BOTTOM-UP AND TOP-DOWN APPROACHES
      130. FIGURE 4 MARKET DYNAMICS: GLOBAL THROMBUS TREATMENT MARKET
      131. FIGURE 5 DRIVERS: IMPACT ANALYSIS
      132. FIGURE 6 RESTRAINT: IMPACT ANALYSIS
      133. FIGURE 7 VALUE CHAIN ANALYSIS: GLOBAL THROMBUS TREATMENT MARKET
      134. FIGURE 8 Porter's Five Forces Analysis: GLOBAL THROMBUS TREATMENT MARKET
      135. FIGURE 9 GLOBAL THROMBUS TREATMENT MARKET, BY TYPE, 2021 & 2030 (USD MILLION)
      136. FIGURE 10 GLOBAL THROMBUS TREATMENT MARKET SHARE (%), BY TYPE, 2021
      137. FIGURE 11 GLOBAL THROMBUS TREATMENT MARKET, BY TREATMENT, 2021 & 2030 (USD MILLION)
      138. FIGURE 12 GLOBAL THROMBUS TREATMENT MARKET SHARE (%), BY TREATMENT, 2021
      139. FIGURE 13 GLOBAL: THROMBUS TREATMENT MARKET, BY REGION 2021 & 2030 (USD MILLION)
      140. FIGURE 14 GLOBAL: THROMBUS TREATMENT MARKET SHARE (%), BY REGION 2021
      141. FIGURE 15 NORTH AMERICA: THROMBUS TREATMENT MARKET SHARE (%), BY COUNTRY, 2021
      142. FIGURE 16 NORTH AMERICA: THROMBUS TREATMENT MARKET SHARE, BY COUNTRY, 2021
      143. FIGURE 17 EUROPE: THROMBUS TREATMENT MARKET SHARE (%), BY COUNTRY, 2021
      144. FIGURE 18 ASIA-PACIFIC: THROMBUS TREATMENT MARKET SHARE (%), BY COUNTRY, 2021
      145. FIGURE 19 ASIA-PACIFIC: THROMBUS TREATMENT MARKET SHARE, BY COUNTRY, 2021
      146. FIGURE 20 REST OF THE WORLD: THROMBUS TREATMENT MARKET SHARE (%), BY COUNTRY, 2021
      147. FIGURE 21 REST OF THE WORLD: THROMBUS TREATMENT MARKET SHARE, BY COUNTRY, 2021
      148. FIGURE 22 BENCHMARKING OF MAJOR COMPETITORS
      149. FIGURE 23 MAJOR STRATEGY ADOPTED BY KEY PLAYERS IN THE GLOBAL THROMBUS TREATMENT MARKET
      150. FIGURE 24 GLOBAL THROMBUS TREATMENT MARKET: Competitive Landscape
      151. FIGURE 25 SALES, 2021
      152. FIGURE 26 R&D, 2021
      153. FIGURE 27 TEVA PHARMACEUTICAL INDUSTRIES LTD.: FINANCIAL OVERVIEW SNAPSHOT
      154. FIGURE 28 TEVA PHARMACEUTICAL INDUSTRIES LTD.: SWOT ANALYSIS
      155. FIGURE 29 SANOFI: FINANCIAL OVERVIEW SNAPSHOT
      156. FIGURE 30 SANOFI.: SWOT ANALYSIS
      157. FIGURE 31 PFIZER INC.: FINANCIAL OVERVIEW SNAPSHOT
      158. FIGURE 32 PFIZER INC: SWOT ANALYSIS
      159. FIGURE 33 BAYER AG: FINANCIAL OVERVIEW SNAPSHOT
      160. FIGURE 34 ANGIODYNAMICS.: FINANCIAL OVERVIEW SNAPSHOT
      161. FIGURE 35 BOEHRINGER INGELHEIM INTERNATIONAL GMBH: FINANCIAL OVERVIEW SNAPSHOT
      162. FIGURE 36 BOEHRINGER INGELHEIM INTERNATIONAL GMBH: SWOT ANALYSIS
      163. FIGURE 37 BRISTOL-MYERS SQUIBB COMPANY: FINANCIAL OVERVIEW SNAPSHOT
      164. FIGURE 38 ASPEN HOLDINGS: FINANCIAL OVERVIEW SNAPSHOT
      165. FIGURE 39 JOHNSON & JOHNSON SERVICES, INC.: FINANCIAL OVERVIEW
      166. FIGURE 40 JOHNSON & JOHNSON SERVICES, INC.: SWOT ANALYSIS
      167. FIGURE 41 DAIICHI SANKYO COMPANY, LIMITED: FINANCIAL OVERVIEW

    Thrombus Treatment Market Segmentation

    Thrombus Treatment Type Outlook (USD Billion, 2018-2030)

    • Atrial Thrombus

      • Right Atrial Thrombus
      • Left Atrial Thrombus
    • Venous Thrombus

    Thrombus Treatment Treatment Outlook (USD Billion, 2018-2030)

    • Medical Therapy

      • Antiplatelets
      • Anticoagulants
      • Thrombolytics
    • Surgery
    • Others

    Thrombus Treatment Regional Outlook (USD Billion, 2018-2030)

    • North America Outlook (USD Billion, 2018-2030)

      • North America Thrombus Treatment by Type
        • Atrial Thrombus
        • Right Atrial Thrombus
        • Left Atrial Thrombus
        • Venous Thrombus
      • North America Thrombus Treatment by Treatment
        • Medical Therapy

          • Antiplatelets
          • Anticoagulants
          • Thrombolytics
        • Surgery
        • Others
      • US Outlook (USD Billion, 2018-2030)

      • US Thrombus Treatment by Type
        • Atrial Thrombus
        • Right Atrial Thrombus
        • Left Atrial Thrombus
        • Venous Thrombus
      • US Thrombus Treatment by Treatment
        • Medical Therapy

          • Antiplatelets
          • Anticoagulants
          • Thrombolytics
        • Surgery
        • Others
      • Canada Outlook (USD Billion, 2018-2030)

      • Canada Thrombus Treatment by Type
        • Atrial Thrombus
        • Right Atrial Thrombus
        • Left Atrial Thrombus
        • Venous Thrombus
      • Canada Thrombus Treatment by Treatment
        • Medical Therapy

          • Antiplatelets
          • Anticoagulants
          • Thrombolytics
        • Surgery
        • Others
    • Europe Outlook (USD Billion, 2018-2030)

      • Europe Thrombus Treatment by Type
        • Atrial Thrombus
        • Right Atrial Thrombus
        • Left Atrial Thrombus
        • Venous Thrombus
      • Europe Thrombus Treatment by Treatment
        • Medical Therapy

          • Antiplatelets
          • Anticoagulants
          • Thrombolytics
        • Surgery
        • Others
      • Germany Outlook (USD Billion, 2018-2030)

      • Germany Thrombus Treatment by Type
        • Atrial Thrombus
        • Right Atrial Thrombus
        • Left Atrial Thrombus
        • Venous Thrombus
      • Germany Thrombus Treatment by Treatment
        • Medical Therapy

          • Antiplatelets
          • Anticoagulants
          • Thrombolytics
        • Surgery
        • Others
      • France Outlook (USD Billion, 2018-2030)

      • France Thrombus Treatment by Type
        • Atrial Thrombus
        • Right Atrial Thrombus
        • Left Atrial Thrombus
        • Venous Thrombus
      • France Thrombus Treatment by Treatment
        • Medical Therapy

          • Antiplatelets
          • Anticoagulants
          • Thrombolytics
        • Surgery
        • Others
      • UK Outlook (USD Billion, 2018-2030)

      • UK Thrombus Treatment by Type
        • Atrial Thrombus
        • Right Atrial Thrombus
        • Left Atrial Thrombus
        • Venous Thrombus
      • UK Thrombus Treatment by Treatment
        • Medical Therapy

          • Antiplatelets
          • Anticoagulants
          • Thrombolytics
        • Surgery
        • Others
      • Italy Outlook (USD Billion, 2018-2030)

      • Italy Thrombus Treatment by Type
        • Atrial Thrombus
        • Right Atrial Thrombus
        • Left Atrial Thrombus
        • Venous Thrombus
      • Italy Thrombus Treatment by Treatment
        • Medical Therapy

          • Antiplatelets
          • Anticoagulants
          • Thrombolytics
        • Surgery
        • Others
      • Spain Outlook (USD Billion, 2018-2030)

      • Spain Thrombus Treatment by Type
        • Atrial Thrombus
        • Right Atrial Thrombus
        • Left Atrial Thrombus
        • Venous Thrombus
      • Spain Thrombus Treatment by Treatment
        • Medical Therapy

          • Antiplatelets
          • Anticoagulants
          • Thrombolytics
        • Surgery
        • Others
      • Rest of Europe Outlook (USD Billion, 2018-2030)

      • Rest of Europe Thrombus Treatment by Type
        • Atrial Thrombus
        • Right Atrial Thrombus
        • Left Atrial Thrombus
        • Venous Thrombus
      • Rest of Europe Thrombus Treatment by Treatment
        • Medical Therapy

          • Antiplatelets
          • Anticoagulants
          • Thrombolytics
        • Surgery
        • Others
    • Asia-Pacific Outlook (USD Billion, 2018-2030)

      • Asia-Pacific Thrombus Treatment by Type
        • Atrial Thrombus
        • Right Atrial Thrombus
        • Left Atrial Thrombus
        • Venous Thrombus
      • Asia-Pacific Thrombus Treatment by Treatment
        • Medical Therapy

          • Antiplatelets
          • Anticoagulants
          • Thrombolytics
        • Surgery
        • Others
      • China Outlook (USD Billion, 2018-2030)

      • China Thrombus Treatment by Type
        • Atrial Thrombus
        • Right Atrial Thrombus
        • Left Atrial Thrombus
        • Venous Thrombus
      • China Thrombus Treatment by Treatment
        • Medical Therapy

          • Antiplatelets
          • Anticoagulants
          • Thrombolytics
        • Surgery
        • Others
      • Japan Outlook (USD Billion, 2018-2030)

      • Japan Thrombus Treatment by Type
        • Atrial Thrombus
        • Right Atrial Thrombus
        • Left Atrial Thrombus
        • Venous Thrombus
      • Japan Thrombus Treatment by Treatment
        • Medical Therapy

          • Antiplatelets
          • Anticoagulants
          • Thrombolytics
        • Surgery
        • Others
      • India Outlook (USD Billion, 2018-2030)

      • India Thrombus Treatment by Type
        • Atrial Thrombus
        • Right Atrial Thrombus
        • Left Atrial Thrombus
        • Venous Thrombus
      • India Thrombus Treatment by Treatment
        • Medical Therapy

          • Antiplatelets
          • Anticoagulants
          • Thrombolytics
        • Surgery
        • Others
      • South Korea Outlook (USD Billion, 2018-2030)

      • South Korea Thrombus Treatment by Type
        • Atrial Thrombus
        • Right Atrial Thrombus
        • Left Atrial Thrombus
        • Venous Thrombus
      • South Korea Thrombus Treatment by Treatment
        • Medical Therapy

          • Antiplatelets
          • Anticoagulants
          • Thrombolytics
        • Surgery
        • Others
      • Australia Outlook (USD Billion, 2018-2030)

      • Australia Thrombus Treatment by Type
        • Atrial Thrombus
        • Right Atrial Thrombus
        • Left Atrial Thrombus
        • Venous Thrombus
      • Australia Thrombus Treatment by Treatment
        • Medical Therapy

          • Antiplatelets
          • Anticoagulants
          • Thrombolytics
        • Surgery
        • Others
      • Rest of Asia-Pacific Outlook (USD Billion, 2018-2030)

      • Rest of Asia-Pacific Thrombus Treatment by Type
        • Atrial Thrombus
        • Right Atrial Thrombus
        • Left Atrial Thrombus
        • Venous Thrombus
      • Rest of Asia-Pacific Thrombus Treatment by Treatment
        • Medical Therapy

          • Antiplatelets
          • Anticoagulants
          • Thrombolytics
        • Surgery
        • Others
    • Rest of the World Outlook (USD Billion, 2018-2030)

      • Rest of World Thrombus Treatment by Type
        • Atrial Thrombus
        • Right Atrial Thrombus
        • Left Atrial Thrombus
        • Venous Thrombus
      • Rest of World Thrombus Treatment by Treatment
        • Medical Therapy

          • Antiplatelets
          • Anticoagulants
          • Thrombolytics
        • Surgery
        • Others
      • Middle East Outlook (USD Billion, 2018-2030)

      • Middle East Thrombus Treatment by Type
        • Atrial Thrombus
        • Right Atrial Thrombus
        • Left Atrial Thrombus
        • Venous Thrombus
      • Middle East Thrombus Treatment by Treatment
        • Medical Therapy

          • Antiplatelets
          • Anticoagulants
          • Thrombolytics
        • Surgery
        • Others
      • Africa Outlook (USD Billion, 2018-2030)

      • Africa Thrombus Treatment by Type
        • Atrial Thrombus
        • Right Atrial Thrombus
        • Left Atrial Thrombus
        • Venous Thrombus
      • Africa Thrombus Treatment by Treatment
        • Medical Therapy

          • Antiplatelets
          • Anticoagulants
          • Thrombolytics
        • Surgery
        • Others
      • Latin America Outlook (USD Billion, 2018-2030)

      • Latin America Thrombus Treatment by Type
        • Atrial Thrombus
        • Right Atrial Thrombus
        • Left Atrial Thrombus
        • Venous Thrombus
      • Latin America Thrombus Treatment by Treatment
        • Medical Therapy

          • Antiplatelets
          • Anticoagulants
          • Thrombolytics
        • Surgery
        • Others


    Infographic

    Free Sample Request

    Kindly complete the form below to receive a free sample of this Report

    Get Free Sample

    Customer Strories

    “I am very pleased with how market segments have been defined in a relevant way for my purposes (such as "Portable Freezers & refrigerators" and "last-mile"). In general the report is well structured. Thanks very much for your efforts.”

    Victoria Milne

    Founder
    Case Study
    Chemicals and Materials