Thermoelectric Generator Market (2026 - 2035)

ID: MRFR/EnP/1313-HCR 100 Pages Priya Nagrale Last Updated: October 16, 2026
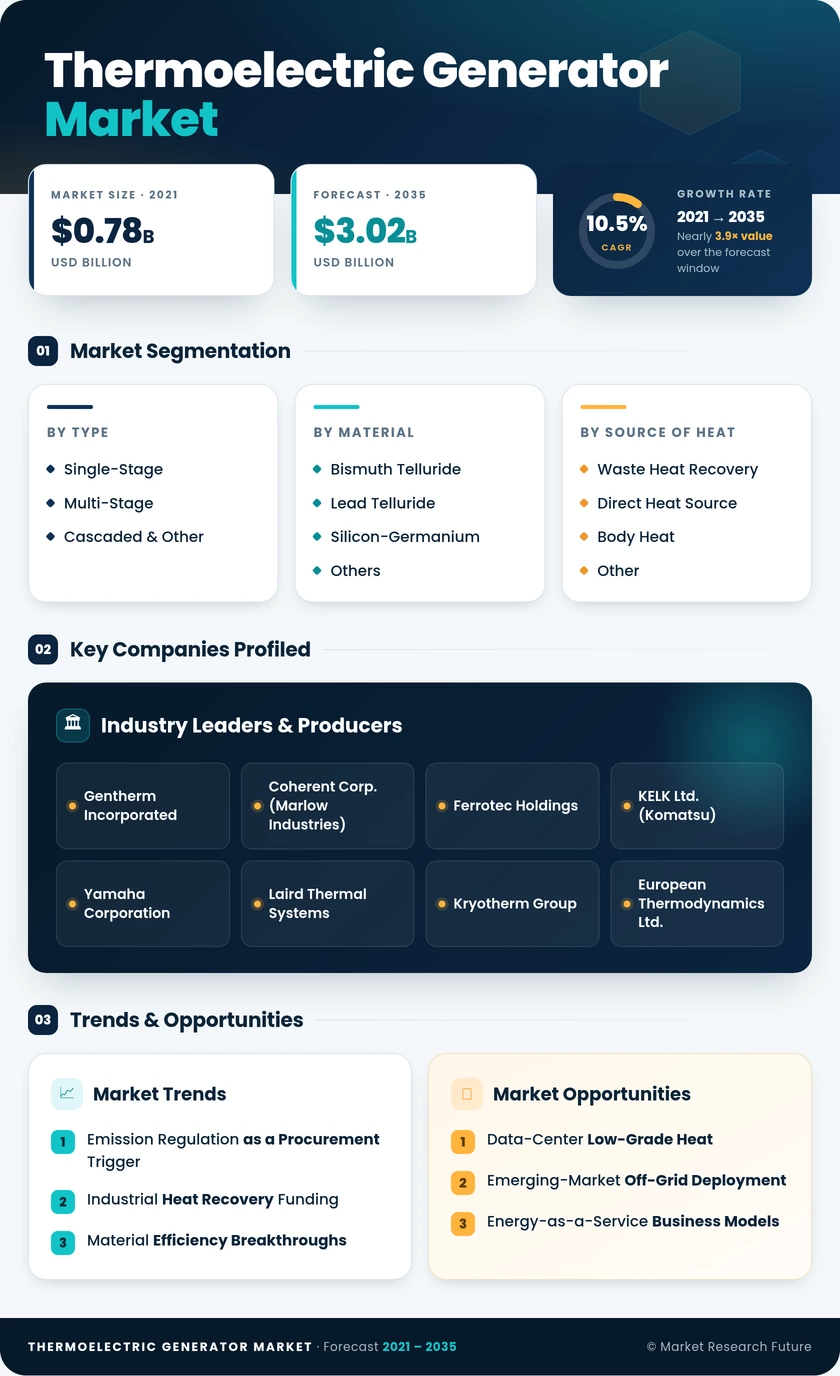
Thermoelectric Generator Market Research Report By Type (Single-Stage, Multi-Stage, Cascaded & Other), By Material (Bismuth Telluride, Lead Telluride, Silicon-Germanium, Others), By Source of Heat (Waste Heat Recovery, Direct Heat Source, Body Heat, Other), By Application (Automotive, Aerospace & Defense, Consumer Electronics & Wearables, Industrial, Others) - Forecast to 2035
Thermoelectric Generator Market
Market Size
Forecast Period2026-2035
CAGR (2026-2035)10.5%
2025 Market SizeUSD 1.11 Billion
2035 Market SizeUSD 3.02 Billion
Key Players
Gentherm Incorporated
Coherent Corp.
Ferrotec Holdings
KELK Ltd.
Yamaha Corporation
Laird Thermal Systems
Opportunities
  • Data-Center Low-Grade Heat
  • Emerging-Market Off-Grid Deployment
  • Energy-as-a-Service Business Models
  1. 1 Market Summary | |
    1. 1.1 Study Assumptions & Market Definition | |
    2. 1.2 Scope of the Study | |
    3. 1.3 Research Methodology | |
  2. 2 Key Report Takeaways | |
    1. 2.1 By Technology | |
    2. 2.2 By Sector | |
    3. 2.3 By Geography | |
  3. 3 Market Size & Forecast (2021–2035) | |
    1. 3.1 Historical Market Size (2021–2025) | |
    2. 3.2 Current & Forecast Market Size (2026–2035) | |
    3. 3.3 Year-over-Year Growth Analysis | |
  4. 4 Driver Impact Analysis | |
    1. 4.1 Emission Regulation as a Procurement Trigger | |
    2. 4.2 Industrial Heat Recovery Funding | |
    3. 4.3 Material Efficiency Breakthroughs | |
    4. 4.4 Remote and Unattended Power | |
  5. 5 Restraints Impact Analysis | |
    1. 5.1 The Efficiency Ceiling | |
    2. 5.2 Raw Material Concentration | |
    3. 5.3 Cost per Watt | |
  6. 6 Opportunities | |
    1. 6.1 Data-Center Low-Grade Heat | |
    2. 6.2 Emerging-Market Off-Grid Deployment | |
    3. 6.3 Energy-as-a-Service Business Models | |
    4. 6.4 Space Nuclear Power Procurement | |
    5. 6.5 Building-Integrated Micro-Harvesting | |
  7. 7 Regional Market Share & Country-Level Analysis | |
    1. 7.1 North America | | |
      1. 7.1.1 US | | |
      2. 7.1.2 Canada | | |
      3. 7.1.3 Mexico | |
    2. 7.2 Europe | | |
      1. 7.2.1 Germany | | |
      2. 7.2.2 UK | | |
      3. 7.2.3 France | | |
      4. 7.2.4 Italy | | |
      5. 7.2.5 Spain | | |
      6. 7.2.6 Nordic Countries | | |
      7. 7.2.7 Russia | | |
      8. 7.2.8 Rest of Europe | |
    3. 7.3 Asia-Pacific | | |
      1. 7.3.1 China | | |
      2. 7.3.2 India | | |
      3. 7.3.3 Japan | | |
      4. 7.3.4 South Korea | | |
      5. 7.3.5 ASEAN | | |
      6. 7.3.6 Rest of Asia-Pacific | |
    4. 7.4 South America | | |
      1. 7.4.1 Brazil | | |
      2. 7.4.2 Argentina | | |
      3. 7.4.3 Rest of South America | |
    5. 7.5 Middle East & Africa | | |
      1. 7.5.1 Saudi Arabia | | |
      2. 7.5.2 UAE | | |
      3. 7.5.3 South Africa | | |
      4. 7.5.4 Egypt | | |
      5. 7.5.5 Rest of Middle East & Africa | |
  8. 8 Future Outlook (2026–2035) | |
    1. 8.1 Thermal Intelligence and Autonomous Optimization | |
    2. 8.2 Materials Substitution Economics | |
    3. 8.3 The Electrification Supercycle | |
    4. 8.4 Disclosure-Driven Demand | |
  9. 9 Segmentation Analysis | |
    1. 9.1 By Type | | |
      1. 9.1.1 Single-Stage | | |
      2. 9.1.2 Multi-Stage | | |
      3. 9.1.3 Cascaded & Other | |
    2. 9.2 By Material | | |
      1. 9.2.1 Bismuth Telluride | | |
      2. 9.2.2 Lead Telluride | | |
      3. 9.2.3 Silicon-Germanium | | |
      4. 9.2.4 Others | |
    3. 9.3 By Source of Heat | | |
      1. 9.3.1 Waste Heat Recovery | | |
      2. 9.3.2 Direct Heat Source | | |
      3. 9.3.3 Body Heat | | |
      4. 9.3.4 Other | |
    4. 9.4 By Application | | |
      1. 9.4.1 Automotive | | |
      2. 9.4.2 Aerospace & Defense | | |
      3. 9.4.3 Consumer Electronics & Wearables | | |
      4. 9.4.4 Industrial | | |
      5. 9.4.5 Others | |
  10. 10 Competitive Landscape | |
    1. 10.1 Market Concentration Analysis | |
    2. 10.2 Competitive Benchmarking Matrix | |
    3. 10.3 Company Profiles | |
  11. 11 Recent News & Developments | |
  12. 12 Report Scope & Methodology | |
  13. 13 Detailed Sources & Citations | |
  14. 14 Frequently Asked Questions | | LIST OF TABLES | |
  15. TABLE 1 Global Thermoelectric Generator Market Size & Forecast, by Revenue (USD Billion), 2021–2035 | |
  16. TABLE 2 Global Thermoelectric Generator Market – Year-over-Year Growth Analysis, 2021–2035 | |
  17. TABLE 3 Driver Impact Analysis – Weighting, Geographic Relevance & Timeline | |
  18. TABLE 4 Restraint Impact Analysis – Weighting, Geographic Relevance & Timeline | |
  19. TABLE 5 Global Thermoelectric Generator Market Size, by Region, 2021–2035 (USD Billion) | |
  20. TABLE 6 North America Thermoelectric Generator Market Size, by Country, 2021–2035 (USD Billion) | |
  21. TABLE 7 Europe Thermoelectric Generator Market Size, by Country, 2021–2035 (USD Billion) | |
  22. TABLE 8 Asia-Pacific Thermoelectric Generator Market Size, by Country, 2021–2035 (USD Billion) | |
  23. TABLE 9 South America Thermoelectric Generator Market Size, by Country, 2021–2035 (USD Billion) | |
  24. TABLE 10 Middle East & Africa Thermoelectric Generator Market Size, by Country, 2021–2035 (USD Billion) | |
  25. TABLE 11 Global Thermoelectric Generator Market Size, by Type, 2021–2035 (USD Billion) | |
  26. TABLE 12 Global Thermoelectric Generator Market Size, by Material, 2021–2035 (USD Billion) | |
  27. TABLE 13 Global Thermoelectric Generator Market Size, by Source of Heat, 2021–2035 (USD Billion) | |
  28. TABLE 14 Global Thermoelectric Generator Market Size, by Application, 2021–2035 (USD Billion) | |
  29. TABLE 15 North America Thermoelectric Generator Market Size, by Application, 2021–2035 (USD Billion) | |
  30. TABLE 16 Europe Thermoelectric Generator Market Size, by Material, 2021–2035 (USD Billion) | |
  31. TABLE 17 Asia-Pacific Thermoelectric Generator Market Size, by Type, 2021–2035 (USD Billion) | |
  32. TABLE 18 Competitive Benchmarking Matrix – Global Thermoelectric Generator Market, 2026 | |
  33. TABLE 19 Company Profiles – Key Players, Global Thermoelectric Generator Market | |
  34. TABLE 20 Recent Developments & Strategic Announcements, 2023–2025 | |
  35. TABLE 21 Report Scope & Methodology Summary | |
  36. TABLE 22 Detailed Sources & Citations Index | | LIST OF FIGURES | |
  37. FIGURE 1 Global Thermoelectric Generator Market Dynamics – Drivers, Restraints & Opportunities | |
  38. FIGURE 2 Industry Value Chain Analysis – Materials, Modules, Systems & Integration | |
  39. FIGURE 3 Porter's Five Forces Analysis | |
  40. FIGURE 4 Global Market Size Trend, 2021–2035 (USD Billion) | |
  41. FIGURE 5 Year-over-Year Growth Curve, 2022–2035 (%) | |
  42. FIGURE 6 Market Share by Type, 2025 vs 2035 (%) | |
  43. FIGURE 7 Market Share by Material, 2025 vs 2035 (%) | |
  44. FIGURE 8 Market Share by Source of Heat, 2025 (%) | |
  45. FIGURE 9 Market Share by Application, 2025 vs 2035 (%) | |
  46. FIGURE 10 Regional Revenue Share, 2025 (%) | |
  47. FIGURE 11 Regional CAGR Comparison, 2026–2035 (%) | |
  48. FIGURE 12 Country-Level Contribution within North America, 2025 (%) | |
  49. FIGURE 13 Country-Level Contribution within Asia-Pacific, 2025 (%) | |
  50. FIGURE 14 Competitive Landscape – Estimated Revenue Share Distribution, 2026 | |
  51. FIGURE 15 Strategic Positioning Matrix – Capability vs Scale

Segmentation Quick Reference

DimensionSub-SegmentsDominant SegmentFastest Growing Segment
By TypeSingle-Stage, Multi-Stage, Cascaded & OtherSingle-StageMulti-Stage
By MaterialBismuth Telluride, Lead Telluride, Silicon-Germanium, OthersBismuth TellurideSilicon-Germanium
By Source of HeatWaste Heat Recovery, Direct Heat Source, Body Heat, OtherWaste Heat RecoveryBody Heat
By ApplicationAutomotive, Aerospace & Defense, Consumer Electronics & Wearables, Industrial, OthersAutomotiveConsumer Electronics & Wearables
By GeographyNorth America, Europe, Asia-Pacific, South America, Middle East & AfricaNorth AmericaAsia-Pacific


Market Segmentation Overview

By Type

Sub-SegmentKey Trend
Single-StageStandardized cartridge designs cutting engineering cost per installation
Multi-StagePrecision temperature control for medical and photonics applications
Cascaded & OtherCustom stacks for aerospace platforms with extreme gradients


Architecture choice follows the heat source, not the buyer's preference. Most commercial streams sit in a band where a single stage extracts nearly all economically recoverable power, and additional stages simply add cost. Multi-stage growth therefore reflects new applications entering the market rather than displacement of existing ones.

By Material

Sub-SegmentKey Trend
Bismuth TellurideNano-structuring lifting figure of merit at near-ambient temperatures
Lead TellurideSteady mid-temperature industrial retrofit demand
Silicon-GermaniumCapacity expansion tied to space and high-temperature programs
OthersHalf-Heusler and skutterudite qualification approaching commercialization


Material strategy is now a supply-chain decision as much as a performance one. Every major supplier runs parallel qualification tracks so that a tellurium price shock does not halt shipments, and that hedging effort explains why alternative chemistries advance faster than their current revenue share suggests.

By Source of Heat

Sub-SegmentKey Trend
Waste Heat RecoveryGrant-funded industrial retrofits shortening payback windows
Direct Heat SourceOff-grid burner and radioisotope units for unattended sites
Body HeatBattery-free continuous monitoring in medical and fitness devices
OtherGeothermal and solar-thermal hybrid configurations


Recovery applications carry the revenue while body-heat applications carry the unit volume. That divergence forces suppliers into two distinct operating models — project engineering on one side, consumer-grade manufacturing yield on the other — and few companies execute both well.

By Application

Sub-SegmentKey Trend
AutomotiveExhaust recovery programs restarting under 2027 compliance deadlines
Aerospace & DefenseQualification barriers sustaining premium margins
Consumer Electronics & WearablesSensor proliferation driving millions of low-cost modules
IndustrialCement, glass, and metals furnace retrofits scaling
OthersMarine auxiliary power, agriculture telemetry, telecom towers


Application mix shifts meaningfully across the forecast. Automotive stays largest in absolute dollars, but its relative weight declines as consumer and industrial volumes compound faster, producing a more balanced revenue base by 2035 than the market has ever had.

By Geography

Sub-SegmentKey Trend
North AmericaFederal decarbonization funding de-risking first-of-a-kind projects
EuropeMandatory efficiency audit follow-through converting into orders
Asia-PacificDomestic manufacturing capacity paired with intensity mandates
South AmericaRemote mining and offshore telemetry replacing diesel
Middle East & AfricaFlare-fed and cathodic protection deployments expanding


Regional divergence is widening rather than converging. North America and Europe buy on policy compliance, Asia-Pacific buys on cost and industrial intensity targets, and the remaining regions buy on logistics avoidance — three fundamentally different sales motions requiring three different channel strategies.




Download PDF ×

We do not share your information with anyone. However, we may send you emails based on your report interest from time to time. You may contact us at any time to opt-out.