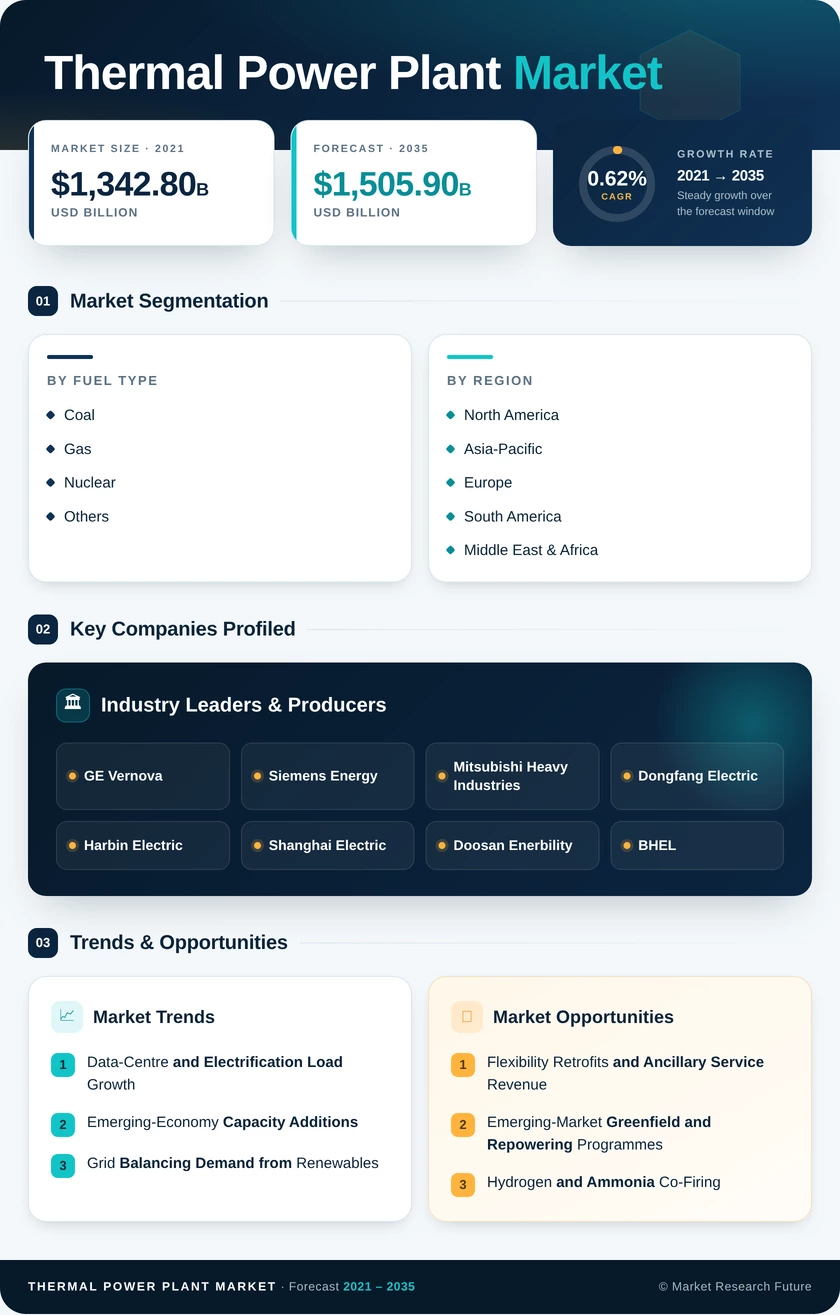
Thermal Power Plant Market (2026 - 2035)

ID: MRFR/EnP/21690-HCR 100 Pages Snehal Singh Last Updated: October 16, 2026
Thermal Power Plant Market Research Report By Fuel Type (Coal, Gas, Nuclear, Others) - Forecast to 2035
Thermal Power Plant Market
Market Size
Forecast Period2026-2035
CAGR (2026-2035)0.62%
2025 Market SizeUSD 1,412.6 Billion
2035 Market SizeUSD 1,505.9 Billion
Key Players
GE Vernova
Siemens Energy
Mitsubishi Heavy Industries
Dongfang Electric
Harbin Electric
Shanghai Electric
Opportunities
  • Flexibility Retrofits and Ancillary Service Revenue
  • Emerging-Market Greenfield and Repowering Programmes
  • Hydrogen and Ammonia Co-Firing
  1. 1 Market Summary | |
    1. 1.1 Study Assumptions & Market Definition | |
    2. 1.2 Scope of the Study | |
    3. 1.3 Research Methodology | |
  2. 2 Key Report Takeaways | |
    1. 2.1 By Fuel Type | |
    2. 2.2 By Region | |
  3. 3 Market Size and Forecast (2021–2035) | |
    1. 3.1 Historical Market Size (2021–2025) | |
    2. 3.2 Current & Forecast Market Size (2026–2035) | |
    3. 3.3 Market Size by Revenue (USD Billion) | |
    4. 3.4 Year-over-Year Growth Analysis | |
  4. 4 Driver Impact Analysis | |
    1. 4.1 Data-Centre and Electrification Load Growth | |
    2. 4.2 Emerging-Economy Capacity Additions | |
    3. 4.3 Grid Balancing Demand from Renewables | |
    4. 4.4 Ultra-Supercritical Efficiency Upgrades | |
    5. 4.5 Gas Turbine Fleet Expansion | |
    6. 4.6 Nuclear Life-Extension Programmes | |
    7. 4.7 Carbon Capture Retrofit Incentives | |
  5. 5 Restraints Impact Analysis | |
    1. 5.1 Coal Phase-Out Policy Commitments | |
    2. 5.2 Renewable Cost Deflation | |
    3. 5.3 Capital Access and Insurance Withdrawal | |
    4. 5.4 Carbon Pricing and Compliance Cost | |
    5. 5.5 Declining Capacity Factors | |
  6. 6 Opportunities | |
    1. 6.1 Flexibility Retrofits and Ancillary Service Revenue | |
    2. 6.2 Emerging-Market Greenfield and Repowering Programmes | |
    3. 6.3 Hydrogen and Ammonia Co-Firing | |
    4. 6.4 Digital Performance Monitoring and Outcome-Based Contracts | |
    5. 6.5 Carbon Capture as a Service | |
  7. 7 Regional Market Share and Country-Level Analysis | |
    1. 7.1 North America | | |
      1. 7.1.1 US | | |
      2. 7.1.2 Canada | | |
      3. 7.1.3 Mexico | |
    2. 7.2 Europe | | |
      1. 7.2.1 Germany | | |
      2. 7.2.2 UK | | |
      3. 7.2.3 France | | |
      4. 7.2.4 Italy | | |
      5. 7.2.5 Spain | | |
      6. 7.2.6 Nordic Countries | | |
      7. 7.2.7 Russia | | |
      8. 7.2.8 Rest of Europe | |
    3. 7.3 Asia-Pacific | | |
      1. 7.3.1 China | | |
      2. 7.3.2 India | | |
      3. 7.3.3 Japan | | |
      4. 7.3.4 South Korea | | |
      5. 7.3.5 ASEAN | | |
      6. 7.3.6 Rest of Asia-Pacific | |
    4. 7.4 South America | | |
      1. 7.4.1 Brazil | | |
      2. 7.4.2 Argentina | | |
      3. 7.4.3 Rest of South America | |
    5. 7.5 Middle East & Africa | | |
      1. 7.5.1 Saudi Arabia | | |
      2. 7.5.2 UAE | | |
      3. 7.5.3 South Africa | | |
      4. 7.5.4 Egypt | | |
      5. 7.5.5 Rest of MEA | |
  8. 8 Future Outlook (2026–2035) | |
    1. 8.1 Autonomous Plant Operations | |
    2. 8.2 The Firm Capacity Premium | |
    3. 8.3 Fuel Transition Pathways | |
    4. 8.4 Emissions Disclosure and Asset Valuation | |
  9. 9 Segmentation Analysis | |
    1. 9.1 By Fuel Type | | |
      1. 9.1.1 Coal | | |
      2. 9.1.2 Gas | | |
      3. 9.1.3 Nuclear | | |
      4. 9.1.4 Others | |
  10. 10 Competitive Landscape | |
    1. 10.1 Market Share Analysis (2026) | |
    2. 10.2 Competitive Benchmarking Matrix | |
    3. 10.3 Company Profiles | | |
      1. 10.3.1 GE Vernova | | |
      2. 10.3.2 Siemens Energy | | |
      3. 10.3.3 Mitsubishi Heavy Industries | | |
      4. 10.3.4 Dongfang Electric | | |
      5. 10.3.5 Harbin Electric | | |
      6. 10.3.6 Shanghai Electric | | |
      7. 10.3.7 Doosan Enerbility | | |
      8. 10.3.8 BHEL | | |
      9. 10.3.9 Toshiba Energy Systems | | |
      10. 10.3.10 Ansaldo Energia | | |
      11. 10.3.11 Wärtsilä | |
  11. 11 Recent News & Developments | |
  12. 12 Report Scope and Methodology | |
    1. 12.1 Study Period & Base Year | |
    2. 12.2 Data Sources & Citations | |
    3. 12.3 Abbreviations | |
  13. 13 Detailed Sources and Citations | |
  14. 14 Frequently Asked Questions (FAQs) | | LIST OF TABLES | |
  15. TABLE 1 Global Thermal Power Plant Market Size & Forecast, by Revenue (USD Billion), 2021–2035 | |
  16. TABLE 2 Global Thermal Power Plant Market – Year-over-Year Growth Analysis, 2021–2035 | |
  17. TABLE 3 Driver Impact Analysis Matrix, 2026–2035 | |
  18. TABLE 4 Restraint Impact Analysis Matrix, 2026–2035 | |
  19. TABLE 5 Global Thermal Power Plant Market Size, by Fuel Type, 2021–2035 (USD Billion) | |
  20. TABLE 6 Global Thermal Power Plant Market Size, by Region, 2021–2035 (USD Billion) | |
  21. TABLE 7 North America Thermal Power Plant Market Size, by Country, 2021–2035 (USD Billion) | |
  22. TABLE 8 Europe Thermal Power Plant Market Size, by Country, 2021–2035 (USD Billion) | |
  23. TABLE 9 Asia-Pacific Thermal Power Plant Market Size, by Country, 2021–2035 (USD Billion) | |
  24. TABLE 10 South America Thermal Power Plant Market Size, by Country, 2021–2035 (USD Billion) | |
  25. TABLE 11 Middle East & Africa Thermal Power Plant Market Size, by Country, 2021–2035 (USD Billion) | |
  26. TABLE 12 North America Thermal Power Plant Market Size, by Fuel Type, 2021–2035 (USD Billion) | |
  27. TABLE 13 Europe Thermal Power Plant Market Size, by Fuel Type, 2021–2035 (USD Billion) | |
  28. TABLE 14 Asia-Pacific Thermal Power Plant Market Size, by Fuel Type, 2021–2035 (USD Billion) | |
  29. TABLE 15 South America Thermal Power Plant Market Size, by Fuel Type, 2021–2035 (USD Billion) | |
  30. TABLE 16 Middle East & Africa Thermal Power Plant Market Size, by Fuel Type, 2021–2035 (USD Billion) | |
  31. TABLE 17 Competitive Benchmarking Matrix – Global Thermal Power Plant Market, 2026 | |
  32. TABLE 18 Company Profiles – Key Players, Global Thermal Power Plant Market | |
  33. TABLE 19 Recent Developments & Strategic Announcements, 2023–2025 | |
  34. TABLE 20 Report Scope & Methodology Summary | |
  35. TABLE 21 Detailed Sources and Citations Index | | LIST OF FIGURES | |
  36. FIGURE 1 Global Thermal Power Plant Market – Market Dynamics Overview | |
  37. FIGURE 2 Global Thermal Power Plant Market – Industry Value Chain Analysis | |
  38. FIGURE 3 Global Thermal Power Plant Market – Porter's Five Forces Analysis | |
  39. FIGURE 4 Global Thermal Power Plant Market Size Trend, 2021–2035 (USD Billion) | |
  40. FIGURE 5 Global Thermal Power Plant Market – Year-over-Year Growth Trend, 2021–2035 | |
  41. FIGURE 6 Market Share by Fuel Type, 2025 vs 2035 (%) | |
  42. FIGURE 7 Fuel Type Segment CAGR Comparison, 2026–2035 (%) | |
  43. FIGURE 8 Regional Market Share, 2025 (%) | |
  44. FIGURE 9 Regional Market Share, 2035 (%) | |
  45. FIGURE 10 Regional CAGR Comparison, 2026–2035 (%) | |
  46. FIGURE 11 Competitive Landscape – Estimated Revenue Share Ranges, 2026 | |
  47. FIGURE 12 Strategic Positioning Map – Leading Suppliers | |
  48. FIGURE 13 Driver and Restraint Impact Waterfall, 2026–2035

Segmentation Quick Reference

DimensionSub-SegmentsDominant SegmentFastest Growing Segment
By Fuel TypeCoal, Gas, Nuclear, OthersCoal — 51.8% share (2025)Gas — 2.41% CAGR (2026–2035)
By RegionNorth America, Asia-Pacific, Europe, South America, Middle East & AfricaAsia-Pacific — 58.2% share (2025)Asia-Pacific — 1.34% CAGR (2026–2035)


Market Segmentation Overview

By Fuel Type

Sub-SegmentKey Trend
CoalCapacity payment mechanisms in China and India sustain revenue as utilisation falls; ultra-supercritical retrofits and flue gas desulphurisation dominate capital spend.
GasAdvanced-class combined-cycle orders at a decade high; hydrogen-ready combustors becoming a standard procurement requirement
NuclearLife-extension and refurbishment spending replaces new-build as the primary revenue source across OECD fleets.
OthersBiomass co-firing, waste-to-energy and oil-fired peaking shaped by local fuel policy and waste management mandates


Coal leads on installed base rather than momentum: Chinese and Indian regulators have deliberately restructured tariffs to pay coal units for availability, which keeps revenue intact even as capacity factors decline toward 45%. Gas is the fastest-growing sub-segment because buyers now specify build speed and ramp capability alongside efficiency, and advanced-class machines clear both bars while cutting carbon intensity roughly 60% against subcritical coal. Nuclear revenue is refurbishment-led, tied to licence renewal cycles rather than construction pipelines, and Others stays small and regionally fragmented.




Download PDF ×

We do not share your information with anyone. However, we may send you emails based on your report interest from time to time. You may contact us at any time to opt-out.