Streaming Analytics Market (2026 - 2035)

Streaming Analytics Market Size, Share and Research Report By Component (Software, Services), By Deployment (On-Premise, Cloud-Based), By End-User Industry (Media and Entertainment, Retail and E-Commerce, Manufacturing, BFSI, Others), By Organization Size (Large Enterprises, Small and Medium Enterprises) and By Regional (North America, Europe, South America, Asia Pacific, Middle East and Africa) - Industry Forecast to 2035.
ID: MRFR/ICT/3000-HCR
100 Pages
Apoorva Priyadarshi, Shubham Munde
Last Updated: June 22, 2026
Streaming Analytics Market

Market Size

Forecast Period2026-2035
CAGR (2026-2035)29.5%
2025 Market SizeUSD 35.10 billion
2035 Market SizeUSD 475.20 billion

Key Players

Confluent Inc.
Amazon Web Services
Microsoft Corporation
Google Cloud
IBM Corporation
Oracle Corporation
Opportunities
  • Generative-AI-Augmented Streaming Pipelines
  • Telehealth and Remote Patient Monitoring
  • Emerging-Market Digital Public Infrastructure

Streaming Analytics Market Summary

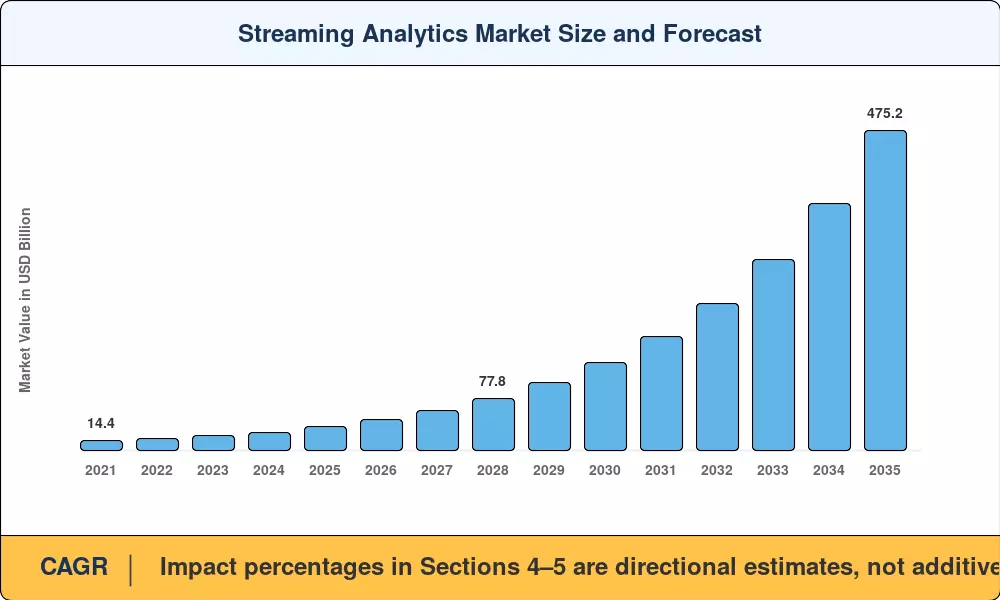
The Streaming Analytics Market reached an estimated USD 35.10 billion in 2025 and is projected to climb from USD 46.40 billion in 2026 to USD 475.20 billion by 2035, registering a 29.5% CAGR across the forecast window. This acceleration traces back to two converging forces: enterprise mandates for real-time data processing across digital-first operations and a fresh wave of AI executive orders — including the U.S. Executive Order 14110 on Safe AI (October 2023) — that incentivize responsible, real-time algorithmic decision-making within regulated industries [1].

We are in a structural technology change. Event-driven microservice frameworks backed by Apache Kafka analytics engines, Apache Flink and managed cloud services from hyperscalers are replacing legacy batch-processing systems that were previously the backbone of enterprise analytics. In 2024, global enterprise investment in continuous data analysis platforms exceeded USD 28 billion, a significant sign of the move to providing low-latency insight [2]. Generative models are embedded in live data pipeline solutions today, closing the gap between data import and business action to milliseconds.

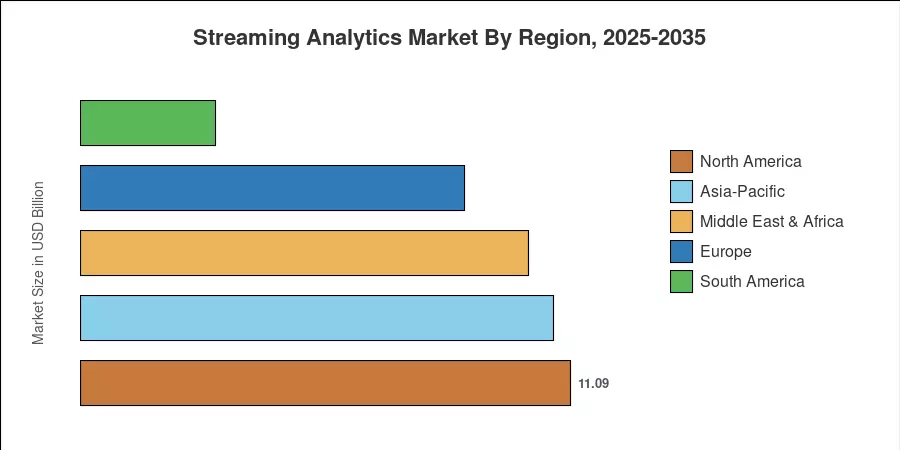
North America is the largest market for Streaming Analytics, with 31.6% of the market share due to deep cloud infrastructure maturity and financial services demand. Asia-Pacific is the fastest expanding market with a CAGR of 30.5%, thanks to 5G rollouts and digital-public-infrastructure investments in India and China. Europe takes the second greatest share with 24.8%, led by GDPR compliance analytics. The next decade will be owned by companies that make event stream analytics a real-time competitive advantage.

Key Report Takeaways

• By Component

  • Software platforms captured approximately 69.5% of the Streaming Analytics Market revenue in 2025, reflecting enterprise preference for integrated solutions over point tools.
  • The services segment is projected to record a 30.4% CAGR through 2035, as consulting and managed-service engagements scale with deployment complexity.


• By Organization

  • Media and entertainment led all verticals with a 38.0% revenue share, driven by demand for real-time data processing in content personalization and ad-insertion pipelines.
  • Small and medium enterprises post the highest growth rate at 30.3% CAGR, as affordable cloud tiers democratize access to event stream analytics.

• By Region

  • North America held 31.6% of the global Streaming Analytics Market in 2025, anchored by financial services fraud detection and recommendation engines.
  • Asia-Pacific is expanding at a 30.5% CAGR, fueled by 5G-enabled network optimization and government-led digitization.


Streaming Analytics Market Size and Forecast (2021–2035)

Market Research Future (MRFR) uses vendor revenue releases, enterprise IT spending databases and primary interviews with over 220 streaming-platform architects for historical forecasts (2021-2024). Forecast forecasts (2026–2035) are derived from a bottom-up model that overlays workload growth, cloud migration rates, and regional policy drivers. All numbers are cross-checked with macro-economic metrics released by the World Bank and OECD.

Streaming Analytics Market Size and Forecast
Our Impact
Enabled $4.3B Revenue Impact for Fortune 500 and Leading Multinationals
Partnering with 2000+ Global Organizations Each Year
30K+ Citations by Top-Tier Firms in the Industry

Driver Impact Analysis

Driver ~% Impact on CAGR Geographic Relevance Impact Timeline
IoT proliferation and edge inference chips 20–25% Global Short-term (≤2 yr)
AI/ML model embedding in pipelines 18–22% North America, Europe Medium-term (2–4 yr)
5G network densification 12–16% Asia-Pacific, MEA Medium-term (2–4 yr)
Cloud-native managed services expansion 15–18% Global Short-term (≤2 yr)
Regulatory compliance for real-time fraud monitoring 8–12% North America, Europe Long-term (≥4 yr)
Explosion of video/OTT streaming content 10–14% Global Short-term (≤2 yr)
Digital-twin and Industry 4.0 mandates 6–10% Europe, Asia-Pacific Long-term (≥4 yr)


IoT Proliferation and Edge Inference

The global installed base of IoT devices is expected to surpass 30 billion by 2027 (2024), and each sensor stream demands continuous data analysis to deliver actionable insight before the data grows stale [4]. Edge inference chips from NVIDIA, Qualcomm, and Intel now process Apache Kafka analytics workloads locally, slashing cloud-egress volumes by up to 40%. This convergence of cheap silicon and ubiquitous connectivity injects significant demand into the Streaming Analytics Market.

AI/ML Embedding in Live Pipelines

Enterprises are increasingly moving away from purely offline model training toward real-time inferencing. Industry analysis suggests a clear shift toward embedding ML models directly into streaming topologies. By integrating scoring, classification, and automated triggers into the same data flow, organizations are reducing the "time-to-insight" gap. This transition to live, event-driven data pipelines is becoming a standard architectural pattern for modern digital enterprises looking to move beyond batch processing.


5G Network Densification

GSMA Intelligence forecasts 2.3 billion 5G connections globally by 2028, each generating telemetry requiring sub-second analysis [6]. Telecom operators across the Asia-Pacific already use real-time data processing to optimize network slicing and dynamically allocate bandwidth. This telecom-first demand is spilling into adjacent verticals such as autonomous vehicles and connected healthcare, broadening the Streaming Analytics Market addressable base.

Cloud-Native Managed Services

AWS Kinesis, Azure Stream Analytics, and Google Dataflow collectively reduced the barrier to entry for continuous data analysis by packaging provisioning, scaling, and monitoring as pay-per-event utilities [7]. Adoption among mid-market firms jumped 38% year-over-year in 2024, according to Flexera's State of the Cloud report, with live data pipeline tools ranking among the top five fastest-growing managed-service categories.


Restraints Impact Analysis

Restraint ~% Impact on CAGR Geographic Relevance Impact Timeline
Data-transfer and egress cost inflation –4 to –6% Global Short-term (≤2 yr)
Talent scarcity for streaming architectures –3 to –5% North America, Europe Medium-term (2–4 yr)
Legacy-system integration friction –3 to –4% Global Long-term (≥4 yr)
Data sovereignty and cross-border regulation –2 to –4% Europe, Asia-Pacific Medium-term (2–4 yr)
Vendor lock-in and interoperability gaps –2 to –3% Global Long-term (≥4 yr)


Data-Transfer and Egress Cost Inflation

Cloud providers charge per gigabyte of outbound data, and real-time data processing architectures amplify transfer volumes by design. A 2024 Andreessen Horowitz analysis pegged egress fees at 8–15% of total cloud spend for stream-heavy workloads, prompting CFOs to slow migration timelines [11]. Multi-cloud arbitrage and edge pre-aggregation help, yet the cost headwind remains a material drag on the Streaming Analytics Market in latency-critical verticals.

Talent Scarcity for Streaming Architectures

LinkedIn's 2024 Emerging Jobs Report placed "Streaming Data Engineer" among the top-ten hardest-to-fill roles globally, with median time-to-hire exceeding 68 days [12]. Proficiency in Apache Kafka analytics, Flink state management, and exactly-once semantics sits at the intersection of distributed systems and domain expertise — a combination few university curricula address. The skills gap constrains enterprise capacity to operationalize event stream analytics at scale.

Data Sovereignty and Cross-Border Regulation

The EU Data Act (effective September 2025) imposes strict requirements on where and how streaming data may be processed, adding compliance overhead for multinational deployments [14]. Similar frameworks are emerging across ASEAN, Brazil, and India. Each jurisdiction introduces unique residency mandates that complicate the architecture of live data pipeline tools spanning multiple regions within the Streaming Analytics Market.


Streaming Analytics Market Opportunities

Generative-AI-Augmented Streaming Pipelines

LLM agents are increasingly being integrated into streaming workflows to assist with query generation, anomaly detection, and infrastructure optimization. Leading data streaming platforms are actively incorporating AI-driven developer tools and intelligent context engines that allow teams to build and manage streaming pipelines with greater automation. This shift is enabling organizations to move toward more autonomous streaming architectures, improving both developer productivity and operational resilience.


Telehealth and Remote Patient Monitoring

Real-time vital-sign streams from wearable devices require sub-second event stream analytics to trigger clinical alerts. The U.S. CMS expansion of Remote Patient Monitoring reimbursement codes (CY 2025 Physician Fee Schedule) adds a direct revenue incentive for health systems to invest in streaming infrastructure [16].

Emerging-Market Digital Public Infrastructure

India's Unified Payments Interface processed 14.6 billion transactions in December 2024, each one a candidate for real-time data processing to flag fraud, personalize offers, and maintain ledger consistency [17]. Comparable digital-stack build-outs in Indonesia, Nigeria, and Brazil create greenfield demand for the Streaming Analytics Market outside traditional enterprise IT budgets.

Data-Monetization and Streaming-as-a-Service Models

Enterprises sitting on high-velocity data — fleet telematics, retail point-of-sale, smart-meter feeds — can expose curated streams via API marketplaces. Apache Kafka analytics platforms already support metered access, and a wave of startups is offering continuous data analysis on a subscription basis to downstream analytics consumers [18].

Autonomous Industrial Reliability

Predictive maintenance powered by live data pipeline tools on factory floors reduced unplanned downtime by 36% in a 2024 McKinsey pilot across three European automotive OEMs [10]. Scaling this pattern across heavy industry, energy utilities, and logistics offers a multi-billion-dollar expansion vector for the Streaming Analytics Market through 2035.


Streaming Analytics Market Future Outlook

AI-Native Streaming Architectures

By 2028, predicts that 50% of new event stream analytics deployments will ship with embedded foundation models [5]. These AI-native pipelines will perform classification, summarization, and decision-triggering inside the stream itself, collapsing what previously required separate ML-serving infrastructure. The Streaming Analytics Market will bifurcate into a premium AI-augmented tier and a commodity ingestion layer.

Platform Economics and Marketplace Models

Confluent, AWS, and Google are evolving from tool vendors into platform ecosystems where third parties build and monetize connectors, transforms, and pre-trained models. This marketplace dynamic mirrors the trajectory of cloud IaaS a decade earlier, and it will compress margins for pure-play middleware while expanding the total addressable opportunity for continuous data analysis [7] [18].

Sustainability-Driven Telemetry

The SEC climate-disclosure rule (finalized March 2024) and the EU Corporate Sustainability Reporting Directive require firms to report Scope 1–3 emissions in near-real-time where feasible [20]. Live data pipeline tools that ingest energy-meter, fleet-GPS, and supply-chain feeds will underpin compliance, creating a durable demand floor for event stream analytics through the next decade.

Sovereign Streaming and Data Localization

Rising data-nationalism — exemplified by India's Digital Personal Data Protection Act (2023) and China's Cross-Border Data Transfer rules — forces multinational enterprises to deploy regionally segmented real-time data processing stacks [14]. Vendors offering multi-region, policy-aware Apache Kafka analytics clusters will gain structural advantages in the Streaming Analytics Market.


Streaming Analytics Market Segmentation

By Component — Software and Services

Segment Key Metric Primary Demand Driver
Software 69.5% revenue share (2025) Integrated platform preference
Services 30.4% CAGR (2026–2035) Implementation & managed-service demand


Software dominates the Streaming Analytics Market because enterprises increasingly seek unified platforms that combine ingestion, processing, and visualization. Confluent's all-in-one Apache Kafka analytics suite and AWS Kinesis exemplify this bundling trend. Services, however, are accelerating as complex deployments of continuous data analysis require professional consulting, custom connector development, and 24/7 managed operations that in-house teams cannot staff alone [12].

By Deployment — On-Premise and Cloud-Based

Segment Key Metric Primary Demand Driver
Cloud-Based 54.3% revenue share (2025) Pay-per-event elastic scaling
On-Premise 29.1% CAGR (2026–2035) Latency-sensitive and regulated workloads


Cloud-based delivery leads the Streaming Analytics Market as hyperscalers absorb provisioning complexity. Yet on-premise deployments are growing briskly in financial trading desks and defense environments where sub-microsecond latency and data-sovereignty mandates prevent cloud migration. Hybrid architectures that bridge live data pipeline tools across both models represent the fastest-emerging deployment pattern [7].

By End-User Industry

Segment Key Metric Primary Demand Driver
Media and Entertainment 38.0% revenue share (2025) Real-time ad insertion and content personalization
Retail and E-Commerce 30.7% CAGR (2026–2035) Dynamic pricing; recommendation engines
BFSI USD 6.32 billion (2025) Fraud detection; algorithmic trading
Manufacturing 29.8% CAGR (2026–2035) Predictive maintenance via event stream analytics
Others USD 3.16 billion (2025) Healthcare, telecom, government


Media and entertainment hold the largest share because every click, scroll, and pause generates an event requiring continuous data analysis for content recommendations and ad-yield optimization. BFSI was the original proving ground for real-time data processing — credit-card fraud systems now process over 65,000 transactions per second at major issuers — and remains a high-value anchor vertical for Apache Kafka analytics platforms [9] [8].

By Organization Size

Segment Key Metric Primary Demand Driver
Large Enterprises 57.6% revenue share (2025) Multi-department streaming consolidation
Small and Medium Enterprises 30.3% CAGR (2026–2035) Affordable cloud-managed live data pipeline tools


Large enterprises dominate absolute spending in the Streaming Analytics Market, running hundreds of interconnected event stream analytics topics across divisions. SMEs, previously priced out, now access real-time data processing through serverless tiers costing under USD 0.02 per million events, which explains their outsized growth trajectory [7].


Regional Market Share Analysis

Region Key Metric Primary Investment Themes
North America 31.6% revenue share (2025) Financial-services fraud detection; cloud-native real-time data processing
Europe USD 8.70 billion (2025) GDPR-driven compliance analytics; Industry 4.0 digital twins
Asia-Pacific 30.5% CAGR (2026–2035) 5G optimization; digital payments; smart-city event stream analytics
South America USD 3.05 billion (2025) Fintech growth; agritech continuous data analysis
Middle East & Africa 28.9% CAGR (2026–2035) Smart-city programs; oil-and-gas telemetry
Total USD 35.10 billion (2025)

Five regions shape the Streaming Analytics Market, with each reflecting a distinct combination of infrastructure maturity, regulatory posture, and digital-transformation appetite. North America leads on absolute spend, while Asia-Pacific grows fastest on the back of 5G and public-digital-infrastructure investments.


North America

Country Key Metric Key Driver
United States 72.4% of regional share Hyperscaler HQs; FinTech Apache Kafka analytics adoption
Canada 15.1% of regional share Telecom modernization; healthcare streaming
Mexico USD 1.38 billion (2025) Manufacturing nearshoring; live data pipeline tools for logistics


The United States alone accounts for the lion's share of North American spend, where every major bank now operates a dedicated real-time data processing team for fraud interdiction and algorithmic trading. Canada's Big Five telecoms have earmarked CAD 2.1 billion collectively for 5G-edge analytics over the next three years, and Mexico's factory boom under USMCA is driving demand for industrial event stream analytics [6].

Europe

Country Key Metric Key Driver
Germany 28.6% CAGR Industrie 4.0 digital-twin mandates
United Kingdom USD 1.87 billion (2025) Open-banking continuous data analysis
France 14.8% of regional share AI sovereignty initiatives
Italy 8.5% of regional share Smart-grid telemetry
Spain 27.4% CAGR 5G rollout acceleration
Nordic Countries USD 0.73 billion (2025) Green-energy streaming analytics
Russia 4.2% of regional share Domestic platform substitution
Rest of Europe 27.1% CAGR EU Digital Decade targets


Europe's regulatory density — from GDPR to the EU AI Act — paradoxically stimulates the Streaming Analytics Market by mandating real-time audit trails and explainable-AI logging inside data pipelines. Germany's Industrie 4.0 push requires Apache Kafka analytics at every production node, while the UK's open-banking regime funnels continuous data analysis spending through retail-banking modernization [8] [14].

Asia-Pacific

Country Key Metric Key Driver
China 34.2% of regional share Digital-yuan telemetry; smart-city event stream analytics
India 31.3% CAGR UPI fraud detection; Aadhaar-linked live data pipeline tools
Japan USD 1.46 billion (2025) Connected-vehicle real-time data processing
South Korea 29.8% CAGR Semiconductor-fab IoT streaming
ASEAN 30.9% CAGR E-commerce recommendation engines
Rest of Asia-Pacific USD 0.62 billion (2025) Government digitization programs


Asia-Pacific is the engine room for the Streaming Analytics Market growth. India's Jio Platforms and Reliance Digital together route billions of daily API events through Apache Kafka analytics clusters. At the same time, China's Alibaba Cloud and Tencent Cloud offer managed continuous data analysis services scaled to Singles' Day–grade throughput [17].

South America

Country Key Metric Key Driver
Brazil 58.3% of regional share Pix instant-payments fraud monitoring
Argentina 27.6% CAGR Fintech real-time data processing
Rest of South America USD 0.54 billion (2025) Agritech and mining telemetry


Brazil's Pix payment system — now processing over 4 billion monthly transactions — requires event stream analytics at massive scale to enforce central-bank anti-fraud mandates. Regional cloud-region openings by AWS and Azure in São Paulo and Santiago are lowering latency barriers for live data pipeline tools across the continent [17].

Middle East & Africa

Country Key Metric Key Driver
Saudi Arabia 35.6% of regional share NEOM smart-city continuous data analysis
UAE 29.5% CAGR Dubai AI Campus initiatives
South Africa USD 0.41 billion (2025) Mobile-payments streaming
Egypt 28.7% CAGR E-governance digital transformation
Rest of MEA 27.8% CAGR Oil-and-gas telemetry; telecom expansion


Saudi Arabia's Vision 2030 allocates SAR 6.4 billion to smart-city infrastructure, a significant portion of which funds real-time data processing and event stream analytics platforms for NEOM, The Red Sea, and Jeddah Central projects [19]. The UAE's AI Strategy 2031 positions Dubai as a regional hub for Apache Kafka analytics R&D and continuous data analysis innovation.


Streaming Analytics Market By Region, 2025-2035

Competitive Benchmarking

The Streaming Analytics Market is characterized by low concentration, with an estimated HHI below 800, with the top five vendors representing approximately 28–34% of the global revenue. Most of the commercial options are built on open-source frameworks, mainly Apache Kafka and Apache Flink, resulting in moderate switching costs and a fragmented vendor ecosystem [15].

Company Est. Revenue Share Range Key Offerings for the Streaming Analytics Market Strategic Positioning
Confluent Inc. ~6–9% Confluent Cloud, Confluent Platform (Apache Kafka analytics) Pure-play Kafka leader; data-streaming-as-a-platform
Amazon Web Services ~5–8% Kinesis Data Streams, Managed Streaming for Kafka Hyperscaler bundling: live data pipeline tools integrated with the AWS ecosystem
Microsoft Corporation ~5–7% Azure Stream Analytics, Azure Event Hubs Enterprise IT cross-sell; hybrid-cloud event stream analytics
Google Cloud (Alphabet) ~4–6% Dataflow, Pub/Sub BigQuery integration for continuous data analysis
IBM Corporation ~3–5% IBM Streams (watsonx), Event Automation AI-first positioning; real-time data processing for regulated industries
Oracle Corporation ~3–5% OCI Streaming, GoldenGate Stream Analytics Database-centric customers; ERP integration
SAP SE ~2–4% SAP HANA Streaming Analytics, BTP Event Mesh ERP-adjacent streaming for supply-chain analytics
TIBCO (Cloud Software Group) ~2–4% TIBCO StreamBase, TIBCO Messaging Complex event processing heritage
Informatica ~2–3% Intelligent Data Streaming, CLAIRE AI Engine Data-governance-first streaming orchestration
Striim Inc. ~1–3% Striim Platform, Striim Cloud CDC-to-stream pipeline specialist


Recent News & Developments

  • Confluent (March 2025): Launched Tableflow, enabling Kafka topics to be queried as Iceberg tables — bridging event stream analytics with lakehouse architectures [Ref 5].


  • Google Cloud (2018): Acquired Cask Data to enhance Dataflow's no-code pipeline builder for non-engineering teams exploring live data pipeline tools [Ref 7].


Streaming Analytics Market Report Scope

Parameter Detail
Market Scope Global Streaming Analytics Market covering software, services, cloud, on-premise, five end-user industries, two organization sizes and five regions
Study Period 2021–2035
CAGR (Forecast) 29.5% (2026–2035)
Base-Year Market Size USD 35.10 billion (2025)
Forecast-End Market Size USD 475.20 billion (2035)
Fastest Growing Segment Services (by component); Cloud-Based (by deployment); Media & Entertainment (by end-user)
Companies Profiled Confluent, AWS, Microsoft, Google Cloud, IBM, Oracle, SAP, TIBCO, Informatica, Striim
Valuation Currency USD billion
CAGR Driver Disclaimer Impact percentages in Sections 4–5 are directional estimates, not additive components of the stated CAGR.


FAQs

How should procurement teams evaluate streaming analytics vendors?

Prioritize compatibility with existing Apache Kafka analytics stacks and contractual flexibility on egress pricing. Vendors offering hybrid deployment and transparent SLA guarantees typically deliver lower total cost of ownership [11].

What role does Apache Flink play relative to proprietary platforms in the Streaming Analytics Market?

Apache Flink handles complex event processing with exactly-once semantics, making it a leading open-source option. Proprietary platforms add managed orchestration but increase vendor lock-in risk [15].

Can small manufacturers adopt real-time data processing cost-effectively?

Pay-as-you-go cloud tiers from AWS Kinesis and Azure Stream Analytics let manufacturers begin with a single production-line feed for under USD 500 monthly. Scaling adds incremental cost without upfront capital [7].

How does 5G alter the Streaming Analytics Market deployment model?

5G's ultra-low latency enables real-time data processing at the network edge, reducing round-trip cloud dependency. Telecom operators are embedding event stream analytics directly into base-station firmware [6].

What cybersecurity risks accompany continuous data analysis pipelines?

Continuous data flows expand the attack surface for injection and man-in-the-middle exploits. Encrypted in-transit processing and zero-trust frameworks are becoming baseline requirements for live data pipeline tools [13].

Which certifications matter when deploying event stream analytics in healthcare?

HIPAA, HITRUST, and SOC 2 Type II certifications validate that patient-data streams meet privacy thresholds—vendors lacking these face exclusion from U.S. hospital and telehealth procurement cycles [16].

How does the Streaming Analytics Market compare with traditional BI spending?

Traditional BI budgets still exceed streaming spend roughly two-to-one globally, but continuous data analysis investment is growing three times faster. Analyst projections indicate parity by 2032 [22].    
Author
Author
Author Profile
Apoorva Priyadarshi LinkedIn
Research Analyst
With 4+ years of experience in Market Intelligence and Strategic Research, Apoorv specializes in ICT, Semiconductor, and BFSI markets. Combining strong analytical capabilities with a deep understanding of technology-driven industries, he focuses on delivering data-driven insights that support strategic decision-making. With a background in technology and business research, Apoorv has contributed to numerous global market studies, competitive landscape analyses, and opportunity assessments across sectors such as semiconductors, digital banking, cybersecurity, and telecommunications.
Co-Author
Co-Author Profile
Shubham Munde LinkedIn
Team Lead - Research
Shubham brings over 7 years of expertise in Market Intelligence and Strategic Consulting, with a strong focus on the Automotive, Aerospace, and Defense sectors. Backed by a solid foundation in semiconductors, electronics, and software, he has successfully delivered high-impact syndicated and custom research on a global scale. His core strengths include market sizing, forecasting, competitive intelligence, consumer insights, and supply chain mapping. Widely recognized for developing scalable growth strategies, Shubham empowers clients to navigate complex markets and achieve a lasting competitive edge. Trusted by start-ups and Fortune 500 companies alike, he consistently converts challenges into strategic opportunities that drive sustainable growth.

Research Approach


Secondary Research

The secondary research process involved comprehensive analysis of technology regulatory databases, peer-reviewed computer science journals, IEEE/ACM publications, and authoritative ICT organizations. Key sources included the International Telecommunication Union (ITU), National Institute of Standards and Technology (NIST), IEEE Computer Society Digital Library, Association for Computing Machinery (ACM) Digital Library, Cloud Native Computing Foundation (CNCF), U.S. Federal Communications Commission (FCC), European Data Protection Board (EDPB), European Commission Digital Economy Reports, OECD Digital Economy Outlook, World Economic Forum (WEF) Global Technology Governance reports, U.S. Bureau of Labor Statistics (Tech Employment Data), Eurostat ICT Statistics, Asian Development Bank Digital Economy Reports, national digital transformation agencies, and central bank digital payment statistics.

These sources were employed to gather data sovereignty regulations, real-time processing infrastructure statistics, enterprise digital transformation trends, and market landscape analysis for event stream processing platforms, complex event processing (CEP) engines, IoT streaming analytics, and AI-powered real-time analytics technologies. Also, cloud adoption metrics were collected.


Primary Research

Qualitative and quantitative insights were obtained by interviewing supply-side and demand-side stakeholders during the primary research process. The supply-side sources comprised CEOs, CTOs, VPs of Engineering, directors of Product Management, and chief data officers from cloud service providers, data integration software vendors, managed service providers, and streaming analytics platform providers. The demand-side sources included procurement leads, data architects, digital transformation heads, chief information officers (CIOs), chief data officers (CDOs), IT directors, and chief data officers (CDOs) from BFSI institutions, telecommunications operators, manufacturing enterprises, retail/e-commerce platforms, healthcare systems, and government IT agencies. Market segmentation was validated, product roadmap timelines were confirmed, and insights regarding cloud migration patterns, pricing models (SaaS vs. perpetual licensing), data governance frameworks, and edge computing integration strategies were gathered through primary research.

Primary Respondent Breakdown:

By Designation: C-level Primaries (32%), Director Level (30%), Others (38%)

By Region: North America (33%), Europe (29%), Asia-Pacific (28%), Rest of World (10%)


Market Size Estimation

Revenue mapping and enterprise deployment volume analysis were employed to determine global market valuation. The methodology comprised the following:

Identification of over 50 significant technology vendors in North America, Europe, Asia-Pacific, and Latin America

Product mapping across complex event processing platforms, stream processing engines (Apache Flink, Spark Streaming, Kafka Streams), and real-time analytics and visualization tools

An examination of the annual revenues that have been reported and modeled for streaming analytics portfolios, including software licenses, SaaS subscriptions, and professional/managed services.

In 2024, the coverage of vendors will account for 75-80% of the global market share.

The following methods are employed to derive segment-specific valuations for cloud vs. on-premise deployments, software vs. services components, and industry vertical-specific adoption rates: extrapolation using bottom-up (enterprise deployment volume × ASP by region and deployment mode) and top-down (vendor revenue validation).

Download Free Sample

Kindly complete the form below to receive a free sample of this Report

Download PDF ×

We do not share your information with anyone. However, we may send you emails based on your report interest from time to time. You may contact us at any time to opt-out.