Request Free Sample ×

Kindly complete the form below to receive a free sample of this Report

* Please use a valid business email

Leading companies partner with us for data-driven Insights

clients tt-cursor
Hero Background

Spain High Throughput Screening Market

ID: MRFR/MED/52895-HCR
200 Pages
Vikita Thakur
Last Updated: February 06, 2026

Spain High Throughput Screening Market Research Report: Size, Share, Trend Analysis By Product & Service (Reagents, Assay Kits, Instruments, Consumables, Accessories, Software, Services) and By Technology (Cell-Based Assays, 2D Cell Culture, 3D Cell Culture, Scaffold-Based Technologies, Scaffold-free Technologies, Hanging-drop Plates, Ultra-low Binding Plates, Other Scaffold-free Technologies) - Growth Outlook & Industry Forecast 2025 To 2035

Share:
Download PDF ×

We do not share your information with anyone. However, we may send you emails based on your report interest from time to time. You may contact us at any time to opt-out.

Spain High Throughput Screening Market Infographic
Purchase Options
  1. 1 SECTION I: EXECUTIVE SUMMARY AND KEY HIGHLIGHTS
    1. 1.1 EXECUTIVE SUMMARY
      1. 1.1.1 Market Overview
      2. 1.1.2 Key Findings
      3. 1.1.3 Market Segmentation
      4. 1.1.4 Competitive Landscape
      5. 1.1.5 Challenges and Opportunities
      6. 1.1.6 Future Outlook
  2. 2 SECTION II: SCOPING, METHODOLOGY AND MARKET STRUCTURE
    1. 2.1 MARKET INTRODUCTION
      1. 2.1.1 Definition
      2. 2.1.2 Scope of the study
        1. 2.1.2.1 Research Objective
        2. 2.1.2.2 Assumption
        3. 2.1.2.3 Limitations
    2. 2.2 RESEARCH METHODOLOGY
      1. 2.2.1 Overview
      2. 2.2.2 Data Mining
      3. 2.2.3 Secondary Research
      4. 2.2.4 Primary Research
        1. 2.2.4.1 Primary Interviews and Information Gathering Process
        2. 2.2.4.2 Breakdown of Primary Respondents
      5. 2.2.5 Forecasting Model
      6. 2.2.6 Market Size Estimation
        1. 2.2.6.1 Bottom-Up Approach
        2. 2.2.6.2 Top-Down Approach
      7. 2.2.7 Data Triangulation
      8. 2.2.8 Validation
  3. 3 SECTION III: QUALITATIVE ANALYSIS
    1. 3.1 MARKET DYNAMICS
      1. 3.1.1 Overview
      2. 3.1.2 Drivers
      3. 3.1.3 Restraints
      4. 3.1.4 Opportunities
    2. 3.2 MARKET FACTOR ANALYSIS
      1. 3.2.1 Value chain Analysis
      2. 3.2.2 Porter's Five Forces Analysis
        1. 3.2.2.1 Bargaining Power of Suppliers
        2. 3.2.2.2 Bargaining Power of Buyers
        3. 3.2.2.3 Threat of New Entrants
        4. 3.2.2.4 Threat of Substitutes
        5. 3.2.2.5 Intensity of Rivalry
      3. 3.2.3 COVID-19 Impact Analysis
        1. 3.2.3.1 Market Impact Analysis
        2. 3.2.3.2 Regional Impact
        3. 3.2.3.3 Opportunity and Threat Analysis
  4. 4 SECTION IV: QUANTITATIVE ANALYSIS
    1. 4.1 Construction, BY Product & Services (USD Million)
      1. 4.1.1 Consumables
      2. 4.1.2 Instruments
      3. 4.1.3 Software & Services
    2. 4.2 Construction, BY Technology (USD Million)
      1. 4.2.1 Cell-Based Assays
      2. 4.2.2 Lab-on-a-Chip (LOC)
      3. 4.2.3 Ultra-High-Throughput Screening
      4. 4.2.4 Label-Free Technology
      5. 4.2.5 Others
    3. 4.3 Construction, BY Application (USD Million)
      1. 4.3.1 Drug Discovery
      2. 4.3.2 Biochemical Screening
      3. 4.3.3 Cell & Organ-Based Screening
      4. 4.3.4 Others
    4. 4.4 Construction, BY End User (USD Million)
      1. 4.4.1 Pharmaceutical and Biotechnology Companies
      2. 4.4.2 Research Institutes and Organizations
      3. 4.4.3 Contract Research Organizations
  5. 5 SECTION V: COMPETITIVE ANALYSIS
    1. 5.1 Competitive Landscape
      1. 5.1.1 Overview
      2. 5.1.2 Competitive Analysis
      3. 5.1.3 Market share Analysis
      4. 5.1.4 Major Growth Strategy in the Construction
      5. 5.1.5 Competitive Benchmarking
      6. 5.1.6 Leading Players in Terms of Number of Developments in the Construction
      7. 5.1.7 Key developments and growth strategies
        1. 5.1.7.1 New Product Launch/Service Deployment
        2. 5.1.7.2 Merger & Acquisitions
        3. 5.1.7.3 Joint Ventures
      8. 5.1.8 Major Players Financial Matrix
        1. 5.1.8.1 Sales and Operating Income
        2. 5.1.8.2 Major Players R&D Expenditure. 2023
    2. 5.2 Company Profiles
      1. 5.2.1 Thermo Fisher Scientific (US)
        1. 5.2.1.1 Financial Overview
        2. 5.2.1.2 Products Offered
        3. 5.2.1.3 Key Developments
        4. 5.2.1.4 SWOT Analysis
        5. 5.2.1.5 Key Strategies
      2. 5.2.2 Agilent Technologies (US)
        1. 5.2.2.1 Financial Overview
        2. 5.2.2.2 Products Offered
        3. 5.2.2.3 Key Developments
        4. 5.2.2.4 SWOT Analysis
        5. 5.2.2.5 Key Strategies
      3. 5.2.3 PerkinElmer (US)
        1. 5.2.3.1 Financial Overview
        2. 5.2.3.2 Products Offered
        3. 5.2.3.3 Key Developments
        4. 5.2.3.4 SWOT Analysis
        5. 5.2.3.5 Key Strategies
      4. 5.2.4 Becton Dickinson (US)
        1. 5.2.4.1 Financial Overview
        2. 5.2.4.2 Products Offered
        3. 5.2.4.3 Key Developments
        4. 5.2.4.4 SWOT Analysis
        5. 5.2.4.5 Key Strategies
      5. 5.2.5 Merck KGaA (DE)
        1. 5.2.5.1 Financial Overview
        2. 5.2.5.2 Products Offered
        3. 5.2.5.3 Key Developments
        4. 5.2.5.4 SWOT Analysis
        5. 5.2.5.5 Key Strategies
      6. 5.2.6 Tecan Group (CH)
        1. 5.2.6.1 Financial Overview
        2. 5.2.6.2 Products Offered
        3. 5.2.6.3 Key Developments
        4. 5.2.6.4 SWOT Analysis
        5. 5.2.6.5 Key Strategies
      7. 5.2.7 Sartorius AG (DE)
        1. 5.2.7.1 Financial Overview
        2. 5.2.7.2 Products Offered
        3. 5.2.7.3 Key Developments
        4. 5.2.7.4 SWOT Analysis
        5. 5.2.7.5 Key Strategies
      8. 5.2.8 Corning Incorporated (US)
        1. 5.2.8.1 Financial Overview
        2. 5.2.8.2 Products Offered
        3. 5.2.8.3 Key Developments
        4. 5.2.8.4 SWOT Analysis
        5. 5.2.8.5 Key Strategies
      9. 5.2.9 Bio-Rad Laboratories (US)
        1. 5.2.9.1 Financial Overview
        2. 5.2.9.2 Products Offered
        3. 5.2.9.3 Key Developments
        4. 5.2.9.4 SWOT Analysis
        5. 5.2.9.5 Key Strategies
    3. 5.3 Appendix
      1. 5.3.1 References
      2. 5.3.2 Related Reports
  6. 6 LIST OF FIGURES
    1. 6.1 MARKET SYNOPSIS
    2. 6.2 SPAIN MARKET ANALYSIS BY PRODUCT & SERVICES
    3. 6.3 SPAIN MARKET ANALYSIS BY TECHNOLOGY
    4. 6.4 SPAIN MARKET ANALYSIS BY APPLICATION
    5. 6.5 SPAIN MARKET ANALYSIS BY END USER
    6. 6.6 KEY BUYING CRITERIA OF CONSTRUCTION
    7. 6.7 RESEARCH PROCESS OF MRFR
    8. 6.8 DRO ANALYSIS OF CONSTRUCTION
    9. 6.9 DRIVERS IMPACT ANALYSIS: CONSTRUCTION
    10. 6.10 RESTRAINTS IMPACT ANALYSIS: CONSTRUCTION
    11. 6.11 SUPPLY / VALUE CHAIN: CONSTRUCTION
    12. 6.12 CONSTRUCTION, BY PRODUCT & SERVICES, 2024 (% SHARE)
    13. 6.13 CONSTRUCTION, BY PRODUCT & SERVICES, 2024 TO 2035 (USD Million)
    14. 6.14 CONSTRUCTION, BY TECHNOLOGY, 2024 (% SHARE)
    15. 6.15 CONSTRUCTION, BY TECHNOLOGY, 2024 TO 2035 (USD Million)
    16. 6.16 CONSTRUCTION, BY APPLICATION, 2024 (% SHARE)
    17. 6.17 CONSTRUCTION, BY APPLICATION, 2024 TO 2035 (USD Million)
    18. 6.18 CONSTRUCTION, BY END USER, 2024 (% SHARE)
    19. 6.19 CONSTRUCTION, BY END USER, 2024 TO 2035 (USD Million)
    20. 6.20 BENCHMARKING OF MAJOR COMPETITORS
  7. 7 LIST OF TABLES
    1. 7.1 LIST OF ASSUMPTIONS
  8. 7.1.1
    1. 7.2 Spain MARKET SIZE ESTIMATES; FORECAST
      1. 7.2.1 BY PRODUCT & SERVICES, 2025-2035 (USD Million)
      2. 7.2.2 BY TECHNOLOGY, 2025-2035 (USD Million)
      3. 7.2.3 BY APPLICATION, 2025-2035 (USD Million)
      4. 7.2.4 BY END USER, 2025-2035 (USD Million)
    2. 7.3 PRODUCT LAUNCH/PRODUCT DEVELOPMENT/APPROVAL
  9. 7.3.1
    1. 7.4 ACQUISITION/PARTNERSHIP
  10. 7.4.1

Spain Construction Market Segmentation

Construction By Product & Services (USD Million, 2025-2035)
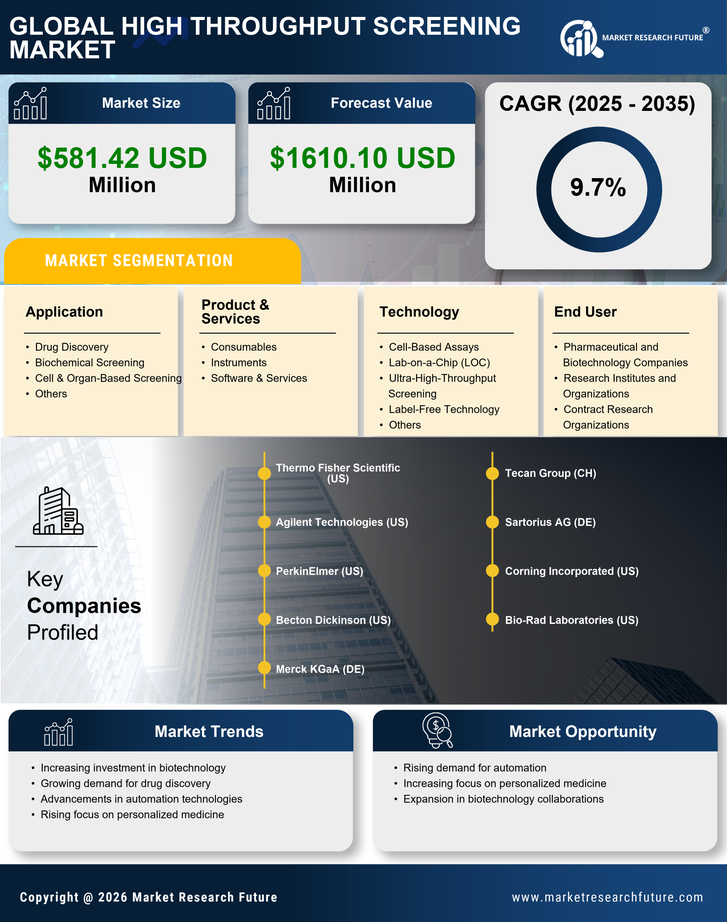
  • Consumables
  • Instruments
  • Software & Services

Construction By Technology (USD Million, 2025-2035)

  • Cell-Based Assays
  • Lab-on-a-Chip (LOC)
  • Ultra-High-Throughput Screening
  • Label-Free Technology
  • Others

Construction By Application (USD Million, 2025-2035)

  • Drug Discovery
  • Biochemical Screening
  • Cell & Organ-Based Screening
  • Others

Construction By End User (USD Million, 2025-2035)

  • Pharmaceutical and Biotechnology Companies
  • Research Institutes and Organizations
  • Contract Research Organizations

Compare Licence

×
Features License Type
Single User Multiuser License Enterprise User
Price $4,950 $5,950 $7,250
Maximum User Access Limit 1 User Upto 10 Users Unrestricted Access Throughout the Organization
Free Customization
Direct Access to Analyst
Deliverable Format
Platform Access
Discount on Next Purchase 10% 15% 15%
Printable Versions