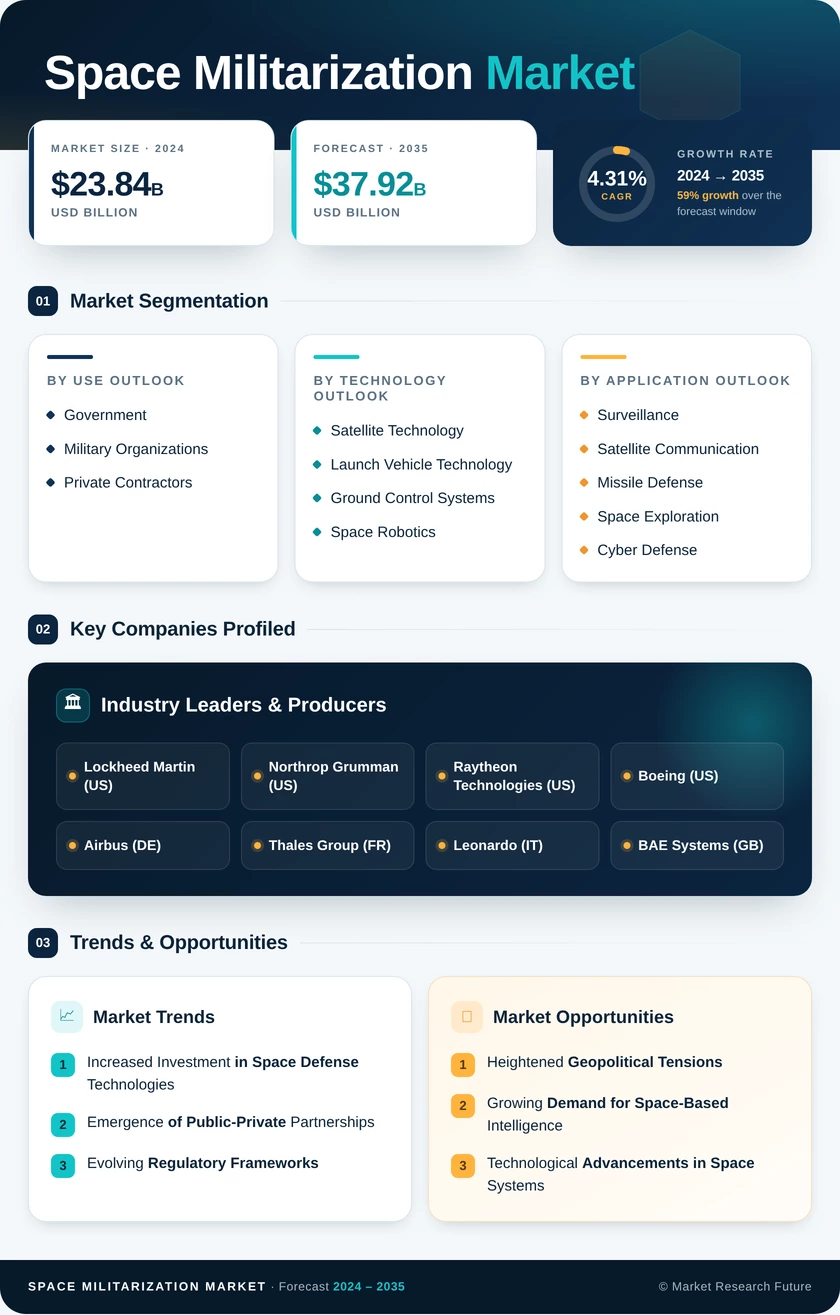
Space Militarization Market (2026 - 2035)

ID: MRFR/AD/31269-HCR 100 Pages Triveni Bhoyar Last Updated: October 19, 2026
Space Militarization Market Size, Share, Industry Trend & Analysis Research Report: By Capability (Defense, Support), By Region (North America, Europe, Asia-Pacific, South America, Middle East & Africa) - Forecast to 2035.
Space Militarization Market
Market Size
Forecast Period2026-2035
CAGR (2026-2035)7.5%
2025 Market SizeUSD 55.4 Billion
2035 Market SizeUSD 114.2 Billion
Key Players
Lockheed Martin Corporation
Northrop Grumman Corporation
RTX Corporation
L3Harris Technologies, Inc.
Space Exploration Technologies Corp.
Airbus SE
Opportunities
  • Tactically Responsive Space
  • Sovereign Capability in Emerging Markets
  • Data Monetization and Space-as-a-Service
  1. 1 Market Summary | |
  2. 2 Key Report Takeaways | |
    1. 2.1 By Capability | |
    2. 2.2 By Region | |
  3. 3 Market Size and Forecast (2021–2035) | |
    1. 3.1 Historical Market Size (2021–2024) | |
    2. 3.2 Base Year and Forecast Market Size (2025–2035) | |
    3. 3.3 Year-over-Year Growth Analysis | |
  4. 4 Driver Impact Analysis | |
    1. 4.1 Rising Defense Budgets and Great-Power Competition | |
    2. 4.2 Homeland Missile-Defense Modernization | |
    3. 4.3 Proliferated LEO Architectures | |
    4. 4.4 Counterspace Threat Proliferation | |
    5. 4.5 European Rearmament | |
    6. 4.6 Asia-Pacific Sovereign Programs | |
    7. 4.7 Commercial Integration and Falling Launch Costs | |
  5. 5 Restraints Impact Analysis | |
    1. 5.1 Program Cost Overruns and Schedule Slips | |
    2. 5.2 Orbital Debris and Congestion | |
    3. 5.3 Arms Control Pressure and Norms | |
    4. 5.4 Export Controls and Technology Restrictions | |
    5. 5.5 Supply Chain and Industrial Capacity Limits | |
  6. 6 Opportunities | |
    1. 6.1 Tactically Responsive Space | |
    2. 6.2 Sovereign Capability in Emerging Markets | |
    3. 6.3 Data Monetization and Space-as-a-Service | |
    4. 6.4 Space Domain Awareness | |
    5. 6.5 On-Orbit Servicing and Dynamic Maneuver | |
  7. 7 Regional Market Share and Country-Level Analysis | |
    1. 7.1 North America | | |
      1. 7.1.1 United States | | |
      2. 7.1.2 Canada | | |
      3. 7.1.3 Mexico | |
    2. 7.2 Europe | | |
      1. 7.2.1 Germany | | |
      2. 7.2.2 United Kingdom | | |
      3. 7.2.3 France | | |
      4. 7.2.4 Italy | | |
      5. 7.2.5 Spain | | |
      6. 7.2.6 Nordic Countries | | |
      7. 7.2.7 Russia | | |
      8. 7.2.8 Rest of Europe | |
    3. 7.3 Asia-Pacific | | |
      1. 7.3.1 China | | |
      2. 7.3.2 India | | |
      3. 7.3.3 Japan | | |
      4. 7.3.4 South Korea | | |
      5. 7.3.5 ASEAN | | |
      6. 7.3.6 Rest of Asia-Pacific | |
    4. 7.4 South America | | |
      1. 7.4.1 Brazil | | |
      2. 7.4.2 Argentina | | |
      3. 7.4.3 Rest of South America | |
    5. 7.5 Middle East & Africa | | |
      1. 7.5.1 Saudi Arabia | | |
      2. 7.5.2 UAE | | |
      3. 7.5.3 South Africa | | |
      4. 7.5.4 Egypt | | |
      5. 7.5.5 Rest of Middle East & Africa | |
  8. 8 Future Outlook (2026–2035) | |
    1. 8.1 AI-Enabled Command and Autonomous Operations | |
    2. 8.2 Production Economics at Scale | |
    3. 8.3 Homeland Missile-Defense Supercycle | |
    4. 8.4 Sustainability, Norms and Debris Governance | |
  9. 9 Segmentation Analysis | |
    1. 9.1 By Capability | | |
      1. 9.1.1 Defense | | |
      2. 9.1.2 Support | |
    2. 9.2 Mode of Operation | | |
      1. 9.2.1 Space-based | | |
      2. 9.2.2 Ground-based | |
  10. 10 Competitive Landscape | |
    1. 10.1 Market Concentration Analysis | |
    2. 10.2 Competitive Benchmarking Matrix | |
    3. 10.3 Company Profiles | | |
      1. 10.3.1 Lockheed Martin Corporation | | |
      2. 10.3.2 Northrop Grumman Corporation | | |
      3. 10.3.3 RTX Corporation | | |
      4. 10.3.4 The Boeing Company | | |
      5. 10.3.5 L3Harris Technologies, Inc. | | |
      6. 10.3.6 Space Exploration Technologies Corp. | | |
      7. 10.3.7 Airbus SE | | |
      8. 10.3.8 Thales Group | | |
      9. 10.3.9 BAE Systems plc | | |
      10. 10.3.10 General Dynamics Corporation | | |
      11. 10.3.11 Israel Aerospace Industries | |
  11. 11 Recent News & Developments | |
  12. 12 Report Scope and Methodology | |
  13. 13 Detailed Sources and Citations | |
  14. 14 Frequently Asked Questions (FAQs) | | LIST OF TABLES | |
  15. TABLE 1 Market Snapshot, 2025 and 2035 | |
  16. TABLE 2 Global Market Size & Forecast, by Revenue (USD Billion), 2021–2035 | |
  17. TABLE 3 Driver Impact Analysis, 2026–2035 | |
  18. TABLE 4 Restraints Impact Analysis, 2026–2035 | |
  19. TABLE 5 Regional Market Summary, 2025 | |
  20. TABLE 6 North America Market, by Country, 2025 | |
  21. TABLE 7 Europe Market, by Country, 2025 | |
  22. TABLE 8 Asia-Pacific Market, by Country, 2025 | |
  23. TABLE 9 South America Market, by Country, 2025 | |
  24. TABLE 10 Middle East & Africa Market, by Country, 2025 | |
  25. TABLE 11 Global Market, by Capability, 2025 | |
  26. TABLE 12 Competitive Benchmarking Matrix, 2025 | |
  27. TABLE 13 Report Scope and Methodology | |
  28. TABLE 14 Detailed Sources and Citations | |
  29. TABLE 15 Segmentation Quick Reference | |
  30. TABLE 16 Market Segmentation Overview, by Capability | | LIST OF FIGURES | |
  31. FIGURE 1 Market Dynamics Overview (Drivers, Restraints, Opportunities) | |
  32. FIGURE 2 Industry Value Chain Analysis | |
  33. FIGURE 3 Porter's Five Forces Analysis | |
  34. FIGURE 4 Global Market Size Trend, 2021–2035 (USD Billion) | |
  35. FIGURE 5 Market Share, by Capability, 2025 | |
  36. FIGURE 6 Regional Market Share, 2025 | |
  37. FIGURE 7 Asia-Pacific Country Growth Comparison, 2026–2035 | |
  38. FIGURE 8 Competitive Landscape Positioning, 2025

Segmentation Quick Reference

DimensionSub-SegmentsDominant SegmentFastest Growing Segment
By CapabilityDefense, SupportDefense (58.4% share)Support (8.1% CAGR)
By RegionNorth America, Europe, Asia-Pacific, South America, Middle East & AfricaNorth America (47.5% share)Asia-Pacific (9.4% CAGR)

Market Segmentation Overview

By Capability

Sub-SegmentKey Trend
DefenseShift from ground-based interceptors toward space-based tracking and interception layers
SupportMigration from exquisite GEO assets to proliferated LEO SATCOM, ISR, and PNT constellations

Defense leads with a 58.4% share because missile-defense tracking, interceptor development, and spacecraft protection carry the largest single program budgets, headlined by Golden Dome. Support is the faster-growing sub-segment at an 8.1% CAGR as SDA transport tranches, commercial ISR purchases, and resilient PNT augmentations replace a small number of legacy geostationary spacecraft with hundreds of lower-cost LEO nodes. Over the decade, the gap narrows because support constellations become the data backbone on which every defense capability depends.


Download PDF ×

We do not share your information with anyone. However, we may send you emails based on your report interest from time to time. You may contact us at any time to opt-out.