Request Free Sample ×

Kindly complete the form below to receive a free sample of this Report

* Please use a valid business email

Leading companies partner with us for data-driven Insights

clients tt-cursor
Hero Background

South America Generic Injectables Market

ID: MRFR/LS/48945-HCR
200 Pages
Rahul Gotadki
Last Updated: April 06, 2026

South America Generic Injectables Market Research Report By Formulation Type (Solution, Suspension, Emulsion, Lyophilized), By Route of Administration (Intravenous, Intramuscular, Subcutaneous, Intradermal), By Therapeutic Area (Oncology, Cardiovascular, Infectious Diseases, Hormonal Disorders), By Packaging Type (Vials, Ampoules, Pre-filled Syringes, Bags) and By Regional (Brazil, Mexico, Argentina, Rest of South America) - Growth & Industry Forecast 2025 To 2035

Share:
Download PDF ×

We do not share your information with anyone. However, we may send you emails based on your report interest from time to time. You may contact us at any time to opt-out.

  1. 1 SECTION I: EXECUTIVE SUMMARY AND KEY HIGHLIGHTS
    1. 1.1 EXECUTIVE SUMMARY
      1. 1.1.1 Market Overview
      2. 1.1.2 Key Findings
      3. 1.1.3 Market Segmentation
      4. 1.1.4 Competitive Landscape
      5. 1.1.5 Challenges and Opportunities
      6. 1.1.6 Future Outlook
  2. 2 SECTION II: SCOPING, METHODOLOGY AND MARKET STRUCTURE
    1. 2.1 MARKET INTRODUCTION
      1. 2.1.1 Definition
      2. 2.1.2 Scope of the study
        1. 2.1.2.1 Research Objective
        2. 2.1.2.2 Assumption
        3. 2.1.2.3 Limitations
    2. 2.2 RESEARCH METHODOLOGY
      1. 2.2.1 Overview
      2. 2.2.2 Data Mining
      3. 2.2.3 Secondary Research
      4. 2.2.4 Primary Research
        1. 2.2.4.1 Primary Interviews and Information Gathering Process
        2. 2.2.4.2 Breakdown of Primary Respondents
      5. 2.2.5 Forecasting Model
      6. 2.2.6 Market Size Estimation
        1. 2.2.6.1 Bottom-Up Approach
        2. 2.2.6.2 Top-Down Approach
      7. 2.2.7 Data Triangulation
      8. 2.2.8 Validation
  3. 3 SECTION III: QUALITATIVE ANALYSIS
    1. 3.1 MARKET DYNAMICS
      1. 3.1.1 Overview
      2. 3.1.2 Drivers
      3. 3.1.3 Restraints
      4. 3.1.4 Opportunities
    2. 3.2 MARKET FACTOR ANALYSIS
      1. 3.2.1 Value chain Analysis
      2. 3.2.2 Porter's Five Forces Analysis
        1. 3.2.2.1 Bargaining Power of Suppliers
        2. 3.2.2.2 Bargaining Power of Buyers
        3. 3.2.2.3 Threat of New Entrants
        4. 3.2.2.4 Threat of Substitutes
        5. 3.2.2.5 Intensity of Rivalry
      3. 3.2.3 COVID-19 Impact Analysis
        1. 3.2.3.1 Market Impact Analysis
        2. 3.2.3.2 Regional Impact
        3. 3.2.3.3 Opportunity and Threat Analysis
  4. 4 SECTION IV: QUANTITATIVE ANALYSIS
    1. 4.1 Food, Beverages & Nutrition, BY Formulation Type (USD Million)
      1. 4.1.1 Solution
      2. 4.1.2 Suspension
      3. 4.1.3 Emulsion
      4. 4.1.4 Lyophilized
    2. 4.2 Food, Beverages & Nutrition, BY Route of Administration (USD Million)
      1. 4.2.1 Intravenous
      2. 4.2.2 Intramuscular
      3. 4.2.3 Subcutaneous
      4. 4.2.4 Intradermal
    3. 4.3 Food, Beverages & Nutrition, BY Therapeutic Area (USD Million)
      1. 4.3.1 Oncology
      2. 4.3.2 Cardiovascular
      3. 4.3.3 Infectious Diseases
      4. 4.3.4 Hormonal Disorders
    4. 4.4 Food, Beverages & Nutrition, BY Packaging Type (USD Million)
      1. 4.4.1 Vials
      2. 4.4.2 Ampoules
      3. 4.4.3 Pre-filled Syringes
      4. 4.4.4 Bags
  5. 5 SECTION V: COMPETITIVE ANALYSIS
    1. 5.1 Competitive Landscape
      1. 5.1.1 Overview
      2. 5.1.2 Competitive Analysis
      3. 5.1.3 Market share Analysis
      4. 5.1.4 Major Growth Strategy in the Food, Beverages & Nutrition
      5. 5.1.5 Competitive Benchmarking
      6. 5.1.6 Leading Players in Terms of Number of Developments in the Food, Beverages & Nutrition
      7. 5.1.7 Key developments and growth strategies
        1. 5.1.7.1 New Product Launch/Service Deployment
        2. 5.1.7.2 Merger & Acquisitions
        3. 5.1.7.3 Joint Ventures
      8. 5.1.8 Major Players Financial Matrix
        1. 5.1.8.1 Sales and Operating Income
        2. 5.1.8.2 Major Players R&D Expenditure. 2023
    2. 5.2 Company Profiles
      1. 5.2.1 Teva Pharmaceutical Industries Ltd (IL)
        1. 5.2.1.1 Financial Overview
        2. 5.2.1.2 Products Offered
        3. 5.2.1.3 Key Developments
        4. 5.2.1.4 SWOT Analysis
        5. 5.2.1.5 Key Strategies
      2. 5.2.2 Sandoz International GmbH (AT)
        1. 5.2.2.1 Financial Overview
        2. 5.2.2.2 Products Offered
        3. 5.2.2.3 Key Developments
        4. 5.2.2.4 SWOT Analysis
        5. 5.2.2.5 Key Strategies
      3. 5.2.3 Mylan N.V. (US)
        1. 5.2.3.1 Financial Overview
        2. 5.2.3.2 Products Offered
        3. 5.2.3.3 Key Developments
        4. 5.2.3.4 SWOT Analysis
        5. 5.2.3.5 Key Strategies
      4. 5.2.4 Fresenius Kabi AG (DE)
        1. 5.2.4.1 Financial Overview
        2. 5.2.4.2 Products Offered
        3. 5.2.4.3 Key Developments
        4. 5.2.4.4 SWOT Analysis
        5. 5.2.4.5 Key Strategies
      5. 5.2.5 Baxter International Inc (US)
        1. 5.2.5.1 Financial Overview
        2. 5.2.5.2 Products Offered
        3. 5.2.5.3 Key Developments
        4. 5.2.5.4 SWOT Analysis
        5. 5.2.5.5 Key Strategies
      6. 5.2.6 Amgen Inc (US)
        1. 5.2.6.1 Financial Overview
        2. 5.2.6.2 Products Offered
        3. 5.2.6.3 Key Developments
        4. 5.2.6.4 SWOT Analysis
        5. 5.2.6.5 Key Strategies
      7. 5.2.7 Hospira Inc (US)
        1. 5.2.7.1 Financial Overview
        2. 5.2.7.2 Products Offered
        3. 5.2.7.3 Key Developments
        4. 5.2.7.4 SWOT Analysis
        5. 5.2.7.5 Key Strategies
      8. 5.2.8 Zydus Cadila (IN)
        1. 5.2.8.1 Financial Overview
        2. 5.2.8.2 Products Offered
        3. 5.2.8.3 Key Developments
        4. 5.2.8.4 SWOT Analysis
        5. 5.2.8.5 Key Strategies
    3. 5.3 Appendix
      1. 5.3.1 References
      2. 5.3.2 Related Reports
  6. 6 LIST OF FIGURES
    1. 6.1 MARKET SYNOPSIS
    2. 6.2 SOUTH AMERICA MARKET ANALYSIS BY FORMULATION TYPE
    3. 6.3 SOUTH AMERICA MARKET ANALYSIS BY ROUTE OF ADMINISTRATION
    4. 6.4 SOUTH AMERICA MARKET ANALYSIS BY THERAPEUTIC AREA
    5. 6.5 SOUTH AMERICA MARKET ANALYSIS BY PACKAGING TYPE
    6. 6.6 KEY BUYING CRITERIA OF FOOD, BEVERAGES & NUTRITION
    7. 6.7 RESEARCH PROCESS OF MRFR
    8. 6.8 DRO ANALYSIS OF FOOD, BEVERAGES & NUTRITION
    9. 6.9 DRIVERS IMPACT ANALYSIS: FOOD, BEVERAGES & NUTRITION
    10. 6.10 RESTRAINTS IMPACT ANALYSIS: FOOD, BEVERAGES & NUTRITION
    11. 6.11 SUPPLY / VALUE CHAIN: FOOD, BEVERAGES & NUTRITION
    12. 6.12 FOOD, BEVERAGES & NUTRITION, BY FORMULATION TYPE, 2024 (% SHARE)
    13. 6.13 FOOD, BEVERAGES & NUTRITION, BY FORMULATION TYPE, 2024 TO 2035 (USD Million)
    14. 6.14 FOOD, BEVERAGES & NUTRITION, BY ROUTE OF ADMINISTRATION, 2024 (% SHARE)
    15. 6.15 FOOD, BEVERAGES & NUTRITION, BY ROUTE OF ADMINISTRATION, 2024 TO 2035 (USD Million)
    16. 6.16 FOOD, BEVERAGES & NUTRITION, BY THERAPEUTIC AREA, 2024 (% SHARE)
    17. 6.17 FOOD, BEVERAGES & NUTRITION, BY THERAPEUTIC AREA, 2024 TO 2035 (USD Million)
    18. 6.18 FOOD, BEVERAGES & NUTRITION, BY PACKAGING TYPE, 2024 (% SHARE)
    19. 6.19 FOOD, BEVERAGES & NUTRITION, BY PACKAGING TYPE, 2024 TO 2035 (USD Million)
    20. 6.20 BENCHMARKING OF MAJOR COMPETITORS
  7. 7 LIST OF TABLES
    1. 7.1 LIST OF ASSUMPTIONS
  8. 7.1.1
    1. 7.2 South America MARKET SIZE ESTIMATES; FORECAST
      1. 7.2.1 BY FORMULATION TYPE, 2025-2035 (USD Million)
      2. 7.2.2 BY ROUTE OF ADMINISTRATION, 2025-2035 (USD Million)
      3. 7.2.3 BY THERAPEUTIC AREA, 2025-2035 (USD Million)
      4. 7.2.4 BY PACKAGING TYPE, 2025-2035 (USD Million)
    2. 7.3 PRODUCT LAUNCH/PRODUCT DEVELOPMENT/APPROVAL
  9. 7.3.1
    1. 7.4 ACQUISITION/PARTNERSHIP
  10. 7.4.1

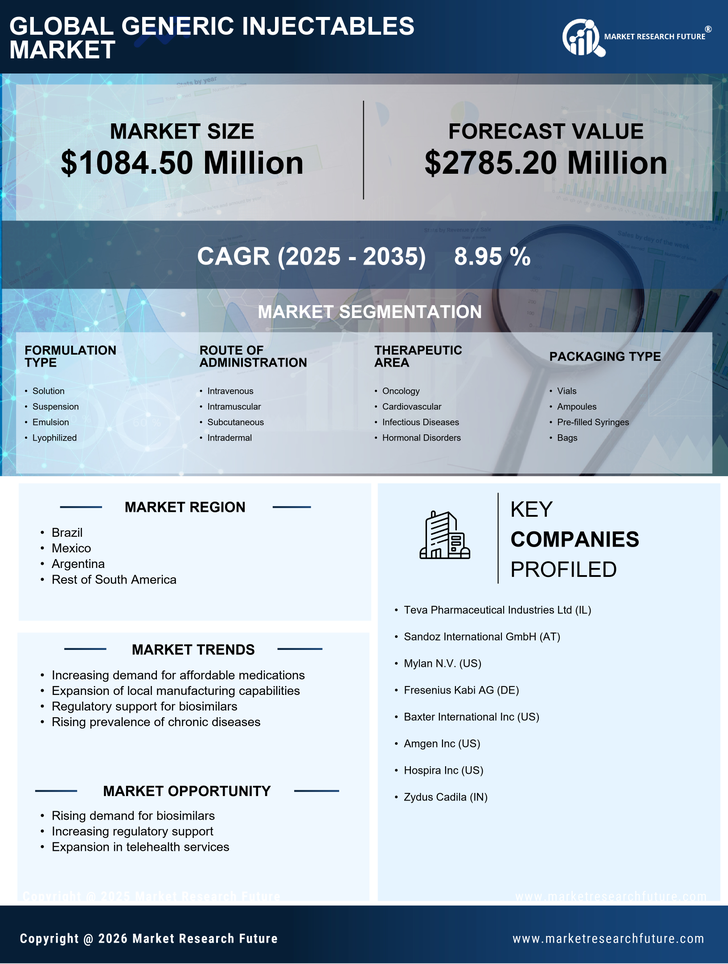
South America Food, Beverages & Nutrition Market Segmentation

Food, Beverages & Nutrition By Formulation Type (USD Million, 2025-2035)

  • Solution
  • Suspension
  • Emulsion
  • Lyophilized

Food, Beverages & Nutrition By Route of Administration (USD Million, 2025-2035)

  • Intravenous
  • Intramuscular
  • Subcutaneous
  • Intradermal

Food, Beverages & Nutrition By Therapeutic Area (USD Million, 2025-2035)

  • Oncology
  • Cardiovascular
  • Infectious Diseases
  • Hormonal Disorders

Food, Beverages & Nutrition By Packaging Type (USD Million, 2025-2035)

  • Vials
  • Ampoules
  • Pre-filled Syringes
  • Bags

Compare Licence

×
Features License Type
Single User Multiuser License Enterprise User
Price $4,950 $5,950 $7,250
Maximum User Access Limit 1 User Upto 10 Users Unrestricted Access Throughout the Organization
Free Customization
Direct Access to Analyst
Deliverable Format
Platform Access
Discount on Next Purchase 10% 15% 15%
Printable Versions