Request Free Sample ×

Kindly complete the form below to receive a free sample of this Report

* Please use a valid business email

Leading companies partner with us for data-driven Insights

clients tt-cursor
Hero Background

South America Facial Rejuvenation Market

ID: MRFR/HC/49500-HCR
200 Pages
Satyendra Maurya
Last Updated: February 06, 2026

South America Facial Rejuvenation Market Research Report By Treatment Type (Surgical Procedures, Non-Surgical Procedures, Injectables, Laser Treatments), By Procedure Category (Facelift, Botox Injections, Dermal Fillers, Chemical Peels), By Skin Type (Aging Skin, Dry Skin, Oily Skin, Combination Skin), By Target Group (Men, Women, Aging Population) and By Regional (Brazil, Mexico, Argentina, Rest of South America) - Growth & Industry Forecast 2025 To 2035

Share:
Download PDF ×

We do not share your information with anyone. However, we may send you emails based on your report interest from time to time. You may contact us at any time to opt-out.

South America Facial Rejuvenation Market Infographic
Purchase Options
  1. 1 SECTION I: EXECUTIVE SUMMARY AND KEY HIGHLIGHTS
    1. 1.1 EXECUTIVE SUMMARY
      1. 1.1.1 Market Overview
      2. 1.1.2 Key Findings
      3. 1.1.3 Market Segmentation
      4. 1.1.4 Competitive Landscape
      5. 1.1.5 Challenges and Opportunities
      6. 1.1.6 Future Outlook
  2. 2 SECTION II: SCOPING, METHODOLOGY AND MARKET STRUCTURE
    1. 2.1 MARKET INTRODUCTION
      1. 2.1.1 Definition
      2. 2.1.2 Scope of the study
        1. 2.1.2.1 Research Objective
        2. 2.1.2.2 Assumption
        3. 2.1.2.3 Limitations
    2. 2.2 RESEARCH METHODOLOGY
      1. 2.2.1 Overview
      2. 2.2.2 Data Mining
      3. 2.2.3 Secondary Research
      4. 2.2.4 Primary Research
        1. 2.2.4.1 Primary Interviews and Information Gathering Process
        2. 2.2.4.2 Breakdown of Primary Respondents
      5. 2.2.5 Forecasting Model
      6. 2.2.6 Market Size Estimation
        1. 2.2.6.1 Bottom-Up Approach
        2. 2.2.6.2 Top-Down Approach
      7. 2.2.7 Data Triangulation
      8. 2.2.8 Validation
  3. 3 SECTION III: QUALITATIVE ANALYSIS
    1. 3.1 MARKET DYNAMICS
      1. 3.1.1 Overview
      2. 3.1.2 Drivers
      3. 3.1.3 Restraints
      4. 3.1.4 Opportunities
    2. 3.2 MARKET FACTOR ANALYSIS
      1. 3.2.1 Value chain Analysis
      2. 3.2.2 Porter's Five Forces Analysis
        1. 3.2.2.1 Bargaining Power of Suppliers
        2. 3.2.2.2 Bargaining Power of Buyers
        3. 3.2.2.3 Threat of New Entrants
        4. 3.2.2.4 Threat of Substitutes
        5. 3.2.2.5 Intensity of Rivalry
      3. 3.2.3 COVID-19 Impact Analysis
        1. 3.2.3.1 Market Impact Analysis
        2. 3.2.3.2 Regional Impact
        3. 3.2.3.3 Opportunity and Threat Analysis
  4. 4 SECTION IV: QUANTITATIVE ANALYSIS
    1. 4.1 Chemicals and Materials, BY Treatment Type (USD Million)
      1. 4.1.1 Surgical Procedures
      2. 4.1.2 Non-Surgical Procedures
      3. 4.1.3 Injectables
      4. 4.1.4 Laser Treatments
    2. 4.2 Chemicals and Materials, BY Procedure Category (USD Million)
      1. 4.2.1 Facelift
      2. 4.2.2 Botox Injections
      3. 4.2.3 Dermal Fillers
      4. 4.2.4 Chemical Peels
    3. 4.3 Chemicals and Materials, BY Skin Type (USD Million)
      1. 4.3.1 Aging Skin
      2. 4.3.2 Dry Skin
      3. 4.3.3 Oily Skin
      4. 4.3.4 Combination Skin
    4. 4.4 Chemicals and Materials, BY Target Group (USD Million)
      1. 4.4.1 Men
      2. 4.4.2 Women
      3. 4.4.3 Aging Population
  5. 5 SECTION V: COMPETITIVE ANALYSIS
    1. 5.1 Competitive Landscape
      1. 5.1.1 Overview
      2. 5.1.2 Competitive Analysis
      3. 5.1.3 Market share Analysis
      4. 5.1.4 Major Growth Strategy in the Chemicals and Materials
      5. 5.1.5 Competitive Benchmarking
      6. 5.1.6 Leading Players in Terms of Number of Developments in the Chemicals and Materials
      7. 5.1.7 Key developments and growth strategies
        1. 5.1.7.1 New Product Launch/Service Deployment
        2. 5.1.7.2 Merger & Acquisitions
        3. 5.1.7.3 Joint Ventures
      8. 5.1.8 Major Players Financial Matrix
        1. 5.1.8.1 Sales and Operating Income
        2. 5.1.8.2 Major Players R&D Expenditure. 2023
    2. 5.2 Company Profiles
      1. 5.2.1 Allergan (US)
        1. 5.2.1.1 Financial Overview
        2. 5.2.1.2 Products Offered
        3. 5.2.1.3 Key Developments
        4. 5.2.1.4 SWOT Analysis
        5. 5.2.1.5 Key Strategies
      2. 5.2.2 Revance Therapeutics (US)
        1. 5.2.2.1 Financial Overview
        2. 5.2.2.2 Products Offered
        3. 5.2.2.3 Key Developments
        4. 5.2.2.4 SWOT Analysis
        5. 5.2.2.5 Key Strategies
      3. 5.2.3 Galderma (CH)
        1. 5.2.3.1 Financial Overview
        2. 5.2.3.2 Products Offered
        3. 5.2.3.3 Key Developments
        4. 5.2.3.4 SWOT Analysis
        5. 5.2.3.5 Key Strategies
      4. 5.2.4 Medytox (KR)
        1. 5.2.4.1 Financial Overview
        2. 5.2.4.2 Products Offered
        3. 5.2.4.3 Key Developments
        4. 5.2.4.4 SWOT Analysis
        5. 5.2.4.5 Key Strategies
      5. 5.2.5 Hugel (KR)
        1. 5.2.5.1 Financial Overview
        2. 5.2.5.2 Products Offered
        3. 5.2.5.3 Key Developments
        4. 5.2.5.4 SWOT Analysis
        5. 5.2.5.5 Key Strategies
      6. 5.2.6 Ipsen (FR)
        1. 5.2.6.1 Financial Overview
        2. 5.2.6.2 Products Offered
        3. 5.2.6.3 Key Developments
        4. 5.2.6.4 SWOT Analysis
        5. 5.2.6.5 Key Strategies
      7. 5.2.7 Medytox (KR)
        1. 5.2.7.1 Financial Overview
        2. 5.2.7.2 Products Offered
        3. 5.2.7.3 Key Developments
        4. 5.2.7.4 SWOT Analysis
        5. 5.2.7.5 Key Strategies
      8. 5.2.8 Sientra (US)
        1. 5.2.8.1 Financial Overview
        2. 5.2.8.2 Products Offered
        3. 5.2.8.3 Key Developments
        4. 5.2.8.4 SWOT Analysis
        5. 5.2.8.5 Key Strategies
      9. 5.2.9 Hugel (KR)
        1. 5.2.9.1 Financial Overview
        2. 5.2.9.2 Products Offered
        3. 5.2.9.3 Key Developments
        4. 5.2.9.4 SWOT Analysis
        5. 5.2.9.5 Key Strategies
    3. 5.3 Appendix
      1. 5.3.1 References
      2. 5.3.2 Related Reports
  6. 6 LIST OF FIGURES
    1. 6.1 MARKET SYNOPSIS
    2. 6.2 SOUTH AMERICA MARKET ANALYSIS BY TREATMENT TYPE
    3. 6.3 SOUTH AMERICA MARKET ANALYSIS BY PROCEDURE CATEGORY
    4. 6.4 SOUTH AMERICA MARKET ANALYSIS BY SKIN TYPE
    5. 6.5 SOUTH AMERICA MARKET ANALYSIS BY TARGET GROUP
    6. 6.6 KEY BUYING CRITERIA OF CHEMICALS AND MATERIALS
    7. 6.7 RESEARCH PROCESS OF MRFR
    8. 6.8 DRO ANALYSIS OF CHEMICALS AND MATERIALS
    9. 6.9 DRIVERS IMPACT ANALYSIS: CHEMICALS AND MATERIALS
    10. 6.10 RESTRAINTS IMPACT ANALYSIS: CHEMICALS AND MATERIALS
    11. 6.11 SUPPLY / VALUE CHAIN: CHEMICALS AND MATERIALS
    12. 6.12 CHEMICALS AND MATERIALS, BY TREATMENT TYPE, 2024 (% SHARE)
    13. 6.13 CHEMICALS AND MATERIALS, BY TREATMENT TYPE, 2024 TO 2035 (USD Million)
    14. 6.14 CHEMICALS AND MATERIALS, BY PROCEDURE CATEGORY, 2024 (% SHARE)
    15. 6.15 CHEMICALS AND MATERIALS, BY PROCEDURE CATEGORY, 2024 TO 2035 (USD Million)
    16. 6.16 CHEMICALS AND MATERIALS, BY SKIN TYPE, 2024 (% SHARE)
    17. 6.17 CHEMICALS AND MATERIALS, BY SKIN TYPE, 2024 TO 2035 (USD Million)
    18. 6.18 CHEMICALS AND MATERIALS, BY TARGET GROUP, 2024 (% SHARE)
    19. 6.19 CHEMICALS AND MATERIALS, BY TARGET GROUP, 2024 TO 2035 (USD Million)
    20. 6.20 BENCHMARKING OF MAJOR COMPETITORS
  7. 7 LIST OF TABLES
    1. 7.1 LIST OF ASSUMPTIONS
  8. 7.1.1
    1. 7.2 South America MARKET SIZE ESTIMATES; FORECAST
      1. 7.2.1 BY TREATMENT TYPE, 2025-2035 (USD Million)
      2. 7.2.2 BY PROCEDURE CATEGORY, 2025-2035 (USD Million)
      3. 7.2.3 BY SKIN TYPE, 2025-2035 (USD Million)
      4. 7.2.4 BY TARGET GROUP, 2025-2035 (USD Million)
    2. 7.3 PRODUCT LAUNCH/PRODUCT DEVELOPMENT/APPROVAL
  9. 7.3.1
    1. 7.4 ACQUISITION/PARTNERSHIP
  10. 7.4.1

South America Chemicals and Materials Market Segmentation

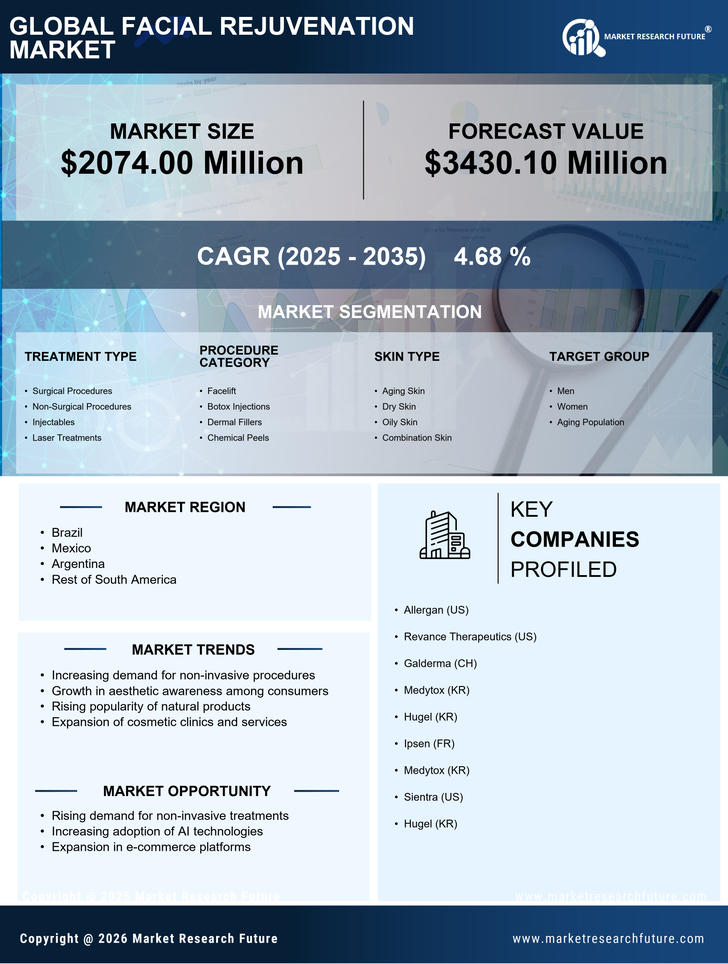
Chemicals and Materials By Treatment Type (USD Million, 2025-2035)

  • Surgical Procedures
  • Non-Surgical Procedures
  • Injectables
  • Laser Treatments

Chemicals and Materials By Procedure Category (USD Million, 2025-2035)

  • Facelift
  • Botox Injections
  • Dermal Fillers
  • Chemical Peels

Chemicals and Materials By Skin Type (USD Million, 2025-2035)

  • Aging Skin
  • Dry Skin
  • Oily Skin
  • Combination Skin

Chemicals and Materials By Target Group (USD Million, 2025-2035)

  • Men
  • Women
  • Aging Population

Compare Licence

×
Features License Type
Single User Multiuser License Enterprise User
Price $4,950 $5,950 $7,250
Maximum User Access Limit 1 User Upto 10 Users Unrestricted Access Throughout the Organization
Free Customization
Direct Access to Analyst
Deliverable Format
Platform Access
Discount on Next Purchase 10% 15% 15%
Printable Versions