Request Free Sample ×

Kindly complete the form below to receive a free sample of this Report

* Please use a valid business email

Leading companies partner with us for data-driven Insights

clients tt-cursor
Hero Background

South America Dravet Syndrome Market

ID: MRFR/HC/43541-HCR
200 Pages
Vikita Thakur
Last Updated: April 06, 2026

South America Dravet Syndrome Market Research Report: Size, Share, Trend Analysis By Types of Seizures (Myoclonic seizures, Atonic seizures, Partial seizures, Absence seizures, Tonic seizures, Photosensitive seizures, Others), By Disease Diagnosis (Magnetic Resonance Imaging, Electroencephalography, SCN1A testing, Others), By Treatment Management (Seizure Medications, Ketogenic Diet, Vagus Nerve Stimulation, Others) and By End-User (Pharmaceutical Companies, Hospitals, Diagnostic Laboratories, Academic research institutes, Others) - Growth Outlook & Industry Forecast 2025 To 2035

Share:
Download PDF ×

We do not share your information with anyone. However, we may send you emails based on your report interest from time to time. You may contact us at any time to opt-out.

  1. 1 SECTION I: EXECUTIVE SUMMARY AND KEY HIGHLIGHTS
    1. 1.1 EXECUTIVE SUMMARY
      1. 1.1.1 Market Overview
      2. 1.1.2 Key Findings
      3. 1.1.3 Market Segmentation
      4. 1.1.4 Competitive Landscape
      5. 1.1.5 Challenges and Opportunities
      6. 1.1.6 Future Outlook
  2. 2 SECTION II: SCOPING, METHODOLOGY AND MARKET STRUCTURE
    1. 2.1 MARKET INTRODUCTION
      1. 2.1.1 Definition
      2. 2.1.2 Scope of the study
        1. 2.1.2.1 Research Objective
        2. 2.1.2.2 Assumption
        3. 2.1.2.3 Limitations
    2. 2.2 RESEARCH METHODOLOGY
      1. 2.2.1 Overview
      2. 2.2.2 Data Mining
      3. 2.2.3 Secondary Research
      4. 2.2.4 Primary Research
        1. 2.2.4.1 Primary Interviews and Information Gathering Process
        2. 2.2.4.2 Breakdown of Primary Respondents
      5. 2.2.5 Forecasting Model
      6. 2.2.6 Market Size Estimation
        1. 2.2.6.1 Bottom-Up Approach
        2. 2.2.6.2 Top-Down Approach
      7. 2.2.7 Data Triangulation
      8. 2.2.8 Validation
  3. 3 SECTION III: QUALITATIVE ANALYSIS
    1. 3.1 MARKET DYNAMICS
      1. 3.1.1 Overview
      2. 3.1.2 Drivers
      3. 3.1.3 Restraints
      4. 3.1.4 Opportunities
    2. 3.2 MARKET FACTOR ANALYSIS
      1. 3.2.1 Value chain Analysis
      2. 3.2.2 Porter's Five Forces Analysis
        1. 3.2.2.1 Bargaining Power of Suppliers
        2. 3.2.2.2 Bargaining Power of Buyers
        3. 3.2.2.3 Threat of New Entrants
        4. 3.2.2.4 Threat of Substitutes
        5. 3.2.2.5 Intensity of Rivalry
      3. 3.2.3 COVID-19 Impact Analysis
        1. 3.2.3.1 Market Impact Analysis
        2. 3.2.3.2 Regional Impact
        3. 3.2.3.3 Opportunity and Threat Analysis
  4. 4 SECTION IV: QUANTITATIVE ANALYSIS
    1. 4.1 Construction, BY Type of Seizures (USD Million)
      1. 4.1.1 Myoclonic seizures
      2. 4.1.2 Partial seizures
      3. 4.1.3 Absence seizures
    2. 4.2 Construction, BY Treatment and Management (USD Million)
      1. 4.2.1 Seizure medications
      2. 4.2.2 Ketogenic diet
      3. 4.2.3 Vagus nerve stimulation
    3. 4.3 Construction, BY Diagnosis (USD Million)
      1. 4.3.1 MRI
      2. 4.3.2 EEG
      3. 4.3.3 SCN1A testing
    4. 4.4 Construction, BY End-user (USD Million)
      1. 4.4.1 Pharmaceutical Companies
      2. 4.4.2 Hospitals
      3. 4.4.3 Diagnostic Laboratories
      4. 4.4.4 Academic & research institutes
      5. 4.4.5 Others
  5. 5 SECTION V: COMPETITIVE ANALYSIS
    1. 5.1 Competitive Landscape
      1. 5.1.1 Overview
      2. 5.1.2 Competitive Analysis
      3. 5.1.3 Market share Analysis
      4. 5.1.4 Major Growth Strategy in the Construction
      5. 5.1.5 Competitive Benchmarking
      6. 5.1.6 Leading Players in Terms of Number of Developments in the Construction
      7. 5.1.7 Key developments and growth strategies
        1. 5.1.7.1 New Product Launch/Service Deployment
        2. 5.1.7.2 Merger & Acquisitions
        3. 5.1.7.3 Joint Ventures
      8. 5.1.8 Major Players Financial Matrix
        1. 5.1.8.1 Sales and Operating Income
        2. 5.1.8.2 Major Players R&D Expenditure. 2023
    2. 5.2 Company Profiles
      1. 5.2.1 Biogen (US)
        1. 5.2.1.1 Financial Overview
        2. 5.2.1.2 Products Offered
        3. 5.2.1.3 Key Developments
        4. 5.2.1.4 SWOT Analysis
        5. 5.2.1.5 Key Strategies
      2. 5.2.2 GW Pharmaceuticals (GB)
        1. 5.2.2.1 Financial Overview
        2. 5.2.2.2 Products Offered
        3. 5.2.2.3 Key Developments
        4. 5.2.2.4 SWOT Analysis
        5. 5.2.2.5 Key Strategies
      3. 5.2.3 Zogenix (US)
        1. 5.2.3.1 Financial Overview
        2. 5.2.3.2 Products Offered
        3. 5.2.3.3 Key Developments
        4. 5.2.3.4 SWOT Analysis
        5. 5.2.3.5 Key Strategies
      4. 5.2.4 Eisai (JP)
        1. 5.2.4.1 Financial Overview
        2. 5.2.4.2 Products Offered
        3. 5.2.4.3 Key Developments
        4. 5.2.4.4 SWOT Analysis
        5. 5.2.4.5 Key Strategies
      5. 5.2.5 Marinus Pharmaceuticals (US)
        1. 5.2.5.1 Financial Overview
        2. 5.2.5.2 Products Offered
        3. 5.2.5.3 Key Developments
        4. 5.2.5.4 SWOT Analysis
        5. 5.2.5.5 Key Strategies
      6. 5.2.6 UCB (BE)
        1. 5.2.6.1 Financial Overview
        2. 5.2.6.2 Products Offered
        3. 5.2.6.3 Key Developments
        4. 5.2.6.4 SWOT Analysis
        5. 5.2.6.5 Key Strategies
      7. 5.2.7 Novartis (CH)
        1. 5.2.7.1 Financial Overview
        2. 5.2.7.2 Products Offered
        3. 5.2.7.3 Key Developments
        4. 5.2.7.4 SWOT Analysis
        5. 5.2.7.5 Key Strategies
      8. 5.2.8 Ovid Therapeutics (US)
        1. 5.2.8.1 Financial Overview
        2. 5.2.8.2 Products Offered
        3. 5.2.8.3 Key Developments
        4. 5.2.8.4 SWOT Analysis
        5. 5.2.8.5 Key Strategies
    3. 5.3 Appendix
      1. 5.3.1 References
      2. 5.3.2 Related Reports
  6. 6 LIST OF FIGURES
    1. 6.1 MARKET SYNOPSIS
    2. 6.2 SOUTH AMERICA MARKET ANALYSIS BY TYPE OF SEIZURES
    3. 6.3 SOUTH AMERICA MARKET ANALYSIS BY TREATMENT AND MANAGEMENT
    4. 6.4 SOUTH AMERICA MARKET ANALYSIS BY DIAGNOSIS
    5. 6.5 SOUTH AMERICA MARKET ANALYSIS BY END-USER
    6. 6.6 KEY BUYING CRITERIA OF CONSTRUCTION
    7. 6.7 RESEARCH PROCESS OF MRFR
    8. 6.8 DRO ANALYSIS OF CONSTRUCTION
    9. 6.9 DRIVERS IMPACT ANALYSIS: CONSTRUCTION
    10. 6.10 RESTRAINTS IMPACT ANALYSIS: CONSTRUCTION
    11. 6.11 SUPPLY / VALUE CHAIN: CONSTRUCTION
    12. 6.12 CONSTRUCTION, BY TYPE OF SEIZURES, 2024 (% SHARE)
    13. 6.13 CONSTRUCTION, BY TYPE OF SEIZURES, 2024 TO 2035 (USD Million)
    14. 6.14 CONSTRUCTION, BY TREATMENT AND MANAGEMENT, 2024 (% SHARE)
    15. 6.15 CONSTRUCTION, BY TREATMENT AND MANAGEMENT, 2024 TO 2035 (USD Million)
    16. 6.16 CONSTRUCTION, BY DIAGNOSIS, 2024 (% SHARE)
    17. 6.17 CONSTRUCTION, BY DIAGNOSIS, 2024 TO 2035 (USD Million)
    18. 6.18 CONSTRUCTION, BY END-USER, 2024 (% SHARE)
    19. 6.19 CONSTRUCTION, BY END-USER, 2024 TO 2035 (USD Million)
    20. 6.20 BENCHMARKING OF MAJOR COMPETITORS
  7. 7 LIST OF TABLES
    1. 7.1 LIST OF ASSUMPTIONS
  8. 7.1.1
    1. 7.2 South America MARKET SIZE ESTIMATES; FORECAST
      1. 7.2.1 BY TYPE OF SEIZURES, 2025-2035 (USD Million)
      2. 7.2.2 BY TREATMENT AND MANAGEMENT, 2025-2035 (USD Million)
      3. 7.2.3 BY DIAGNOSIS, 2025-2035 (USD Million)
      4. 7.2.4 BY END-USER, 2025-2035 (USD Million)
    2. 7.3 PRODUCT LAUNCH/PRODUCT DEVELOPMENT/APPROVAL
  9. 7.3.1
    1. 7.4 ACQUISITION/PARTNERSHIP
  10. 7.4.1

South America Construction Market Segmentation

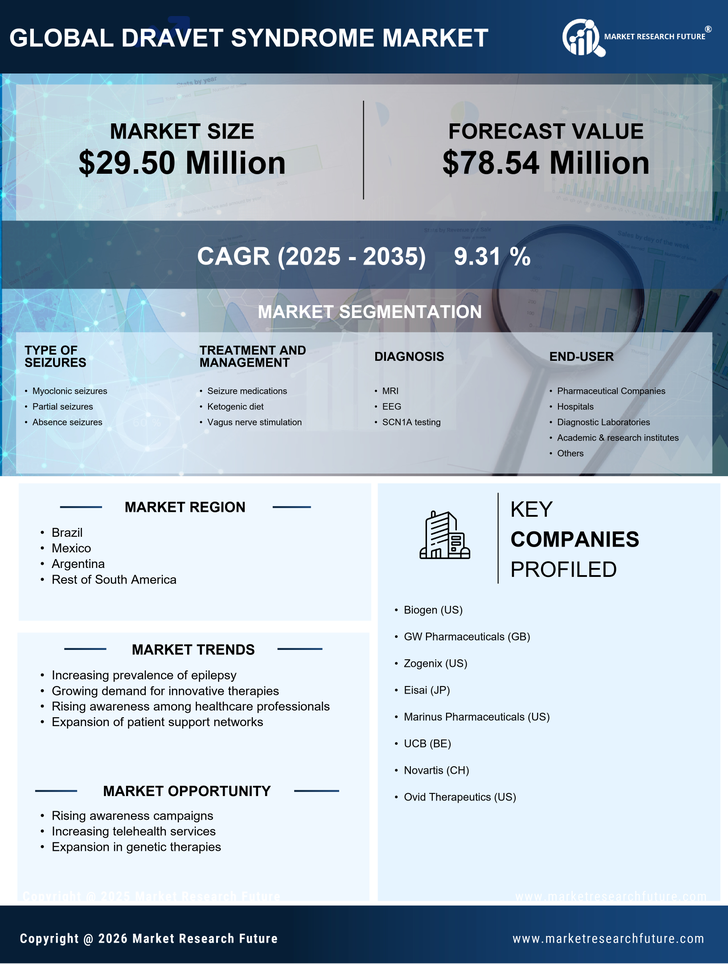
Construction By Type of Seizures (USD Million, 2025-2035)

  • Myoclonic seizures
  • Partial seizures
  • Absence seizures

Construction By Treatment and Management (USD Million, 2025-2035)

  • Seizure medications
  • Ketogenic diet
  • Vagus nerve stimulation

Construction By Diagnosis (USD Million, 2025-2035)

  • MRI
  • EEG
  • SCN1A testing

Construction By End-user (USD Million, 2025-2035)

  • Pharmaceutical Companies
  • Hospitals
  • Diagnostic Laboratories
  • Academic & research institutes
  • Others

Compare Licence

×
Features License Type
Single User Multiuser License Enterprise User
Price $4,950 $5,950 $7,250
Maximum User Access Limit 1 User Upto 10 Users Unrestricted Access Throughout the Organization
Free Customization
Direct Access to Analyst
Deliverable Format
Platform Access
Discount on Next Purchase 10% 15% 15%
Printable Versions