ID: MRFR/A&D/5691-HCR | February 2021 | Region: Global | 103 pages
Market Scenario
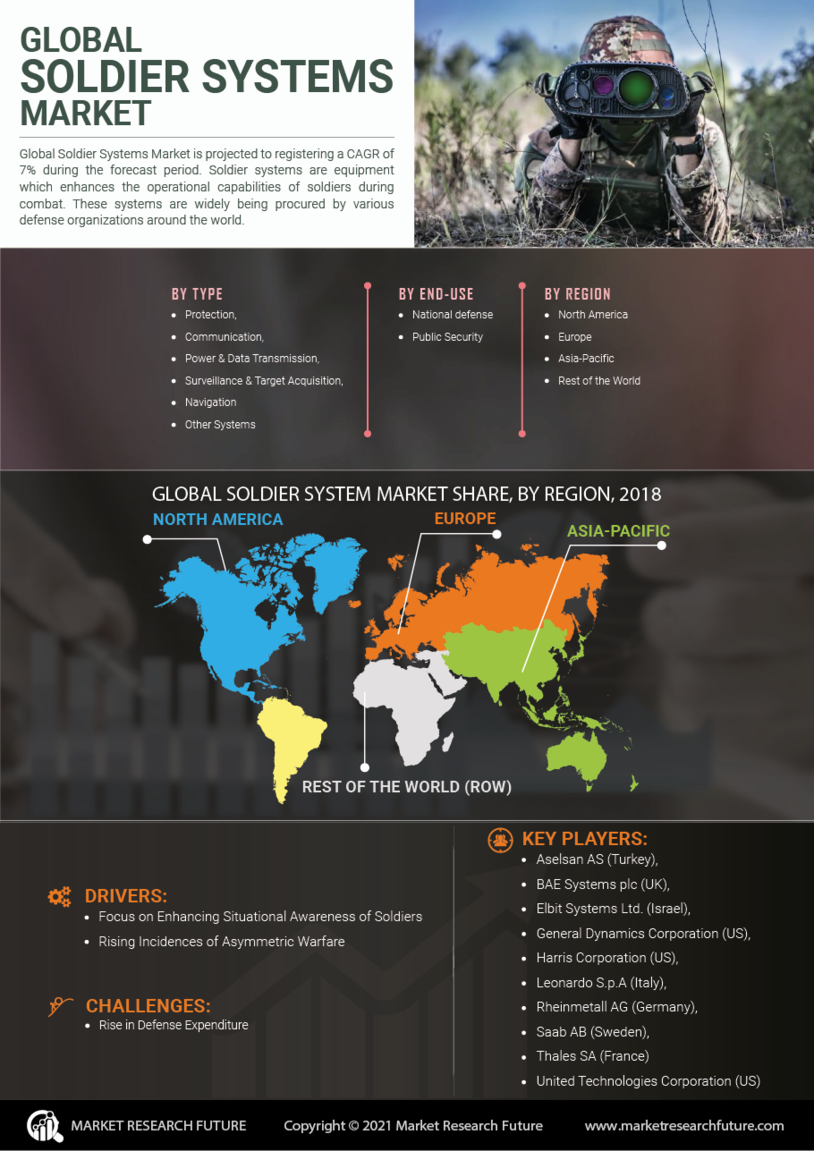
Soldier systems are equipment which enhances the operational capabilities of soldiers during combat. These systems are widely being procured by various defense organizations around the world. The systems cover everything from small wearables such as scopes to large portable devices such as Radars and Jammers. Soldier systems finds huge application in the defense sector as well as in the law enforcement agencies. However, the system components vary form one end-user to another.
Factors such as focus on enhancing situational awareness of soldiers in the battlefield and rising incidences of asymmetric warfare are positively impacting the soldier systems market growth. In addition, the rise in defense expenditure, especially in emerging economies and subsequent investments in procuring such systems further boosts the market growth. However, factors such as delays in procurement processes hinders the market growth to a certain extent while the reducing weight of the soldier systems is a key challenge faced by the market players. Meanwhile, rising terrorist attacks and focus on counter operations, and soldier modernization programs being initiated by many countries throughout the world, create promising growth opportunities for the soldier systems market. Companies are also keen on developing an integrated solution covering multiple systems.
The global soldier systems market has been segmented by type, application, and region. Based on type, the soldier systems market is divided into protection systems, communication systems, power & data transmission systems, surveillance & target acquisition systems, navigation & health monitoring systems, vision systems, and other systems. In 2017, the communication systems segment accounted for the largest market share as effective communication is a key factor determining success of military missions. Based on end-user, the soldier systems market is divided into national defense and public security. In 2017, the national defense segment accounted for the largest market share as most of the military forces around the world are focusing on upgrading soldier protection equipment and other combat gears.
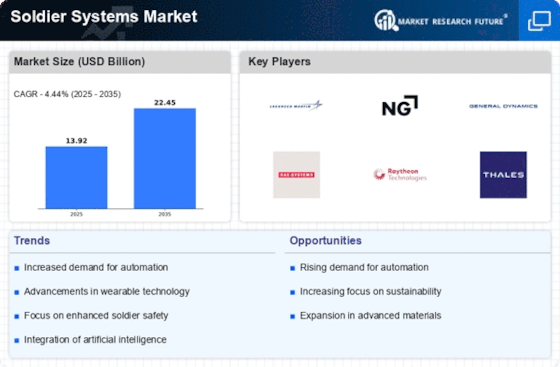
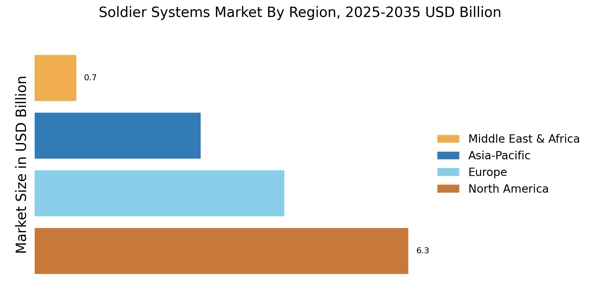
The global soldier systems market has also been segmented into four regions, namely, North America, Europe, Asia-Pacific, and Rest of the World. North America is estimated to account for the largest share during the review period. North America region in this report includes the US and Canada. Focus by the U.S. Department of Defense (DOD) on developing tactical equipment, in the recent years, have resulted in the market witnessing a significant surge in demand, in this region. Moreover, the current military operations and exercises in the Middle East countries will also result in the US focusing on developing modern soldier systems such as advanced combat gear, which will further deepen the scope of the market in the region. The global soldier systems market is estimated to register a CAGR of more than 7% during the forecast period of 2018 to 2023.
Intended Audience
Soldier System Manufactures
Tactical Communication Solution Providers
Law Enforcement Agencies
Component Suppliers
Defense Electronics Suppliers
Defense Organizations
Research Institutes
Regulatory Bodies
Key Players
The key players in the global soldier systems market are Aselsan AS (Turkey), BAE Systems plc (UK), Elbit Systems Ltd. (Israel), General Dynamics Corporation (US), Harris Corporation (US), Leonardo S.p.A (Italy), Rheinmetall AG (Germany), Saab AB (Sweden), Thales SA (France), and United Technologies Corporation (US).
Segmentation of the Global Soldier Systems Market
The report on the global soldier systems market by Market Research Future covers extensive primary research. This is accompanied by a detailed analysis of the qualitative and quantitative aspects by various industry experts and key opinion leaders to gain deeper insights into the market and industry performance. The report offers a clear picture of the current market scenario, which includes the historical and forecast market size, in terms of value, and the technological, macroeconomic, and governing factors of the market. The report also provides comprehensive information about the strategies of the top companies in the industry, along with a broad study of the different market segments and regions.
Frequently Asked Questions (FAQ) :
Global soldier systems market is projected to garner a substantial market value during the review period from 2018 to 2023.
Global soldier systems market is estimated to expand at a CAGR of 7% during the forecast period from 2018 to 2023.
The APAC is anticipated to be the fastest-growing region during the review period.
Based on type, the communication systems segment is expected to gain the maximum share during the review period.
Aselsan AS (Turkey), Thales SA (France), General Dynamics Corporation (US), and General Dynamics Corporation (US) are some of the key players of the global soldier systems market.
Table of Contents
1. Executive Summary
2. Market Introduction
2.1. Market Definition
2.2. Scope of the Study
2.3. Market Structure
2.4. Key Takeaways
2.5. Key Buying Criteria
3. Research Methodology
3.1. Research Process
3.2. Primary Research
3.3. Secondary Research
3.4. Market Size Estimation
3.5. Forecast Model
3.6. List of Assumptions
3.7. Limitations
4. Market Landscape
4.1. Porter’s Five Forces Analysis
4.1.1. Threat of New Entrants
4.1.2. Bargaining Power of Buyers
4.1.3. Threat of Substitutes
4.1.4. Segment Rivalry
4.1.5. Bargaining Power of Supplies
4.2. Value Chain/Supply Chain Analysis
5. Market Dynamics
5.1. Introduction
5.2. Market Drivers
5.3. Market Restraints
5.4. Market Opportunities
5.5. Market Trends
5.6. Patent Trends
5.7. Regulatory Landscape
6. Global Soldier Systems Market, by Type
6.1. Introduction
6.2. Protection Systems
6.2.1. Market Estimates & Forecast, 2018–2023
6.2.2. Market Estimates & Forecast, by Region, 2018–2023
6.3. Communication Systems
6.3.1. Market Estimates & Forecast, 2018–2023
6.3.2. Market Estimates & Forecast, by Region, 2018–2023
6.4. Power & Data Transmission Systems
6.4.1. Market Estimates & Forecast, 2018–2023
6.4.2. Market Estimates & Forecast, by Region, 2018–2023
6.5. Surveillance & Target Acquisition Systems
6.5.1. Market Estimates & Forecast, 2018–2023
6.5.2. Market Estimates & Forecast, by Region, 2018–2023
6.6. Navigation & Health Monitoring Systems
6.6.1. Market Estimates & Forecast, 2018–2023
6.6.2. Market Estimates & Forecast, by Region, 2018–2023
6.7. Vision Systems
6.7.1. Market Estimates & Forecast, 2018–2023
6.7.2. Market Estimates & Forecast, by Region, 2018–2023
6.8. Other Systems
6.8.1. Market Estimates & Forecast, 2018–2023
6.8.2. Market Estimates & Forecast, by Region, 2018–2023
7. Global Soldier Systems Market, by End-User
7.1. Introduction
7.2. National Defense
7.2.1. Market Estimates & Forecast, 2018–2023
7.2.2. Market Estimates & Forecast, by Region, 2018–2023
7.3. Public Security
7.3.1. Market Estimates & Forecast, 2018–2023
7.3.2. Market Estimates & Forecast, by Region, 2018–2023
8. Global Soldier Systems Market, by Region
8.1. Introduction
8.2. North America
8.2.1. Market Estimates & Forecast, by Country, 2018–2023
8.2.2. Market Estimates & Forecast, by Type, 2018–2023
8.2.3. Market Estimates & Forecast, by End-User, 2018–2023
8.2.4. US
8.2.4.1. Market Estimates & Forecast, by Type, 2018–2023
8.2.4.2. Market Estimates & Forecast, by End-User, 2018–2023
8.2.5. Canada
8.2.5.1. Market Estimates & Forecast, by Type, 2018–2023
8.2.5.2. Market Estimates & Forecast, by End-User, 2018–2023
8.3. Europe
8.3.1. Market Estimates & Forecast, by Type, 2018–2023
8.3.2. Market Estimates & Forecast, by End-User, 2018–2023
8.3.3. UK
8.3.3.1. Market Estimates & Forecast, by Type, 2018–2023
8.3.3.2. Market Estimates & Forecast, by End-User, 2018–2023
8.3.4. Germany
8.3.4.1. Market Estimates & Forecast, by Type, 2018–2023
8.3.4.2. Market Estimates & Forecast, by End-User, 2018–2023
8.3.5. France
8.3.5.1. Market Estimates & Forecast, by Type, 2018–2023
8.3.5.2. Market Estimates & Forecast, by End-User, 2018–2023
8.3.6. Russia
8.3.6.1. Market Estimates & Forecast, by Type, 2018–2023
8.3.6.2. Market Estimates & Forecast, by End-User, 2018–2023
8.3.7. Rest of Europe
8.3.7.1. Market Estimates & Forecast, by Type, 2018–2023
8.3.7.2. Market Estimates & Forecast, by End-User, 2018–2023
8.4. Asia-Pacific
8.4.1. Market Estimates & Forecast, by Country, 2018–2023
8.4.2. Market Estimates & Forecast, by Type, 2018–2023
8.4.3. Market Estimates & Forecast, by End-User, 2018–2023
8.4.4. China
8.4.4.1. Market Estimates & Forecast, by Type, 2018–2023
8.4.4.2. Market Estimates & Forecast, by End-User, 2018–2023
8.4.5. Japan
8.4.5.1. Market Estimates & Forecast, by Type, 2018–2023
8.4.5.2. Market Estimates & Forecast, by End-User, 2018–2023
8.4.6. India
8.4.6.1. Market Estimates & Forecast, by Type, 2018–2023
8.4.6.2. Market Estimates & Forecast, by End-User, 2018–2023
8.4.7. Rest of Asia-Pacific
8.4.7.1. Market Estimates & Forecast, by Type, 2018–2023
8.4.7.2. Market Estimates & Forecast, by End-User, 2018–2023
8.5. Rest of the World
8.5.1. Market Estimates & Forecast, by Region, 2018–2023
8.5.2. Market Estimates & Forecast, by Type, 2018–2023
8.5.3. Market Estimates & Forecast, by End-User, 2018–2023
8.5.4. Middle East & Africa
8.5.4.1. Market Estimates & Forecast, by Type, 2018–2023
8.5.4.2. Market Estimates & Forecast, by End-User, 2018–2023
8.5.5. Latin America
8.5.5.1. Market Estimates & Forecast, by Type, 2018–2023
8.5.5.2. Market Estimates & Forecast, by End-User, 2018–2023
9. Competitive Landscape
9.1. Competitive Scenario
9.2. Competitive Overview
9.3. Competitive Benchmarking
9.4. Market Share Analysis
10. Company Profiles
10.1. Aselsan AS
10.1.1. Company Overview
10.1.2. Product Offering
10.1.3. Financial Overview
10.1.4. Key Developments
10.1.5. Swot Analysis
10.1.6. Strategy
10.2. BAE Systems plc
10.2.1. Company Overview
10.2.2. Product Offering
10.2.3. Financial Overview
10.2.4. Key Developments
10.2.5. Swot Analysis
10.2.6. Strategy
10.3. Elbit Systems Ltd.
10.3.1. Company Overview
10.3.2. Product Offering
10.3.3. Financial Overview
10.3.4. Key Developments
10.3.5. Swot Analysis
10.3.6. Strategy
10.4. General Dynamics Corporation
10.4.1. Company Overview
10.4.2. Product Offering
10.4.3. Financial Overview
10.4.4. Key Developments
10.4.5. Swot Analysis
10.4.6. Strategy
10.5. Harris Corporation
10.5.1. Company Overview
10.5.2. Product Offering
10.5.3. Financial Overview
10.5.4. Key Developments
10.5.5. Swot Analysis
10.5.6. Strategy
10.6. Leonardo S.p.A
10.6.1. Company Overview
10.6.2. Product Offering
10.6.3. Financial Overview
10.6.4. Key Developments
10.6.5. Swot Analysis
10.6.6. Strategy
10.7. Rheinmetall AG
10.7.1. Company Overview
10.7.2. Product Offering
10.7.3. Financial Overview
10.7.4. Key Developments
10.7.5. Swot Analysis
10.7.6. Strategy
10.8. Saab AB
10.8.1. Company Overview
10.8.2. Product Offering
10.8.3. Financial Overview
10.8.4. Key Developments
10.8.5. Swot Analysis
10.8.6. Strategy
10.9. Thales SA
10.9.1. Company Overview
10.9.2. Product Offering
10.9.3. Financial Overview
10.9.4. Key Developments
10.9.5. Swot Analysis
10.9.6. Strategy
10.10. United Technologies Corporation
10.10.1. Company Overview
10.10.2. Product Offering
10.10.3. Financial Overview
10.10.4. Key Developments
10.10.5. Swot Analysis
10.10.6. Strategy
List of Tables
Table 1 Global Soldier Systems Market, by Region, 2018–2023
Table 2 North America: Soldier Systems Market, by Country, 2018–2023
Table 3 Europe: Soldier Systems Market, by Country, 2018–2023
Table 4 Asia-Pacific: Soldier Systems Market, by Country, 2018–2023
Table 5 Rest of the World: Soldier Systems Market, by Region, 2018–2023
Table 6 Global Soldier Systems Type Market, by Region, 2018–2023
Table 7 North America: Soldier Systems Type Market, by Country, 2018–2023
Table 8 Europe: Soldier Systems Type Market, by Country, 2018–2023
Table 9 Asia-Pacific: Soldier Systems Type Market, by Country, 2018–2023
Table 10 Rest of the World: Soldier Systems Type Market, by Region, 2018–2023
Table 11 Global Soldier Systems End-User Market, by Region, 2018–2023
Table 12 North America: Soldier Systems End-User Market, by Country, 2018–2023
Table 13 Europe: Soldier Systems End-User Market, by Country, 2018–2023
Table 14 Asia-Pacific: Soldier Systems End-User Market, by Country, 2018–2023
Table 15 Rest of the World: Soldier Systems End-User Market, by Region, 2018–2023
Table 16 Global Soldier Systems Market, by Region, 2018–2023
Table 17 Global Soldier Systems Market, by Type, 2018–2023
Table 18 Global Soldier Systems Market, by End-User, 2018–2023
Table 19 North America: Soldier Systems Market, by Country, 2018–2023
Table 20 North America: Soldier Systems Market, by Type, 2018–2023
Table 21 North America: Soldier Systems Market, by End-User, 2018–2023
Table 22 Europe: Soldier Systems Market, by Country, 2018–2023
Table 23 Europe: Soldier Systems Market, by Type, 2018–2023
Table 24 Europe: Soldier Systems Market, by End-User, 2018–2023
Table 25 Asia-Pacific: Soldier Systems Market, by Country, 2018–2023
Table 26 Asia-Pacific: Soldier Systems Market, by Type, 2018–2023
Table 27 Asia-Pacific: Soldier Systems Market, by End-User, 2018–2023
Table 28 Rest of the World: Soldier Systems Market, by Region, 2018–2023
Table 29 Rest of the World: Soldier Systems Market, by Type, 2018–2023
Table 30 Rest of the World: Soldier Systems Market, by End-User, 2018–2023
List Of Figures
FIGURE 1 Research Process of MRFR
FIGURE 2 Top-Down & Bottom-Up Approaches
FIGURE 3 Market Dynamics
FIGURE 4 Impact Analysis: Market Drivers
FIGURE 5 Impact Analysis: Market Restraints
FIGURE 6 Porter's Five Forces Analysis
FIGURE 7 Value Chain Analysis
FIGURE 8 Global Soldier Systems Market Share, by Type, 2017 (%)
FIGURE 9 Global Soldier Systems Market, by Type, 2018–2023 (USD Million)
FIGURE 10 Global Soldier Systems Market Share, by End-User, 2017 (%)
FIGURE 11 Global Soldier Systems Market, by End-User, 2018–2023 (USD Million)
FIGURE 12 Global Soldier Systems Market Share (%), By Region, 2017
FIGURE 13 Global Soldier Systems Market, by Region, 2018–2023 (USD Million)
FIGURE 14 North America: Soldier Systems Market Share (%), 2017
FIGURE 15 North America: Soldier Systems Market by Country, 2018–2023 (USD Million)
FIGURE 16 Europe: Soldier Systems Market Share (%), 2017
FIGURE 17 Europe: Soldier Systems Market by Country, 2018–2023 (USD Million)
FIGURE 18 Asia-Pacific: Soldier Systems Market Share (%), 2017
FIGURE 19 Asia-Pacific: Soldier Systems Market by Country, 2018–2023 (USD Million)
FIGURE 20 Rest of the World Soldier Systems Market Share (%), 2017
FIGURE 21 Rest of the World Soldier Systems Market by Region, 2018–2023 (USD Million)