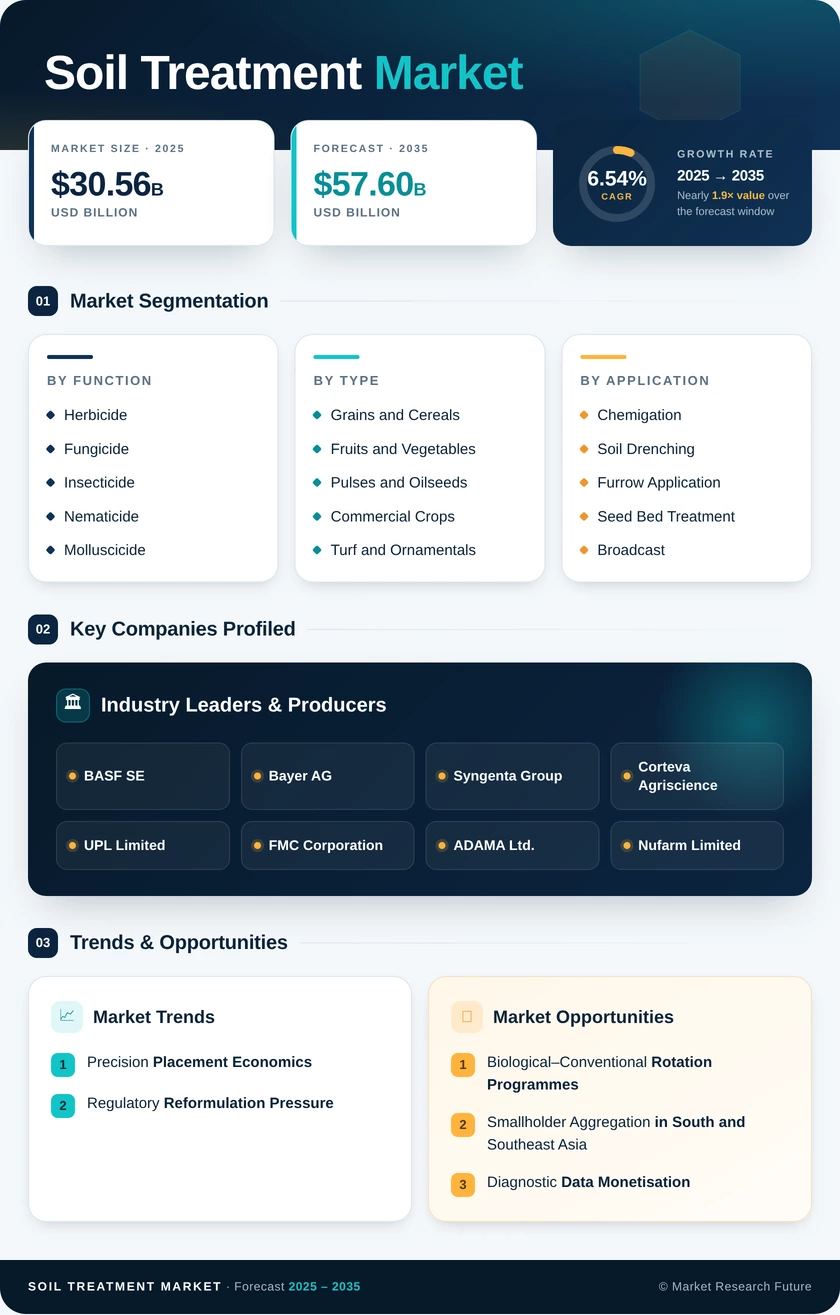
Soil Treatment Market (2026 - 2035)

ID: MRFR/Agri/34055-HCR 111 Pages Snehal Singh Last Updated: September 17, 2026

Soil Treatment Market Size, Share, Industry Trend & Analysis Research Report: By Function (Herbicide, Nematicide), By Crop Type (Grains and Cereals, Fruits and Vegetables), By Application Method (Broadcast, Chemigation), By Geography (Asia-Pacific, Asia-Pacific) - Forecast to 2035.

Soil Treatment Market
Market Size
Forecast Period2026-2035
CAGR (2026-2035)6.54%
2025 Market SizeUSD 30.56 Billion
2035 Market SizeUSD 57.60 Billion
Key Players
BASF SE
Bayer AG
Syngenta Group
Corteva Agriscience
UPL Limited
FMC Corporation
Opportunities
  • Biological–Conventional Rotation Programmes
  • Smallholder Aggregation in South and Southeast Asia
  • Diagnostic Data Monetisation
  1. 1 Market Summary |
    1. 1.1 Study Assumptions & Market Definition |
    2. 1.2 Scope of the Study |
    3. 1.3 Research Methodology
  2. 2 Key Report Takeaways |
    1. 2.1 By Function |
    2. 2.2 By Crop Type |
    3. 2.3 By Geography
  3. 3 Market Size & Forecast (2021–2035) |
    1. 3.1 Historical Market Size (2021–2024) |
    2. 3.2 Base Year Assessment (2025) |
    3. 3.3 Forecast Market Size (2026–2035) |
    4. 3.4 Year-over-Year Growth Analysis
  4. 4 Driver Impact Analysis |
    1. 4.1 Pathogen Pressure on Global Staples |
    2. 4.2 Precision Placement Economics |
    3. 4.3 Regulatory Reformulation Pressure
  5. 5 Restraints Impact Analysis |
    1. 5.1 Registration Withdrawals |
    2. 5.2 Farm Margin Compression |
    3. 5.3 Contamination Liability
  6. 6 Opportunities |
    1. 6.1 Biological–Conventional Rotation Programmes |
    2. 6.2 Smallholder Aggregation in South and Southeast Asia |
    3. 6.3 Diagnostic Data Monetisation |
    4. 6.4 Protected Cultivation in the Gulf |
    5. 6.5 Carbon-Linked Soil Programmes
  7. 7 Regional Market Share & Country-Level Analysis |
    1. 7.1 North America | |
      1. 7.1.1 US | |
      2. 7.1.2 Canada | |
      3. 7.1.3 Mexico |
    2. 7.2 Europe | |
      1. 7.2.1 Germany | |
      2. 7.2.2 UK | |
      3. 7.2.3 France | |
      4. 7.2.4 Italy | |
      5. 7.2.5 Spain | |
      6. 7.2.6 Nordic Countries | |
      7. 7.2.7 Russia | |
      8. 7.2.8 Rest of Europe |
    3. 7.3 Asia-Pacific | |
      1. 7.3.1 China | |
      2. 7.3.2 India | |
      3. 7.3.3 Japan | |
      4. 7.3.4 South Korea | |
      5. 7.3.5 ASEAN | |
      6. 7.3.6 Rest of Asia-Pacific |
    4. 7.4 South America | |
      1. 7.4.1 Brazil | |
      2. 7.4.2 Argentina | |
      3. 7.4.3 Rest of South America |
    5. 7.5 Middle East & Africa | |
      1. 7.5.1 Saudi Arabia | |
      2. 7.5.2 UAE | |
      3. 7.5.3 South Africa | |
      4. 7.5.4 Egypt | |
      5. 7.5.5 Rest of Middle East & Africa
  8. 8 Future Outlook (2026–2035) |
    1. 8.1 Autonomous Application |
    2. 8.2 Prescription Platform Economics |
    3. 8.3 Biological Scale-Up |
    4. 8.4 Carbon and Soil Organic Matter Reporting
  9. 9 Market Segmentation Analysis |
    1. 9.1 By Function | |
      1. 9.1.1 Fungicide | |
      2. 9.1.2 Herbicide | |
      3. 9.1.3 Insecticide | |
      4. 9.1.4 Molluscicide | |
      5. 9.1.5 Nematicide |
    2. 9.2 By Crop Type | |
      1. 9.2.1 Grains and Cereals | |
      2. 9.2.2 Fruits and Vegetables | |
      3. 9.2.3 Pulses and Oilseeds | |
      4. 9.2.4 Commercial Crops | |
      5. 9.2.5 Turf and Ornamentals |
    3. 9.3 By Application Method | |
      1. 9.3.1 Broadcast | |
      2. 9.3.2 Furrow Application | |
      3. 9.3.3 Soil Drenching | |
      4. 9.3.4 Chemigation | |
      5. 9.3.5 Seed Bed Treatment
  10. 10 Competitive Landscape |
    1. 10.1 Market Concentration Analysis (2026) |
    2. 10.2 Competitive Benchmarking Matrix |
    3. 10.3 Company Profiles | |
      1. 10.3.1 BASF SE | |
      2. 10.3.2 Bayer AG | |
      3. 10.3.3 Syngenta Group | |
      4. 10.3.4 Corteva Agriscience | |
      5. 10.3.5 UPL Limited | |
      6. 10.3.6 FMC Corporation | |
      7. 10.3.7 ADAMA Ltd. | |
      8. 10.3.8 Nufarm Limited | |
      9. 10.3.9 Sumitomo Chemical | |
      10. 10.3.10 AMVAC Chemical | |
      11. 10.3.11 Certis Biologicals
  11. 11 Recent News & Developments
  12. 12 Report Scope & Methodology |
    1. 12.1 Study Period & Base Year |
    2. 12.2 Data Sources & Validation |
    3. 12.3 Abbreviations
  13. 13 Detailed Sources & Citations
  14. 14 Frequently Asked Questions
  15. 15 LIST OF TABLES |
  16. TABLE 1 Global Soil Treatment Market Size & Forecast, by Revenue (USD Billion), 2021–2035 |
  17. TABLE 2 Global Soil Treatment Market – Year-over-Year Growth Analysis, 2021–2035 |
  18. TABLE 3 Driver Impact Analysis – Global Soil Treatment Market, 2026–2035 |
  19. TABLE 4 Restraint Impact Analysis – Global Soil Treatment Market, 2026–2035 |
  20. TABLE 5 Global Soil Treatment Market Size, by Function, 2021–2035 (USD Billion) |
  21. TABLE 6 Global Soil Treatment Market Size, by Crop Type, 2021–2035 (USD Billion) |
  22. TABLE 7 Global Soil Treatment Market Size, by Application Method, 2021–2035 (USD Billion) |
  23. TABLE 8 Global Soil Treatment Market Size, by Region, 2021–2035 (USD Billion) |
  24. TABLE 9 North America Soil Treatment Market Size, by Country, 2021–2035 (USD Billion) |
  25. TABLE 10 Europe Soil Treatment Market Size, by Country, 2021–2035 (USD Billion) |
  26. TABLE 11 Asia-Pacific Soil Treatment Market Size, by Country, 2021–2035 (USD Billion) |
  27. TABLE 12 South America Soil Treatment Market Size, by Country, 2021–2035 (USD Billion) |
  28. TABLE 13 Middle East & Africa Soil Treatment Market Size, by Country, 2021–2035 (USD Billion) |
  29. TABLE 14 North America Soil Treatment Market Size, by Function, 2021–2035 (USD Billion) |
  30. TABLE 15 North America Soil Treatment Market Size, by Crop Type, 2021–2035 (USD Billion) |
  31. TABLE 16 Europe Soil Treatment Market Size, by Function, 2021–2035 (USD Billion) |
  32. TABLE 17 Europe Soil Treatment Market Size, by Crop Type, 2021–2035 (USD Billion) |
  33. TABLE 18 Asia-Pacific Soil Treatment Market Size, by Function, 2021–2035 (USD Billion) |
  34. TABLE 19 Asia-Pacific Soil Treatment Market Size, by Crop Type, 2021–2035 (USD Billion) |
  35. TABLE 20 South America Soil Treatment Market Size, by Function, 2021–2035 (USD Billion) |
  36. TABLE 21 Middle East & Africa Soil Treatment Market Size, by Function, 2021–2035 (USD Billion) |
  37. TABLE 22 Competitive Benchmarking Matrix – Global Soil Treatment Market, 2026 |
  38. TABLE 23 Company Profiles – Key Players, Global Soil Treatment Market |
  39. TABLE 24 Recent Developments & Strategic Announcements, 2023–2025 |
  40. TABLE 25 Report Scope & Methodology Summary |
  41. TABLE 26 Detailed Sources & Citations Index Source: Market Research Future Analysis
  42. 16 LIST OF FIGURES |
  43. FIGURE 1 Global Soil Treatment Market – Market Dynamics Overview (Drivers, Restraints, Opportunities) |
  44. FIGURE 2 Industry Value Chain Analysis – Soil Treatment Market |
  45. FIGURE 3 Porter's Five Forces Analysis – Soil Treatment Market |
  46. FIGURE 4 Global Soil Treatment Market Size Trend, 2021–2035 (USD Billion) |
  47. FIGURE 5 Year-over-Year Growth Curve, 2022–2035 (%) |
  48. FIGURE 6 Market Share by Function, 2025 vs 2035 (%) |
  49. FIGURE 7 Market Share by Crop Type, 2025 vs 2035 (%) |
  50. FIGURE 8 Application Method Growth Comparison, 2026–2035 (CAGR %) |
  51. FIGURE 9 Regional Revenue Share Distribution, 2025 (%) |
  52. FIGURE 10 Regional Growth Rate Comparison, 2026–2035 (CAGR %) |
  53. FIGURE 11 Country-Level Contribution within Asia-Pacific, 2025 (%) |
  54. FIGURE 12 Competitive Landscape – Estimated Revenue Share Bands, 2026 |
  55. FIGURE 13 Strategic Positioning Matrix – Key Suppliers |
  56. FIGURE 14 Driver Impact Weighting Chart, 2026–2035 Source: Market Research Future Analysis

Segmentation Quick Reference

DimensionSub-SegmentsDominant SegmentFastest Growing Segment
By FunctionFungicide, Herbicide, Insecticide, Molluscicide, NematicideHerbicideNematicide
By Crop TypeGrains and Cereals, Fruits and Vegetables, Pulses and Oilseeds, Commercial Crops, Turf and OrnamentalsGrains and CerealsFruits and Vegetables
By Application MethodBroadcast, Furrow Application, Soil Drenching, Chemigation, Seed Bed TreatmentBroadcastChemigation
By GeographyNorth America, South America, Europe, Asia-Pacific, Middle East & AfricaAsia-PacificAsia-Pacific


Market Segmentation Overview

By Function

Sub-SegmentKey Trend
FungicideStacked programmes for damping-off and root rot in beet, potato and vegetable rotations
HerbicideResidual pre-emergent chemistry anchors no-till weed control economics
InsecticideGranular formulations defended by white grub and wireworm pressure in maize and soybean
MolluscicideNiche but resilient demand tied to wet-season cereal establishment
NematicideFastest expansion as cyst and root-knot populations spread through oilseed rotations


Function remains the primary commercial axis, but the spread between segments is widening. Herbicides supply scale and stability, while nematicides supply growth and pricing power — a portfolio balance most large suppliers are now managing deliberately rather than incidentally.

By Crop Type

Sub-SegmentKey Trend
Grains and CerealsVolume backbone; per-hectare spend disciplined by commodity pricing
Fruits and VegetablesPremium prophylactic treatment justified by high replanting cost
Pulses and OilseedsNematode and root disease pressure driving in-furrow adoption
Commercial CropsCotton and sugarcane programmes concentrated in Asia and Brazil
Turf and OrnamentalsAmenity and sports turf demand tied to discretionary spending cycles


Crop mix explains most regional variance in per-hectare spend. Horticulture-heavy geographies generate disproportionate revenue relative to treated area, which is why Gulf and East Asian markets outperform their acreage share.

By Application Method

Sub-SegmentKey Trend
BroadcastLosing share to placement-precise methods under drift and buffer rules
Furrow ApplicationPlanting-time placement favoured for nematode and insect control
Soil DrenchingNursery and protected cultivation staple with high attached-service revenue
ChemigationFastest growth, tracking drip irrigation expansion in horticulture
Seed Bed TreatmentVegetable transplant systems driving steady, defensible demand


Method choice is becoming the sharpest predictor of supplier profitability. Vendors positioned in chemigation and drench channels earn more per litre and retain customers longer than those still selling primarily into broadcast programmes.

By Region

Sub-SegmentKey Trend
North AmericaPrecision retrofit and nematicide programme expansion in the Corn Belt
South AmericaDouble-cropping intensity sustaining year-round pathogen pressure
EuropeValue growth through reformulation despite falling active-ingredient tonnage
Asia-PacificSmallholder aggregation and protected horticulture driving fastest regional growth
Middle East & AfricaSovereign food-security capital funding controlled-environment demand


Geographic strategy now hinges on channel structure more than product portfolio. Suppliers that solved smallholder distribution in Asia and cooperative financing in South America hold structural advantages that competitors cannot replicate through pricing alone.




Download PDF ×

We do not share your information with anyone. However, we may send you emails based on your report interest from time to time. You may contact us at any time to opt-out.