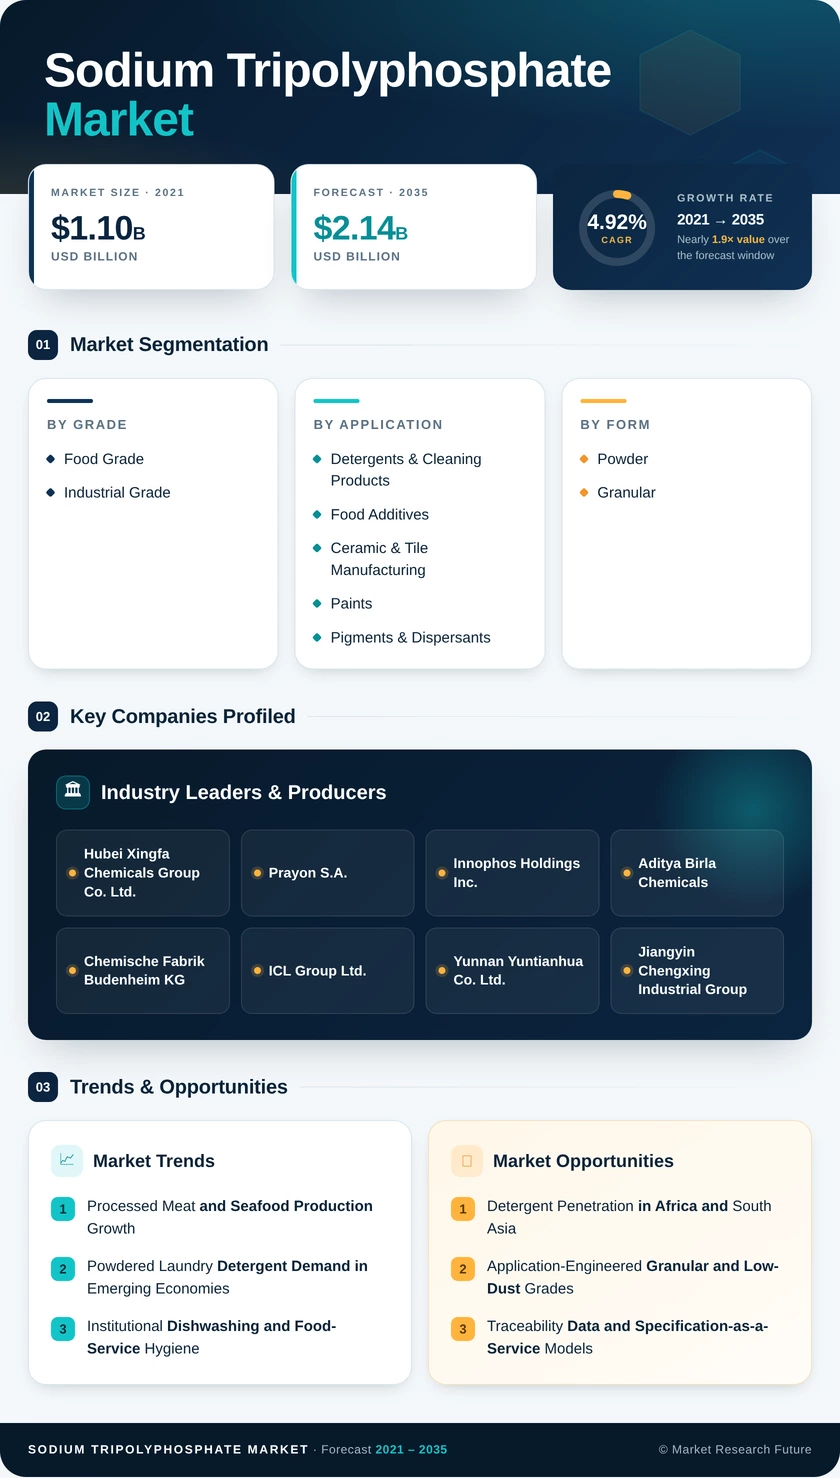
Sodium Tripolyphosphate Market (2026 - 2035)

ID: MRFR/CnM/1704-CR 111 Pages Chitranshi Jaiswal Last Updated: October 22, 2026
Sodium Tripolyphosphate Market Research Report Information By Grade (Food Grade and Industrial Grade), By Application (Detergents & Cleaning Products, Food Additives, Ceramic & Tile Manufacturing, Paints, Pigments & Dispersants, Metal Surface Treatment, and Other Applications), By Form (Powder and Granular), By End-Use Industry (Household & Industrial Cleaning, Food & Beverage, Water Treatment, Ceramics, Paints & Coatings, Metal Processing, and Other End-Use Industries), And By Region (North America, Europe, Asia-Pacific, and Rest of the World) – Market Forecast Till 2035.
Sodium Tripolyphosphate Market
Market Size
Forecast Period2026-2035
CAGR (2026-2035)4.92%
2025 Market SizeUSD 1.32 Billion
2035 Market SizeUSD 2.14 Billion
Key Players
Hubei Xingfa Chemicals Group Co. Ltd.
Prayon S.A.
Innophos Holdings Inc.
Aditya Birla Chemicals
Chemische Fabrik Budenheim KG
ICL Group Ltd.
Opportunities
  • Detergent Penetration in Africa and South Asia
  • Application-Engineered Granular and Low-Dust Grades
  • Traceability Data and Specification-as-a-Service Models
  1. 1 Market Summary | |
  2. 2 Key Report Takeaways | |
    1. 2.1 By Grade | |
    2. 2.2 By Application | |
    3. 2.3 By Form | |
    4. 2.4 By End-use Industry | |
    5. 2.5 By Region | |
  3. 3 Market Size and Forecast (2021–2035) | |
    1. 3.1 Historical Market Size (2021–2025) | |
    2. 3.2 Forecast Market Size (2026–2035) | |
    3. 3.3 Year-over-Year Growth Analysis | |
  4. 4 Driver Impact Analysis | |
    1. 4.1 Processed Meat and Seafood Production Growth | |
    2. 4.2 Powdered Laundry Detergent Demand in Emerging Economies | |
    3. 4.3 Institutional Dishwashing and Food-Service Hygiene | |
    4. 4.4 Ceramic Tile and Sanitaryware Output | |
    5. 4.5 Industrial Cooling and Boiler Scale Control | |
    6. 4.6 Integrated Phosphate Production Cost Advantage | |
  5. 5 Restraints Impact Analysis | |
    1. 5.1 Phosphate Limits in Consumer Detergents | |
    2. 5.2 Substitution by Zeolites, Citrates and Biodegradable Chelants | |
    3. 5.3 Eutrophication-Driven Local Regulation in Asia | |
    4. 5.4 Feedstock Price Volatility and Export Controls | |
    5. 5.5 Clean-Label Pressure on Phosphate Food Additives | |
  6. 6 Opportunities | |
    1. 6.1 Detergent Penetration in Africa and South Asia | |
    2. 6.2 Application-Engineered Granular and Low-Dust Grades | |
    3. 6.3 Traceability Data and Specification-as-a-Service Models | |
    4. 6.4 Food Grade Capacity Near Seafood Export Hubs | |
    5. 6.5 Circular Phosphorus and Critical Raw Material Status | |
  7. 7 Regional Market Share and Country-Level Analysis | |
    1. 7.1 North America | | |
      1. 7.1.1 US | | |
      2. 7.1.2 Canada | | |
      3. 7.1.3 Mexico | |
    2. 7.2 Europe | | |
      1. 7.2.1 Germany | | |
      2. 7.2.2 UK | | |
      3. 7.2.3 France | | |
      4. 7.2.4 Italy | | |
      5. 7.2.5 Spain | | |
      6. 7.2.6 Nordic Countries | | |
      7. 7.2.7 Russia | | |
      8. 7.2.8 Rest of Europe | |
    3. 7.3 Asia-Pacific | | |
      1. 7.3.1 China | | |
      2. 7.3.2 India | | |
      3. 7.3.3 Japan | | |
      4. 7.3.4 South Korea | | |
      5. 7.3.5 ASEAN | | |
      6. 7.3.6 Rest of Asia-Pacific | |
    4. 7.4 South America | | |
      1. 7.4.1 Brazil | | |
      2. 7.4.2 Argentina | | |
      3. 7.4.3 Rest of South America | |
    5. 7.5 Middle East & Africa | | |
      1. 7.5.1 Saudi Arabia | | |
      2. 7.5.2 UAE | | |
      3. 7.5.3 South Africa | | |
      4. 7.5.4 Egypt | | |
      5. 7.5.5 Rest of MEA | |
  8. 8 Future Outlook (2026–2035) | |
    1. 8.1 Regulatory Divergence and Demand Rebalancing | |
    2. 8.2 Protein Systems and Food Specification Upgrades | |
    3. 8.3 Feedstock Security and Critical Raw Materials | |
    4. 8.4 Energy Intensity and Decarbonization | |
  9. 9 Segmentation Analysis | |
    1. 9.1 By Grade | | |
      1. 9.1.1 Food Grade | | |
      2. 9.1.2 Industrial Grade | |
    2. 9.2 By Application | | |
      1. 9.2.1 Detergents & Cleaning Products | | |
      2. 9.2.2 Food Additives | | |
      3. 9.2.3 Ceramic & Tile Manufacturing | | |
      4. 9.2.4 Paints | | |
      5. 9.2.5 Pigments & Dispersants | | |
      6. 9.2.6 Metal Surface Treatment | | |
      7. 9.2.7 Other Applications | |
    3. 9.3 By Form | | |
      1. 9.3.1 Powder | | |
      2. 9.3.2 Granular | |
    4. 9.4 By End-use Industry | | |
      1. 9.4.1 household & industrial cleaning | | |
      2. 9.4.2 food & beverage | | |
      3. 9.4.3 water treatment | | |
      4. 9.4.4 ceramics | | |
      5. 9.4.5 paints & coatings | | |
      6. 9.4.6 metal processing | | |
      7. 9.4.7 other end-use industries | |
  10. 10 Competitive Landscape | |
    1. 10.1 Market Concentration Analysis | |
    2. 10.2 Competitive Benchmarking Matrix | |
    3. 10.3 Company Profiles | | |
      1. 10.3.1 Hubei Xingfa Chemicals Group Co. Ltd. | | |
      2. 10.3.2 Prayon S.A. | | |
      3. 10.3.3 Innophos Holdings Inc. | | |
      4. 10.3.4 Aditya Birla Chemicals | | |
      5. 10.3.5 Chemische Fabrik Budenheim KG | | |
      6. 10.3.6 ICL Group Ltd. | | |
      7. 10.3.7 Yunnan Yuntianhua Co. Ltd. | | |
      8. 10.3.8 Jiangyin Chengxing Industrial Group | | |
      9. 10.3.9 Guizhou Chanhen Chemical Corporation | | |
      10. 10.3.10 Hindustan Phosphates Pvt. Ltd. | |
  11. 11 Recent News & Developments | |
  12. 12 Report Scope and Methodology | |
  13. 13 Detailed Sources and Citations | |
  14. 14 Frequently Asked Questions (FAQs) | | LIST OF TABLES | |
  15. TABLE 1 Global STPP Market Summary, 2025–2035 | |
  16. TABLE 2 Global STPP Market Size and Forecast, by Revenue (USD Billion), 2021–2035 | |
  17. TABLE 3 Driver Impact Analysis, 2026–2035 | |
  18. TABLE 4 Restraints Impact Analysis, 2026–2035 | |
  19. TABLE 5 Regional Summary, 2025 (USD Billion) | |
  20. TABLE 6 North America STPP Market, by Country, 2025 | |
  21. TABLE 7 Europe STPP Market, by Country, 2025 | |
  22. TABLE 8 Asia-Pacific STPP Market, by Country, 2025 | |
  23. TABLE 9 South America STPP Market, by Country, 2025 | |
  24. TABLE 10 Middle East & Africa STPP Market, by Country, 2025 | |
  25. TABLE 11 Global STPP Market, by Grade, 2025 | |
  26. TABLE 12 Global STPP Market, by Application, 2025 | |
  27. TABLE 13 Global STPP Market, by Form, 2025 | |
  28. TABLE 14 Global STPP Market, by End-use Industry, 2025 | |
  29. TABLE 15 Competitive Benchmarking Matrix, 2025 | |
  30. TABLE 16 Report Scope and Methodology | |
  31. TABLE 17 Detailed Sources and Citations | |
  32. TABLE 18 Segmentation Quick Reference | | LIST OF FIGURES | |
  33. FIGURE 1 Market Dynamics Overview – Drivers, Restraints and Opportunities | |
  34. FIGURE 2 STPP Value Chain – Phosphate Rock to End Use | |
  35. FIGURE 3 Porter's Five Forces Analysis | |
  36. FIGURE 4 Global Market Size Trend, 2021–2035 (USD Billion) | |
  37. FIGURE 5 Market Share by Grade, 2025 | |
  38. FIGURE 6 Market Share by Application, 2025 | |
  39. FIGURE 7 Market Share by Form, 2025 | |
  40. FIGURE 8 Market Share by End-use Industry, 2025 | |
  41. FIGURE 9 Regional Market Share, 2025 | |
  42. FIGURE 10 Asia-Pacific Country Share, 2025 | |
  43. FIGURE 11 Competitive Landscape – Revenue Share Ranges of Key Players, 2025

Segmentation Quick Reference

DimensionSub-SegmentsDominant SegmentFastest Growing Segment
By GradeFood Grade, Industrial GradeIndustrial Grade (62.0% share)Food Grade (5.7% CAGR)
By ApplicationDetergents & Cleaning Products, Food Additives, Ceramic & Tile Manufacturing, Paints, Pigments & Dispersants, Metal Surface Treatment, Other ApplicationsDetergents & Cleaning Products (53.2% share)Food Additives (5.8% CAGR)
By FormPowder, GranularPowder (68.5% share)Granular (5.4% CAGR)
By End-use Industryhousehold & industrial cleaning, food & beverage, water treatment, ceramics, paints & coatings, metal processing, other end-use industrieshousehold & industrial cleaning (51.0% share)food & beverage (5.9% CAGR)
By RegionNorth America, Europe, Asia-Pacific, South America, Middle East & AfricaAsia-Pacific (47.5% share)Asia-Pacific (5.6% CAGR)

Market Segmentation Overview

By Grade

Sub-SegmentKey Trend
Food GradeTighter heavy-metal specifications and longer supplier qualification cycles
Industrial GradeScale-driven pricing with demand for phase-controlled variants

Industrial Grade leads because detergent, tile and water treatment buyers consume large tonnages and buy mainly on assay and delivered cost. Food Grade grows fastest as poultry and seafood processors require certified purity and traceability, and once approved, suppliers retain these accounts for years.

By Application

Sub-SegmentKey Trend
Detergents & Cleaning ProductsVolume shifting toward emerging-economy powders and institutional dishwashing
Food AdditivesRising brine and yield applications in poultry and shrimp
Ceramic & Tile ManufacturingStable slip deflocculation demand in India, China and the Gulf
PaintsSteady use in water-based architectural coatings
Pigments & DispersantsSlurry processing for kaolin and titanium dioxide
Metal Surface TreatmentMature degreasing and pre-treatment use
Other ApplicationsNiche drilling, textile and paper uses

Detergents & Cleaning Products hold the leading share because phosphate-built powders remain cost-effective across South Asia and Africa, and commercial dishwashing stays outside most phosphorus limits. Food Additives grow fastest as processors use STPP for moisture retention and protein binding, while Ceramic & Tile Manufacturing supplies steady technical volume.

By Form

Sub-SegmentKey Trend
PowderPreferred in spray-dried detergents and food brine blending
GranularGaining in compact detergents and automated dosing

Powder leads because spray-drying towers and brine preparation favour fast-dissolving fine particles. Granular grows fastest as compact detergent makers and food plants value low dust, free flow and reduced caking, accepting higher unit prices for better handling.

By End-use Industry

Sub-SegmentKey Trend
household & industrial cleaningEmerging-market laundry growth offsets mature-market reformulation
food & beverageProtein and convenience food expansion in Asia and South America
water treatmentPrecise low-dose scale and corrosion control
ceramicsConstruction-linked tile and sanitaryware demand
paints & coatingsGrowth tied to industrial and architectural output
metal processingMature surface cleaning applications
other end-use industriesSmall but steady textile, paper and drilling demand

household & industrial cleaning remains the largest end use, supported by hard-water laundry markets and institutional hygiene requirements. food & beverage grows fastest because brined poultry, frozen seafood and processed dairy volumes are expanding, while water treatment and ceramics provide stable, specification-driven demand.


Download PDF ×

We do not share your information with anyone. However, we may send you emails based on your report interest from time to time. You may contact us at any time to opt-out.