ID: MRFR/CnM/1963-CR | February 2021 | Region: Global | 182 Pages
1 Executive Summary
2 Market Introduction
2.1 Definition 18
2.2 Scope Of The Study 18
2.3 List Of Assumptions 19
2.4 Market Structure 20
2.5 Key Takeaways 20
3 Market Insights
4 Research Methodology
4.1 Research Process 26
4.2 Primary Research 27
4.3 Secondary Research 28
4.4 Market Size Estimation 29
4.5 Forecast Model 29
5 Market Dynamics
5.1 Introduction 31
5.2 Drivers 32
5.2.1 Increasing Use In Animal Nutrition 32
5.2.2 Surging Demand In The Food Industry 33
5.2.3 Drivers Impact Analysis 33
5.3 Restraints 34
5.3.1 Emergence Of Substitutes 34
5.3.2 Restraints Impact Analysis 34
5.4 Opportunities 35
5.4.1 Growing Use Of Baking Soda As A Deodorizing Agent In Personal Care Products 35
5.5 Challenges 35
5.5.1 Environmental Impact And Health Hazards 35
6 Market Factor Analysis
6.1 Supply Chain Analysis 37
6.1.1 Raw Material Suppliers 37
6.1.2 Sodium Bicarbonate Producers 37
6.1.3 Distribution Channel 37
6.1.4 End-Use Industry 38
6.2 Porter’s Five Forces Model 38
6.2.1 Threat Of New Entrants 38
6.2.2 Threat Of Rivalry 38
6.2.3 Threat Of Substitutes 38
6.2.4 Bargaining Power Of Suppliers 39
6.2.5 Bargaining Power Of Buyers 39
7 Global Sodium Bicarbonate Market, By Grade
7.1 Introduction 41
7.2 Feed 43
7.3 Food 44
7.4 Technical 45
7.5 Pharmaceutical 46
8 Global Sodium Bicarbonate Market, By End-User
8.1 Introduction 48
8.2 Animal Feed 51
8.3 Food & Beverages 52
8.4 Flue Gas Treatment 53
8.5 Personal Care & Pharmaceuticals 54
8.6 Detergents & Cleaning Agents 55
8.7 Haemodialysis 56
8.8 Agriculture 57
8.9 Chemicals 58
8.10 Textile 59
8.11 Others 60
9 Global Sodium Bicarbonate Market, By Region
9.1 Introduction 62
9.2 North America 67
9.2.1 U.S. 70
9.2.2 Canada 73
9.3 Europe 76
9.3.1 Germany 80
9.3.2 France 83
9.3.3 Spain 86
9.3.4 Russia 89
9.3.5 UK 92
9.3.6 Italy 95
9.3.7 Poland 98
9.3.8 Rest Of Europe 101
9.4 Asia Pacific 104
9.4.1 China 108
9.4.2 India 111
9.4.3 South Korea 114
9.4.4 Japan 117
9.4.5 Rest Of Asia Pacific 120
9.5 Latin America 123
9.5.1 Brazil 127
9.5.2 Mexico 130
9.5.3 Argentina 133
9.5.4 Rest Of Latin America 136
9.6 The Middle East And Africa 139
9.6.1 Turkey 143
9.6.2 Saudi Arabia 146
9.6.3 UAE 149
9.6.4 Rest Of Middle East And Africa 152
10 Competitive Landscape
10.1 Introduction 156
10.2 Global Market Strategy Analysis 156
11 Company Profiles
11.1 Solvay 159
11.1.1 Company Overview 159
11.1.2 Financial Overview 159
11.1.3 Products Offered 160
11.1.4 Key Developments 160
11.1.5 SWOT Analysis 161
11.1.6 Key Strategies 161
11.2 Tata Chemicals Ltd 162
11.2.1 Company Overview 162
11.2.2 Financial Overview 162
11.2.3 Products Offered 163
11.2.4 Key Developments 163
11.2.5 SWOT Analysis 163
11.2.6 Key Strategies 163
11.3 CIECH Group 164
11.3.1 Company Overview 164
11.3.2 Financial Overview 164
11.3.3 Products Offered 165
11.3.4 Key Developments 165
11.3.5 SWOT Analysis 165
11.3.6 Key Strategy 165
11.4 Şişecam Group 166
11.4.1 Company Overview 166
11.4.2 Financial Overview 166
11.4.3 Products Offered 167
11.4.4 Key Developments 167
11.4.5 SWOT Analysis 167
11.4.6 Key Strategy 167
11.5 Church & Dwight Co., Inc. 168
11.5.1 Company Overview 168
11.5.2 Financial Overview 168
11.5.3 Products Offered 169
11.5.4 Key Developments 169
11.5.5 SWOT Analysis 169
11.5.6 Key Strategies 169
11.6 Tosoh Corporation 170
11.6.1 Company Overview 170
11.6.2 Financial Overview 170
11.6.3 Products Offered 171
11.6.4 Key Developments 171
11.6.5 SWOT Analysis 171
11.6.6 Key Strategies 171
11.7 AGC Inc 172
11.7.1 Company Overview 172
11.7.2 Financial Overview 172
11.7.3 Products Offered 173
11.7.4 Key Developments 173
11.7.5 SWOT Analysis 173
11.7.6 Key Strategies 173
11.8 Novacap 174
11.8.1 Company Overview 174
11.8.2 Financial Overview 174
11.8.3 Products Offered 174
11.8.4 Key Developments 174
11.8.5 SWOT Analysis 175
11.8.6 Key Strategies 175
11.9 NATURAL SODA LLC 176
11.9.1 Company Overview 176
11.9.2 Financial Overview 176
11.9.3 Products Offered 176
11.9.4 Key Developments 176
11.9.5 SWOT Analysis 177
11.9.6 Key Strategies 177
11.10 KAZAN SODA ELEKTRIK 178
11.10.1 Company Overview 178
11.10.2 Financial Overview 178
11.10.3 Products Offered 178
11.10.4 Key Developments 178
11.10.5 SWOT Analysis 178
11.10.6 Key Strategies 178
11.11 Bashkir Soda Company 179
11.11.1 Company Overview 179
11.11.2 Financial Overview 179
11.11.3 Products Offered 179
11.11.4 Key Developments 179
11.11.5 SWOT Analysis 179
11.11.6 Key Strategies 179
12 Conclusion
13 List Of Tables
TABLE 1 MARKET SYNOPSIS 16
TABLE 2 LIST OF ASSUMPTIONS 19
TABLE 3 GLOBAL SODIUM BICARBONATE, BY GRADE, 2020-2027 (USD MILLION) 41
TABLE 4 GLOBAL SODIUM BICARBONATE MARKET, BY GRADE, 2020-2027 (KILO TONS) 42
TABLE 5 GLOBAL SODIUM BICARBONATE MARKET FOR FEED, BY REGION, 2020-2027 (USD MILLION) 43
TABLE 6 GLOBAL SODIUM BICARBONATE MARKET FOR FEED, BY REGION, 2020-2027 (KILO TONS) 43
TABLE 7 GLOBAL SODIUM BICARBONATE MARKET FOR FOOD, BY REGION, 2020-2027 (USD MILLION) 44
TABLE 8 GLOBAL SODIUM BICARBONATE MARKET FOR FOOD, BY REGION, 2020-2027 (KILO TONS) 44
TABLE 9 GLOBAL SODIUM BICARBONATE MARKET FOR TECHNICAL, BY REGION, 2020-2027 (USD MILLION) 45
TABLE 10 GLOBAL SODIUM BICARBONATE MARKET FOR TECHNICAL, BY REGION, 2020-2027 (KILO TONS) 45
TABLE 11 GLOBAL SODIUM BICARBONATE MARKET FOR PHARMACEUTICAL, BY REGION, 2020-2027 (USD MILLION) 46
TABLE 12 GLOBAL SODIUM BICARBONATE MARKET FOR PHARMACEUTICAL, BY REGION, 2020-2027 (KILO TONS) 46
TABLE 13 GLOBAL SODIUM BICARBONATE, BY END-USER, 2020-2027 (USD MILLION) 48
TABLE 14 GLOBAL SODIUM BICARBONATE MARKET, BY END-USER, 2020-2027 (KILO TONS) 50
TABLE 15 GLOBAL SODIUM BICARBONATE MARKET FOR ANIMAL FEED, BY REGION, 2020-2027 (USD MILLION) 51
TABLE 16 GLOBAL SODIUM BICARBONATE MARKET FOR ANIMAL FEED, BY REGION, 2020-2027 (KILO TONS) 51
TABLE 17 GLOBAL SODIUM BICARBONATEMARKET FOR FOOD & BEVERAGES, BY REGION, 2020-2027 (USD MILLION) 52
TABLE 18 GLOBAL SODIUM BICARBONATE MARKET FOR FOOD & BEVERAGES, BY REGION, 2020-2027 (KILO TONS) 52
TABLE 19 GLOBAL SODIUM BICARBONATE MARKET FOR FLUE GAS TREATMENT, BY REGION, 2020-2027 (USD MILLION) 53
TABLE 20 GLOBAL SODIUM BICARBONATEMARKET FOR FLUE GAS TREATMENT, BY REGION, 2020-2027 (KILO TONS) 53
TABLE 21 GLOBAL SODIUM BICARBONATE MARKET FOR PERSONAL CARE & PHARMACEUTICALS, BY REGION, 2020-2027 (USD MILLION) 54
TABLE 22 GLOBAL SODIUM BICARBONATEMARKET FOR PERSONAL CARE & PHARMACEUTICALS, BY REGION, 2020-2027 (KILO TONS) 54
TABLE 23 GLOBAL SODIUM BICARBONATE MARKET FOR DETERGENTS & CLEANING AGENTS, BY REGION, 2020-2027 (USD MILLION) 55
TABLE 24 GLOBAL SODIUM BICARBONATEMARKET FOR DETERGENTS & CLEANING AGENTS, BY REGION, 2020-2027 (KILO TONS) 55
TABLE 25 GLOBAL SODIUM BICARBONATE MARKET FOR HAEMODIALYSIS, BY REGION, 2020-2027 (USD MILLION) 56
TABLE 26 GLOBAL SODIUM BICARBONATEMARKET FOR HAEMODIALYSIS, BY REGION, 2020-2027 (KILO TONS) 56
TABLE 27 GLOBAL SODIUM BICARBONATE MARKET FOR AGRICULTURE, BY REGION, 2020-2027 (USD MILLION) 57
TABLE 28 GLOBAL SODIUM BICARBONATEMARKET FOR AGRICULTURE, BY REGION, 2020-2027 (KILO TONS) 57
TABLE 29 GLOBAL SODIUM BICARBONATE MARKET FOR CHEMICALS, BY REGION, 2020-2027 (USD MILLION) 58
TABLE 30 GLOBAL SODIUM BICARBONATEMARKET FOR CHEMICALS, BY REGION, 2020-2027 (KILO TONS) 58
TABLE 31 GLOBAL SODIUM BICARBONATE MARKET FOR TEXTILE, BY REGION, 2020-2027 (USD MILLION) 59
TABLE 32 GLOBAL SODIUM BICARBONATEMARKET FOR TEXTILE, BY REGION, 2020-2027 (KILO TONS) 59
TABLE 33 GLOBAL SODIUM BICARBONATE MARKET FOR OTHERS, BY REGION, 2020-2027 (USD MILLION) 60
TABLE 34 GLOBAL SODIUM BICARBONATE MARKET FOR OTHERS, BY REGION, 2020-2027 (KILO TONS) 60
TABLE 35 GLOBAL SODIUM BICARBONATE MARKET, BY REGION, 2020-2027 (USD MILLION) 62
TABLE 36 GLOBAL SODIUM BICARBONATE MARKET, BY REGION, 2020-2027 (KILO TONS) 63
TABLE 37 GLOBAL SODIUM BICARBONATE MARKET, BY GRADE, 2020-2027 (USD MILLION) 64
TABLE 38 GLOBAL SODIUM BICARBONATE MARKET, BY GRADE, 2020-2027 (KILO TONS) 64
TABLE 39 GLOBAL SODIUM BICARBONATE MARKET, BY END-USER, 2020-2027 (USD MILLION) 65
TABLE 40 GLOBAL SODIUM BICARBONATE MARKET, BY END-USER, 2020-2027 (KILO TONS) 66
TABLE 41 NORTH AMERICA SODIUM BICARBONATE MARKET, BY COUNTRY, 2020-2027 (USD MILLION) 67
TABLE 42 NORTH AMERICA SODIUM BICARBONATEMARKET, BY COUNTRY, 2020-2027 (KILO TONS) 67
TABLE 43 NORTH AMERICA SODIUM BICARBONATE MARKET, BY GRADE, 2020-2027 (USD MILLION) 67
TABLE 44 NORTH AMERICA SODIUM BICARBONATE MARKET, BY GRADE, 2020-2027 (KILO TONS) 68
TABLE 45 NORTH AMERICA SODIUM BICARBONATE MARKET, BY END-USER, 2020-2027 (USD MILLION) 68
TABLE 46 NORTH AMERICA SODIUM BICARBONATE MARKET, BY END-USER, 2020-2027 (KILO TONS) 69
TABLE 47 U.S. SODIUM BICARBONATE MARKET, BY GRADE, 2020-2027 (USD MILLION) 70
TABLE 48 U.S. SODIUM BICARBONATE MARKET, BY GRADE, 2020-2027 (KILO TONS) 70
TABLE 49 U.S. SODIUM BICARBONATE MARKET, BY END-USER, 2020-2027 (USD MILLION) 71
TABLE 50 U.S. SODIUM BICARBONATEMARKET, BY END-USER, 2020-2027 (KILO TONS) 72
TABLE 51 CANADA SODIUM BICARBONATE MARKET, BY GRADE, 2020-2027 (USD MILLION) 73
TABLE 52 CANADA SODIUM BICARBONATE MARKET, BY GRADE, 2020-2027 (KILO TONS) 73
TABLE 53 CANADA SODIUM BICARBONATEMARKET, BY END-USER, 2020-2027 (USD MILLION) 74
TABLE 54 CANADA SODIUM BICARBONATEMARKET, BY END-USER, 2020-2027 (KILO TONS) 75
TABLE 55 EUROPE SODIUM BICARBONATE MARKET, BY COUNTRY, 2020-2027 (USD MILLION) 76
TABLE 56 EUROPE SODIUM BICARBONATE MARKET, BY COUNTRY, 2020-2027 (KILO TONS) 76
TABLE 57 EUROPE SODIUM BICARBONATE MARKET, BY GRADE, 2020-2027 (USD MILLION) 77
TABLE 58 EUROPE SODIUM BICARBONATE MARKET, BY GRADE, 2020-2027 (KILO TONS) 77
TABLE 59 EUROPE SODIUM BICARBONATE MARKET, BY END-USER, 2020-2027 (USD MILLION) 78
TABLE 60 EUROPE SODIUM BICARBONATE MARKET, BY END-USER, 2020-2027 (KILO TONS) 79
TABLE 61 GERMANY SODIUM BICARBONATE MARKET, BY GRADE, 2020-2027 (USD MILLION) 80
TABLE 62 GERMANY SODIUM BICARBONATE MARKET, BY GRADE, 2020-2027 (KILO TONS) 80
TABLE 63 GERMANY SODIUM BICARBONATE MARKET, BY END-USER, 2020-2027 (USD MILLION) 81
TABLE 64 GERMANY SODIUM BICARBONATE MARKET, BY END-USER, 2020-2027 (KILO TONS) 82
TABLE 65 FRANCE SODIUM BICARBONATE MARKET, BY GRADE, 2020-2027 (USD MILLION) 83
TABLE 66 FRANCE SODIUM BICARBONATE MARKET, BY GRADE, 2020-2027 (KILO TONS) 83
TABLE 67 FRANCE SODIUM BICARBONATE MARKET, BY END-USER, 2020-2027 (USD MILLION) 84
TABLE 68 FRANCE SODIUM BICARBONATE MARKET, BY END-USER, 2020-2027 (KILO TONS) 85
TABLE 69 SPAIN SODIUM BICARBONATE MARKET, BY GRADE, 2020-2027 (USD MILLION) 86
TABLE 70 SPAIN SODIUM BICARBONATE MARKET, BY GRADE, 2020-2027 (KILO TONS) 86
TABLE 71 SPAIN SODIUM BICARBONATE MARKET, BY END-USER, 2020-2027 (USD MILLION) 87
TABLE 72 SPAIN SODIUM BICARBONATE MARKET, BY END-USER, 2020-2027 (KILO TONS) 88
TABLE 73 RUSSIA SODIUM BICARBONATE MARKET, BY GRADE, 2020-2027 (USD MILLION) 89
TABLE 74 RUSSIA SODIUM BICARBONATE MARKET, BY GRADE, 2020-2027 (KILO TONS) 89
TABLE 75 RUSSIA SODIUM BICARBONATE MARKET, BY END-USER, 2020-2027 (USD MILLION) 90
TABLE 76 RUSSIA SODIUM BICARBONATE MARKET, BY END-USER, 2020-2027 (KILO TONS) 91
TABLE 77 UK SODIUM BICARBONATE MARKET, BY GRADE, 2020-2027 (USD MILLION) 92
TABLE 78 UK SODIUM BICARBONATE MARKET, BY GRADE, 2020-2027 (KILO TONS) 92
TABLE 79 UK SODIUM BICARBONATEMARKET, BY END-USER, 2020-2027 (USD MILLION) 93
TABLE 80 UK SODIUM BICARBONATEMARKET, BY END-USER, 2020-2027 (KILO TONS) 94
TABLE 81 ITALY SODIUM BICARBONATE MARKET, BY GRADE, 2020-2027 (USD MILLION) 95
TABLE 82 ITALY SODIUM BICARBONATE MARKET, BY GRADE, 2020-2027 (KILO TONS) 95
TABLE 83 ITALY SODIUM BICARBONATE MARKET, BY END-USER, 2020-2027 (USD MILLION) 96
TABLE 84 ITALY SODIUM BICARBONATE MARKET, BY END-USER, 2020-2027 (KILO TONS) 97
TABLE 85 POLAND SODIUM BICARBONATE MARKET, BY GRADE, 2020-2027 (USD MILLION) 98
TABLE 86 POLAND SODIUM BICARBONATE MARKET, BY GRADE, 2020-2027 (KILO TONS) 98
TABLE 87 POLAND SODIUM BICARBONATE MARKET, BY END-USER, 2020-2027 (USD MILLION) 99
TABLE 88 POLAND SODIUM BICARBONATE MARKET, BY END-USER, 2020-2027 (KILO TONS) 100
TABLE 89 REST OF EUROPE SODIUM BICARBONATE MARKET, BY GRADE, 2020-2027 (USD MILLION) 101
TABLE 90 REST OF EUROPE SODIUM BICARBONATE MARKET, BY GRADE, 2020-2027 (KILO TONS) 101
TABLE 91 REST OF EUROPE SODIUM BICARBONATE MARKET, BY END-USER, 2020-2027 (USD MILLION) 102
TABLE 92 REST OF EUROPE SODIUM BICARBONATE MARKET, BY END-USER, 2020-2027 (KILO TONS) 103
TABLE 93 ASIA PACIFIC SODIUM BICARBONATE MARKET, BY COUNTRY, 2020-2027 (USD MILLION) 104
TABLE 94 ASIA PACIFIC SODIUM BICARBONATE MARKET, BY COUNTRY, 2020-2027 (KILO TONS) 104
TABLE 95 ASIA PACIFIC SODIUM BICARBONATE MARKET, BY GRADE, 2020-2027 (USD MILLION) 105
TABLE 96 ASIA PACIFIC SODIUM BICARBONATE MARKET, BY GRADE, 2020-2027 (KILO TONS) 105
TABLE 97 ASIA PACIFIC SODIUM BICARBONATE MARKET, BY END-USER, 2020-2027 (USD MILLION) 106
TABLE 98 ASIA PACIFIC SODIUM BICARBONATE MARKET, BY END-USER, 2020-2027 (KILO TONS) 107
TABLE 99 CHINA SODIUM BICARBONATE MARKET, BY GRADE, 2020-2027 (USD MILLION) 108
TABLE 100 CHINA SODIUM BICARBONATE MARKET, BY GRADE, 2020-2027 (KILO TONS) 108
TABLE 101 CHINA SODIUM BICARBONATE MARKET, BY END-USER, 2020-2027 (USD MILLION) 109
TABLE 102 CHINA SODIUM BICARBONATEMARKET, BY END-USER, 2020-2027 (KILO TONS) 110
TABLE 103 INDIA SODIUM BICARBONATE MARKET, BY GRADE, 2020-2027 (USD MILLION) 111
TABLE 104 INDIA SODIUM BICARBONATE MARKET, BY GRADE, 2020-2027 (KILO TONS) 111
TABLE 105 INDIA SODIUM BICARBONATE MARKET, BY END-USER, 2020-2027 (USD MILLION) 112
TABLE 106 INDIA SODIUM BICARBONATE MARKET, BY END-USER, 2020-2027 (KILO TONS) 113
TABLE 107 SOUTH KOREA SODIUM BICARBONATE MARKET, BY GRADE, 2020-2027 (USD MILLION) 114
TABLE 108 SOUTH KOREA SODIUM BICARBONATE MARKET, BY GRADE, 2020-2027 (KILO TONS) 114
TABLE 109 SOUTH KOREA SODIUM BICARBONATE MARKET, BY END-USER, 2020-2027 (USD MILLION) 115
TABLE 110 SOUTH KOREA SODIUM BICARBONATE MARKET, BY END-USER, 2020-2027 (KILO TONS) 116
TABLE 111 JAPAN SODIUM BICARBONATE MARKET, BY GRADE, 2020-2027 (USD MILLION) 117
TABLE 112 JAPAN SODIUM BICARBONATE MARKET, BY GRADE, 2020-2027 (KILO TONS) 117
TABLE 113 JAPAN SODIUM BICARBONATE MARKET, BY END-USER, 2020-2027 (USD MILLION) 118
TABLE 114 JAPAN SODIUM BICARBONATEMARKET, BY END-USER, 2020-2027 (KILO TONS) 119
TABLE 115 REST OF ASIA PACIFIC SODIUM BICARBONATE MARKET, BY GRADE, 2020-2027 ( USD MILLION) 120
TABLE 116 REST OF ASIA PACIFIC SODIUM BICARBONATE MARKET, BY GRADE, 2020-2027 (KILO TONS) 120
TABLE 117 REST OF ASIA PACIFIC SODIUM BICARBONATE MARKET, BY END-USER, 2020-2027 (USD MILLION) 121
TABLE 118 REST OF ASIA PACIFIC SODIUM BICARBONATE MARKET, BY END-USER, 2020-2027 (KILO TONS) 122
TABLE 119 LATIN AMERICA SODIUM BICARBONATE MARKET, BY COUNTRY, 2020-2027 (USD MILLION) 123
TABLE 120 LATIN AMERICA SODIUM BICARBONATE MARKET, BY COUNTRY, 2020-2027 (KILO TONS) 123
TABLE 121 LATIN AMERICA SODIUM BICARBONATE MARKET, BY GRADE, 2020-2027 (USD MILLION) 124
TABLE 122 LATIN AMERICA SODIUM BICARBONATE MARKET, BY GRADE, 2020-2027 (KILO TONS) 124
TABLE 123 LATIN AMERICA SODIUM BICARBONATE MARKET, BY END-USER, 2020-2027 (USD MILLION) 125
TABLE 124 LATIN AMERICA SODIUM BICARBONATE MARKET, BY END-USER, 2020-2027 (KILO TONS) 126
TABLE 125 BRAZIL SODIUM BICARBONATE MARKET, BY GRADE, 2020-2027 (USD MILLION) 127
TABLE 126 BRAZIL SODIUM BICARBONATE MARKET, BY GRADE, 2020-2027 (KILO TONS) 127
TABLE 127 BRAZIL SODIUM BICARBONATE MARKET, BY END-USER, 2020-2027 (USD MILLION) 128
TABLE 128 BRAZIL SODIUM BICARBONATE MARKET, BY END-USER, 2020-2027 (KILO TONS) 129
TABLE 129 MEXICO SODIUM BICARBONATE MARKET, BY GRADE, 2020-2027 (USD MILLION) 130
TABLE 130 MEXICO SODIUM BICARBONATE MARKET, BY GRADE, 2020-2027 (KILO TONS) 130
TABLE 131 MEXICO SODIUM BICARBONATE MARKET, BY END-USER, 2020-2027 (USD MILLION) 131
TABLE 132 MEXICO SODIUM BICARBONATE MARKET, BY END-USER, 2020-2027 (KILO TONS) 132
TABLE 133 ARGENTINA SODIUM BICARBONATE MARKET, BY GRADE, 2020-2027 (USD MILLION) 133
TABLE 134 ARGENTINA SODIUM BICARBONATE MARKET, BY GRADE, 2020-2027 (KILO TONS) 133
TABLE 135 ARGENTINA SODIUM BICARBONATE MARKET, BY END-USER, 2020-2027 (USD MILLION) 134
TABLE 136 ARGENTINA SODIUM BICARBONATE MARKET, BY END-USER, 2020-2027 (KILO TONS) 135
TABLE 137 REST OF LATIN AMERICA SODIUM BICARBONATE MARKET, BY GRADE, 2020-2027 (USD MILLION) 136
TABLE 138 REST OF LATIN AMERICA SODIUM BICARBONATE MARKET, BY GRADE, 2020-2027 (KILO TONS) 136
TABLE 139 REST OF LATIN AMERICA SODIUM BICARBONATE MARKET, BY END-USER, 2020-2027 (USD MILLION) 137
TABLE 140 REST OF LATIN AMERICA SODIUM BICARBONATE MARKET, BY END-USER, 2020-2027 (KILO TONS) 138
TABLE 141 THE MIDDLE EAST AND AFRICA SODIUM BICARBONATE MARKET, BY COUNTRY, 2020-2027 (USD MILLION) 139
TABLE 142 THE MIDDLE EAST AND AFRICA SODIUM BICARBONATE MARKET, BY COUNTRY, 2020-2027 (KILO TONS) 139
TABLE 143 THE MIDDLE EAST AND AFRICA SODIUM BICARBONATE MARKET, BY GRADE, 2020-2027 (USD MILLION) 140
TABLE 144 THE MIDDLE EAST AND AFRICA SODIUM BICARBONATE MARKET, BY GRADE, 2020-2027 (KILO TONS) 140
TABLE 145 THE MIDDLE EAST AND AFRICA SODIUM BICARBONATE MARKET, BY END-USER, 2020-2027 (USD MILLION) 141
TABLE 146 THE MIDDLE EAST AND AFRICA SODIUM BICARBONATEMARKET, BY END-USER, 2020-2027 (KILO TONS) 142
TABLE 147 TURKEY SODIUM BICARBONATE MARKET, BY GRADE, 2020-2027 (USD MILLION) 143
TABLE 148 TURKEY SODIUM BICARBONATE MARKET, BY GRADE, 2020-2027 (KILO TONS) 143
TABLE 149 TURKEY SODIUM BICARBONATE MARKET, BY END-USER, 2020-2027 (USD MILLION) 144
TABLE 150 TURKEY SODIUM BICARBONATE MARKET, BY END-USER, 2020-2027 (KILO TONS) 145
TABLE 151 SAUDI ARABIA SODIUM BICARBONATE MARKET, BY GRADE, 2020-2027 (USD MILLION) 146
TABLE 152 SAUDI ARABIA SODIUM BICARBONATE MARKET, BY GRADE, 2020-2027 (KILO TONS) 146
TABLE 153 SAUDI ARABIA SODIUM BICARBONATEMARKET, BY END-USER, 2020-2027 (USD MILLION) 147
TABLE 154 SAUDI ARABIA SODIUM BICARBONATEMARKET, BY END-USER, 2020-2027 (KILO TONS) 148
TABLE 155 UAE SODIUM BICARBONATE MARKET, BY GRADE, 2020-2027 (USD MILLION) 149
TABLE 156 UAE SODIUM BICARBONATE MARKET, BY GRADE, 2020-2027 (KILO TONS) 149
TABLE 157 UAE SODIUM BICARBONATE MARKET, BY END-USER, 2020-2027 (USD MILLION) 150
TABLE 158 UAE SODIUM BICARBONATE MARKET, BY END-USER, 2020-2027 (KILO TONS) 151
TABLE 159 REST OF MIDDLE EAST AND AFRICA SODIUM BICARBONATE MARKET, BY GRADE, 2020-2027 (USD MILLION) 152
TABLE 160 REST OF MIDDLE EAST AND AFRICA SODIUM BICARBONATE MARKET, BY GRADE, 2020-2027 (KILO TONS) 152
TABLE 161 REST OF MIDDLE EAST AND AFRICA SODIUM BICARBONATE MARKET, BY END-USER, 2020-2027 (USD MILLION) 153
TABLE 162 REST OF MIDDLE EAST AND AFRICA SODIUM BICARBONATE MARKET, BY END-USER, 2020-2027 (KILO TONS) 154
TABLE 163 KEY DEVELOPMENTS OVERVIEW 156
14 List Of Figures
FIGURE 1 GLOBAL SODIUM BICARBONATE MARKET: MARKET STRUCTURE 20
FIGURE 2 KEY TAKEAWAYS OF THE GLOBAL SODIUM BICARBONATE MARKET 20
FIGURE 3 NORTH AMERICA: MARKET SIZE AND MARKET SHARE, BY COUNTRY (2020-2027) 22
FIGURE 4 EUROPE: MARKET SIZE AND MARKET SHARE, BY COUNTRY (2020-2027) 22
FIGURE 5 ASIA-PACIFIC: MARKET SIZE AND MARKET SHARE, BY COUNTRY (2020-2027) 23
FIGURE 6 LATIN AMERICA: MARKET SIZE AND MARKET SHARE, BY COUNTRY (2020-2027) 23
FIGURE 7 MIDDLE EAST & AFRICA: MARKET SIZE AND MARKET SHARE, BY COUNTRY (2020-2027) 24
FIGURE 8 RESEARCH PROCESS OF MRFR 26
FIGURE 9 TOP-DOWN & BOTTOM-UP APPROACHES 29
FIGURE 10 MARKET DYNAMICS OVERVIEW 31
FIGURE 11 GLOBAL ANNUAL FEED PRODUCTION, MILLION TONS (2020) 32
FIGURE 12 DRIVERS IMPACT ANALYSIS 33
FIGURE 13 RESTRAINTS IMPACT ANALYSIS 34
FIGURE 14 SUPPLY CHAIN ANALYSIS 37
FIGURE 15 PORTER'S FIVE FORCES ANALYSIS OF THE GLOBAL SODIUM BICARBONATE MARKET 38
FIGURE 16 GLOBAL SODIUM BICARBONATE MARKET, BY GRADE, 2020-2027 (USD MILLION) 41
FIGURE 17 GLOBAL SODIUM BICARBONATE MARKET, BY GRADE, 2020-2027 (KILO TONS) 42
FIGURE 18 GLOBAL SODIUM BICARBONATE MARKET, BY END-USER, 2020-2027 (USD MILLION) 48
FIGURE 19 GLOBAL SODIUM BICARBONATE MARKET, BY END-USER, 2020-2027 (KILO TONS) 49
FIGURE 20 GLOBAL SODIUM BICARBONATE MARKET BY REGION, 2017 (VALUE %) 62
FIGURE 21 GLOBAL SODIUM BICARBONATE MARKET BY REGION, 2020-2027 (KILO TONS) 63
$13 Billion
4.85%
North America
2022-2030
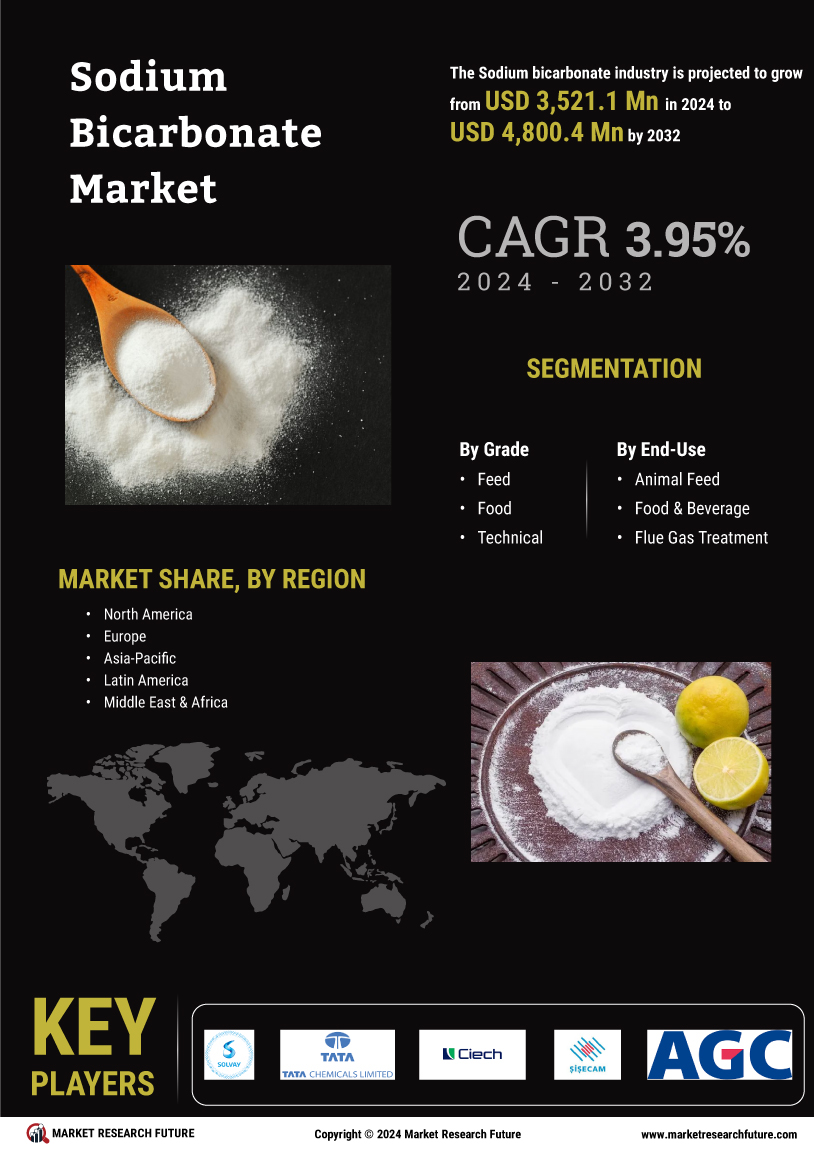
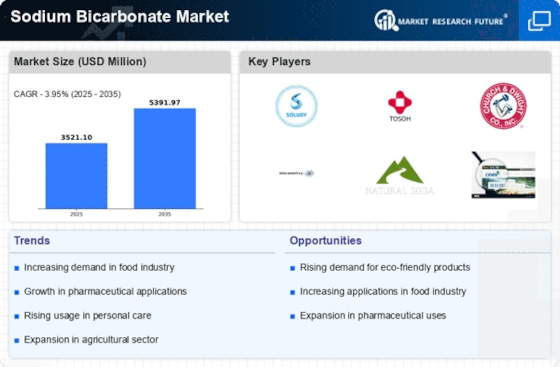
Sodium Bicarbonate Market is set to witness a compound annual growth rate of USD 13 Billion at 4.85% during the forecast period (2022-2030).
A substantial percentage of the world's supply is employed by the feed and food industry, while the pharmaceutical, chemical, and textile industries also utilize some quantities. Occasionally, the growing Food and Beverage industry supports the sodium bicarbonate market growth globally.
Baking soda or sodium hydrogen carbonate are commonly known names for sodium bicarbonate. Xanthan Gum is a crystalline powder or granule that is odorless and slightly salty with a cooling effect. When dissolved in water, it becomes somewhat soluble. Baking products, detergents, and cleaning products often contain it, so it is an important ingredient. During the forecast period, the market is expected to benefit from growing bakery sales and rising detergent consumption. Growth in the sodium bicarbonate market is also expected to be boosted by a rapid increase in demand for over-the-counter drugs.
As a result of the COVID-19 pandemic, the sodium bicarbonate industry has been negatively impacted. The consumer market is experiencing a series of severe shocks across many segments of end-use markets, while global supply chains are disintegrating and the competitive landscape for manufacturers/producers continues to alter. Chemical manufacturers worldwide have gone over their capacity due to a deficiency of demand. After restrictions on travel subside, there is supposed to be an inevitable return to normal after the social distancing that follows. An adverse impact on human health can be a constraint on the growth of the market during the forecast period.
A large number of players are active across the globe in the sodium bicarbonate market. The market is dominated by Tosoh Corporation, Şişecam Group, Solvay SA, AGC Inc, Church & Dwight Company, Novacap, Bashkir Soda Company, Kazan Soda Elektrik, Ciner Group, Tata Chemicals, Natural Soda, and Ciech Group. By increasing production capacity, the company hopes to expand its penetration in Asia Pacific's emerging economies. A salt bicarbonate plant of the biggest capacity in South East Asia has been commissioned by it in Thailand with the ability to produce 10,000 tons of this critical substance annually to serve the food, health, and other markets in Asia.
Drivers
Driving Market Growth is Rising Adoption Among Food and Beverage Manufacturers
Sodium bicarbonate is used extensively in other industries, too, besides food and beverage. Food and beverage products can be used to leaven cakes and pastries, absorb odors, wash fruit, and clean (for example). In addition to providing consistency and extending shelf life, bicarbonate of sodium is also used to prevent foods from turning rancid. In recent years, sodium bicarbonate has seen a surge in demand due to packaged foods. The package and ready-to-eat food market have been impacted by changes in consumer preferences and lifestyles. In the coming years, demand for sodium bicarbonate will increase as baking products gain in popularity. As more people use baking soda in products other than food, its demand is increasing. Also popular is sodium bicarbonate as an active ingredient in personal care products.
Opportunities
Growth Avenue for Market Players Offered by the Demand-Supply Gap
With the demand-supply gap, food producers have the opportunity to expand their worldwide distribution network and to develop profitable international operations.
Restraints
Market Growth is Stymied by the Adoption of Alternative Products
Although sodium bicarbonate may experience a slight growth slowdown in medical and food applications due to the arrival of alternatives. Sodium bicarbonate is also associated with health risks and environmental consequences. The businesses' doubts about sodium bicarbonate and its alleged adverse health effects, however, somewhat dampen the business plan's optimism.
With the help of digital technology and integrated processes, market players are focusing on boosting productivity. According to reports, sodium bicarbonate technology is forecast to gain significant traction. In terms of global market shares, sodium bicarbonate of technical grade will hold 40% of the market.
Market segments are analyzed by end-user, grade, and region for the global sodium bicarbonate market.
By Grade
Grade-based market classification segregates the feed, food, technological, and medicinal markets. In the current market situation, the feed market holds a majority share of the total market. According to market projections for the next few years, this segment will grow at a moderate speed to reach 45.05 percent of the market by 2018. Market demand for sodium bicarbonate is significant in the animal nutrition sector. A rise in animal feed production has led to an increased demand for sodium bicarbonate. On the other hand, food and beverage manufacturers are expected to grow at a much higher rate during the measurement period. A large part of this can be attributed to an increase in baking soda use in bakery and confectionery goods. According to industry forecasts, the bakery industry will continue to be on the rise at an impressive pace, therefore fueling the market for food-grade baking soda.
By End-Use
Industry segments include animal feed, food and beverage processing, flue gas treatment, pharmaceuticals, and personal care products, detergents and cleaning agents, hemodialysis, agriculture, chemicals, and textiles, among others, depending on each industry's end-user. This segment of the market is expected to remain extremely attractive during the analysis period. As of today, the segment represents USD 300 Mn in value and is expected to register a CAGR of more than 20%. Since sodium bicarbonate has such desirable properties, it is widely used in animal feed as an additive to enhance its consistency, thereby enhancing its nutritional value. In addition to goats, chickens, broilers, turkeys, and pigs, it can also be found in hens, hen products, and chicken feed. Growing meat consumption drives the market for feed-in parts worldwide, as the meat industry must increase its supply. According to predictions, the food & beverage market in 2023 is expected to grow nicely. This segment of the market is growing due to the growing number of applications for sodium bicarbonate in the food and beverage industry.
In the exploration of the global market for semiconductors, four major regions were considered, including Asia-Pacific, North America, Europe, and the rest of the world.
North American Growth is Driven by Research and Development
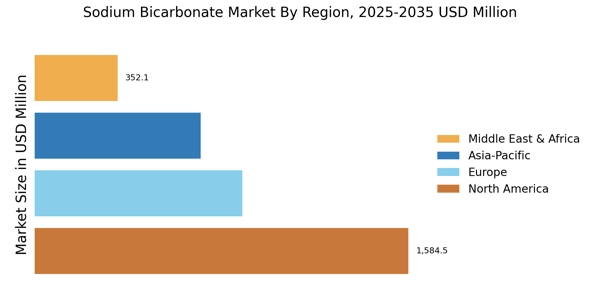
As industry demand grows from end-use industries such as animal feed, food production, pesticides, pharmaceuticals, and water treatment, the North American market is anticipated to show strong growth. A good government R&D funding program is intended to increase the reach of applications as well.
Pharmaceutical Sector in Europe is Expanding at a Rapid Pace
The growth of the pharmaceutical industry, the well-established personal care industry, and the growing demand for meat and eggs are all due to the market share controlled by the European zone, which is reflected in the demand for sodium hydrogen carbonate. Due to the increased growth in the sodium bicarbonate industry in this region, poultry farming has become more important, the pharmaceutical industry is growing, and the personal care industry is expanding.
Expanding End-Use Sectors in APAC is Expected to Lead
The study analyzes business climate and trends around the world, as well as the overall market climate. Each sub-segment in the study is described along with estimates for the sales growth at the provincial and national levels. This report explains the sodium bicarbonate market in detail, providing market size, forecast, along with a discussion of key trends and growth drivers.
The market for sodium bicarbonate is segmented by MRFR according to its research.
MRFR's research includes a detailed segmental overview of the global sodium bicarbonate market for the scope of the review.
By Grade
By End-User
Report Attribute/Metric | Details |
---|---|
Market Size |
|
CAGR | 4.85% (2022–2030) |
Base Year | 2021 |
Forecast Period | 2022-2030 |
Historical Data | 2019 & 2020 |
Forecast Units | Value (USD Million) |
Report Coverage | Revenue Forecast, Competitive Landscape, Growth Factors, and Trends |
Segments Covered | By Grade, End-Use Industry and Region |
Geographies Covered | North America, Europe, Asia-Pacific, and Rest of the World (RoW) |
Key Vendors | Solvay,Tata Chemicals Ltd,CIECH Group,Şişecam Group,Church & Dwight Co., Inc.,Tosoh Corporation,AGC Inc,Novacap,NATURAL SODA LLC,KAZAN SODA ELEKTRIK,Bashkir Soda Company |
Key Market Opportunities | Demand-Supply Gap to Create Growth Avenues for Market Players |
Key Market Drivers | Growing Adoption from F&B Sector to Drive Market Growth |
Frequently Asked Questions (FAQ) :
With 4.85% CAGR, the sodium Bicarbonate market is expected to grow between 2018 and 2030, the forecast period.
The global sodium Bicarbonate market would settle for a valuation of USD 1300 million by 2030.
Health and environmental implications are likely to constrain future sodium bicarbonate market growth.
In the sodium bicarbonate markets, feed grade is in a position to lead.
Sodium bicarbonate market valuation is expected to reach its highest level among animal feed segments.
Global Sodium Bicarbonate Market: Competitive Landscape
The major players operating in the global sodium bicarbonate are Solvay, Tata Chemicals Ltd, CIECH Group, Şişecam Group, Church & Dwight Co., Inc., Tosoh Corporation, AGC Inc, Novacap, NATURAL SODA LLC, KAZAN SODA ELEKTRIK, and Bashkir Soda Company.
Tosoh Corporation, AGC Inc, Solvay, Church & Dwight Co., Inc., and Şişecam Group are the manufacturing companies which collectively account for the majority share of the zinc oxide market. The market is fragmented and comprises of players which are operational in the Japan, Belgium, US, and Turkey. The players operating in the market are emphasizing new product developments and expansions to gain maximum revenue. There is a growing demand from various end-use industries such as animal feed, food & beverages, flue gas treatment, personal care & pharmaceuticals, detergents & cleaning agents, haemodialysis, agriculture, chemicals, and textile. There is a strong competition between companies as there are large number of companies manufacturing zinc oxide.
In July 2018, Solvay announced the modernization of its gas cogeneration units at its soda ash and bicarbonate facility in Bernburg, Germany, with an investment of USD 56.1 million. This investment will enable the company to strengthen its market position while maintaining its present production capacity. In January 2018, Solvay expanded its sodium bicarbonate production capacity in Rheinberg, Germany. The company is investing USD 7.3 million and aims at starting operations by the end of 2018. With this expansion, the company will be able to deliver SOLVAir SB 0/3, a ready-to-use solution for reducing pollutant atmospheric emissions in industries, which will help them meet the most stringent environmental regulations.
Tosoh Corporation focuses on strengthening its commodity operations to secure steady cash flow and profitability for enhancing the production capacity and other resources.
AGC Inc offers a diverse lineup of products ranging from architectural glass, automotive glass, display glass, electronic materials, and high-function materials such as chemicals and ceramics for customers across a wide range of industries. AGC Inc strives to achieve sustainable growth through strategic mergers and acquisitions and concentrate management resources in developing regions.
Church & Dwight Co., Inc strives to maintain the competitive marketing and trade spending, develop and launch new and differentiated products. The company also intends to increase its product sales globally and provide premium and value brand products to appeal to a wide range of consumers.
Şişecam Group is an industrial group conducting operations on an international scale in the fields of flat glass, glassware, glass packaging, and chemicals. Şişecam carries out its production activities at 43 production facilities in 13 countries and selling its products in over 150 countries. The international sales constitute more than half of the Group’s total sales. Şişecam is Turkey’s leader in all types of glass products as well as chemicals including soda-chromium compounds.