Security Orchestration Automation and Response Market Segmentation
Security Orchestration Automation and Response Market By Application (USD Billion, 2025-2035)
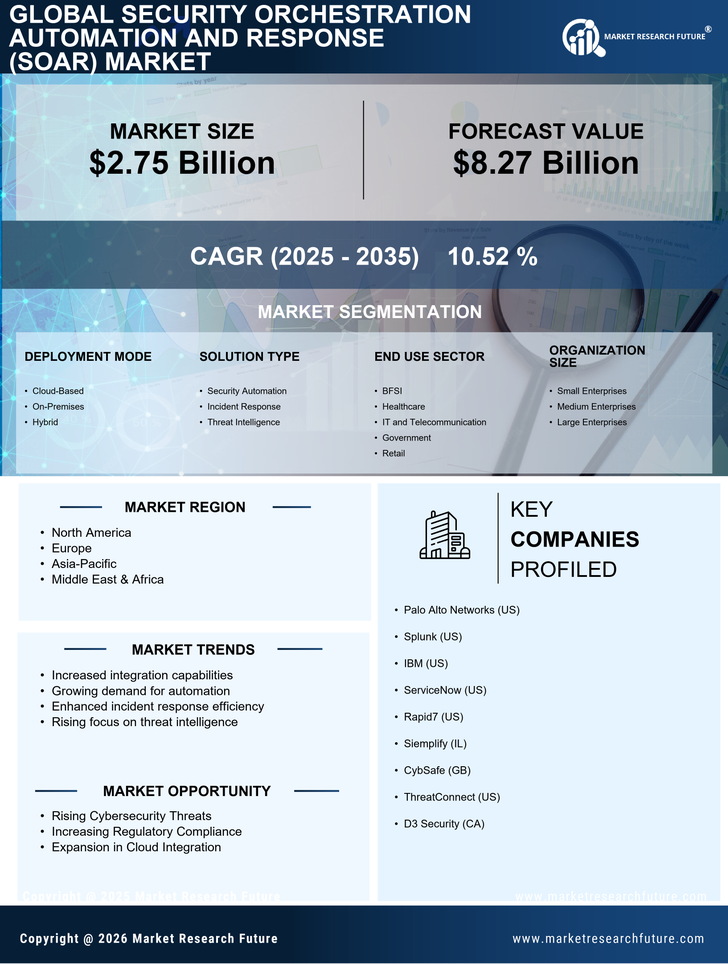
- Incident Response
- Threat Intelligence
- Security Information Management
- Compliance Management
Security Orchestration Automation and Response Market By End Use (USD Billion, 2025-2035)
- BFSI
- Healthcare
- IT and Telecom
- Government
Security Orchestration Automation and Response Market By Deployment Type (USD Billion, 2025-2035)
- Cloud-Based
- On-Premises
- Hybrid
Security Orchestration Automation and Response Market By Organization Size (USD Billion, 2025-2035)
- Small Enterprises
- Medium Enterprises
- Large Enterprises
Security Orchestration Automation and Response Market By Service Type (USD Billion, 2025-2035)
- Managed Services
- Professional Services
- Training and Support