Remote Tank Monitoring System Market (2026 - 2035)

ID: MRFR/ICT/30034-HCR 100 Pages Nirmit Biswas Last Updated: October 14, 2026
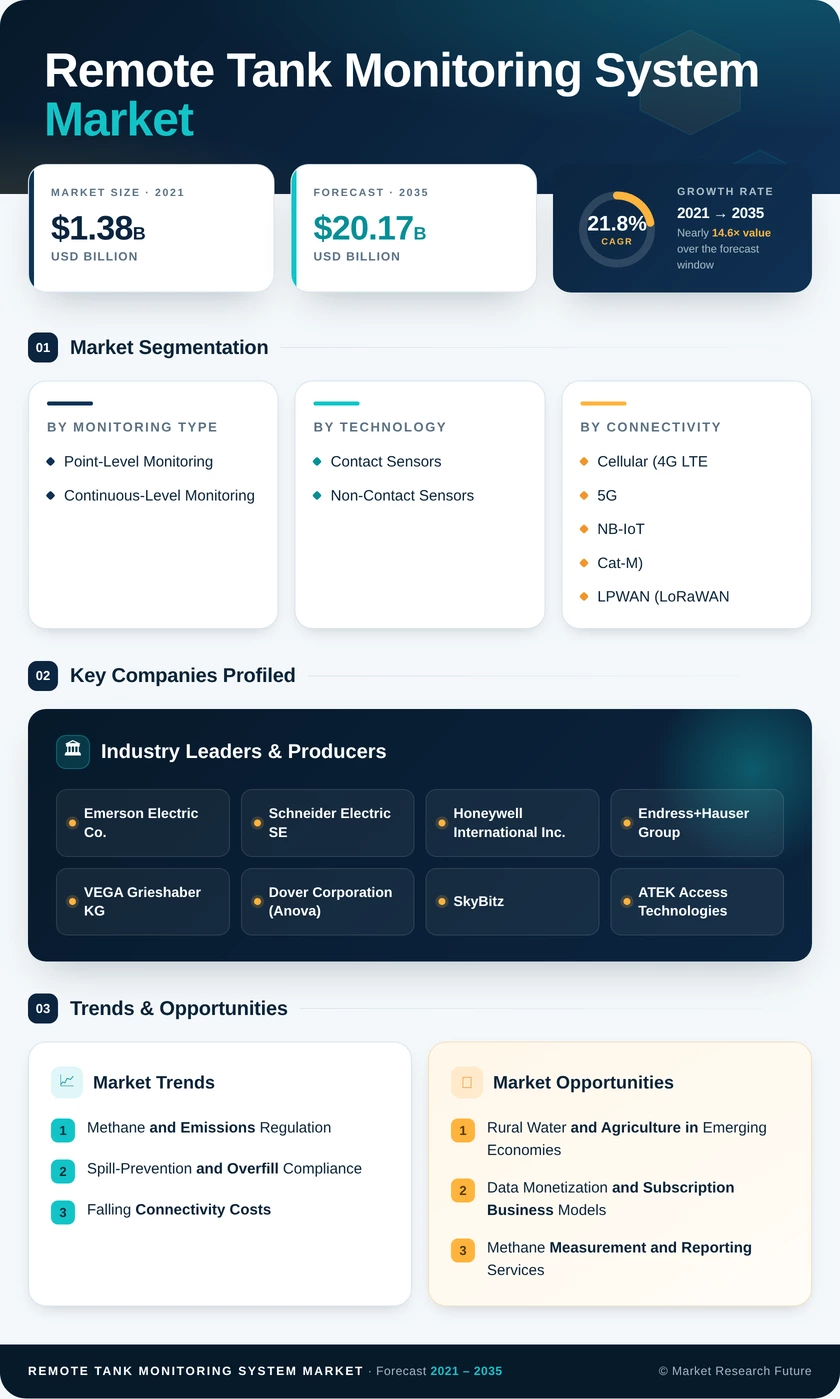
Remote Tank Monitoring System Market Size, Share and Research Report By Monitoring Type (Point-Level Monitoring, Continuous-Level Monitoring), By Technology (Contact Sensors, Non-Contact Sensors), By Connectivity (Cellular (4G LTE, 5G, NB-IoT, Cat-M), LPWAN (LoRaWAN, Sigfox), Satellite (LEO / GEO), Short-Range RF / Wi-Fi / BLE), By Tank Type (Above-Ground Fixed-Roof, Above-Ground Floating-Roof, Underground / UST), By End-User Industry (Oil and Gas, Chemicals and Petrochemicals, Water and Wastewater, Food and Beverage, Agriculture and Irrigation, Power Generation, Mining and Metals, Pharmaceuticals and Healthcare), By Service Model (Stand-alone Hardware Sales, Hardware-as-a-Service (HaaS) Subscription, Fully Managed Turnkey Platforms) and By Regional (North America, Europe, South America, Asia Pacific, Middle East and Africa) - Industry Forecast to 2035.
Remote Tank Monitoring System Market
Market Size
Forecast Period2026-2035
CAGR (2026-2035)21.8%
2025 Market SizeUSD 2.83 Billion
2035 Market SizeUSD 20.17 Billion
Key Players
Emerson Electric Co.
Schneider Electric SE
Honeywell International Inc.
Endress+Hauser Group
VEGA Grieshaber KG
Dover Corporation
Opportunities
  • Rural Water and Agriculture in Emerging Economies
  • Data Monetization and Subscription Business Models
  • Methane Measurement and Reporting Services
  1. 1 Market Summary | |
  2. 2 Key Report Takeaways | |
    1. 2.1 By Monitoring Type | |
    2. 2.2 By Technology | |
    3. 2.3 By Connectivity | |
    4. 2.4 By Tank Type | |
    5. 2.5 By End-User Industry | |
    6. 2.6 By Service Model | |
    7. 2.7 By Region | |
  3. 3 Market Size and Forecast (2021–2035) | |
    1. 3.1 Historical Market Size (2021–2025) | |
    2. 3.2 Forecast Market Size (2026–2035) | |
    3. 3.3 Year-over-Year Growth Analysis | |
  4. 4 Driver Impact Analysis | |
    1. 4.1 Methane and Emissions Regulation | |
    2. 4.2 Spill-Prevention and Overfill Compliance | |
    3. 4.3 Falling Connectivity Costs | |
    4. 4.4 Distributor Logistics and Vendor-Managed Inventory | |
    5. 4.5 Water Scarcity and Precision Agriculture | |
    6. 4.6 LEO Satellite Coverage for Off-Grid Assets | |
  5. 5 Restraints Impact Analysis | |
    1. 5.1 High Retrofit Cost in Hazardous Areas | |
    2. 5.2 Cybersecurity Exposure of Connected OT | |
    3. 5.3 2G/3G Network Sunsets and Coverage Gaps | |
    4. 5.4 Integration with Legacy SCADA and ERP | |
    5. 5.5 Battery Life and Field Maintenance | |
  6. 6 Opportunities | |
    1. 6.1 Rural Water and Agriculture in Emerging Economies | |
    2. 6.2 Data Monetization and Subscription Business Models | |
    3. 6.3 Methane Measurement and Reporting Services | |
    4. 6.4 Hybrid Satellite-Cellular Coverage for Remote Assets | |
    5. 6.5 Energy-Transition Fuels and Feedstocks | |
  7. 7 Regional Market Share and Country-Level Analysis | |
    1. 7.1 North America | | |
      1. 7.1.1 United States | | |
      2. 7.1.2 Canada | | |
      3. 7.1.3 Mexico | |
    2. 7.2 Europe | | |
      1. 7.2.1 United Kingdom | | |
      2. 7.2.2 Germany | | |
      3. 7.2.3 France | | |
      4. 7.2.4 Italy | | |
      5. 7.2.5 Spain | | |
      6. 7.2.6 Russia | | |
      7. 7.2.7 Rest of Europe | |
    3. 7.3 Asia-Pacific | | |
      1. 7.3.1 China | | |
      2. 7.3.2 Japan | | |
      3. 7.3.3 India | | |
      4. 7.3.4 South Korea | | |
      5. 7.3.5 Australia and New Zealand | | |
      6. 7.3.6 Southeast Asia | | |
      7. 7.3.7 Rest of Asia-Pacific | |
    4. 7.4 South America | | |
      1. 7.4.1 Brazil | | |
      2. 7.4.2 Argentina | | |
      3. 7.4.3 Rest of South America | |
    5. 7.5 Middle East & Africa | | |
      1. 7.5.1 Saudi Arabia | | |
      2. 7.5.2 United Arab Emirates | | |
      3. 7.5.3 Turkey | | |
      4. 7.5.4 Rest of Middle East | | |
      5. 7.5.5 South Africa | | |
      6. 7.5.6 Nigeria | | |
      7. 7.5.7 Kenya | | |
      8. 7.5.8 Rest of Africa | |
  8. 8 Future Outlook (2026–2035) | |
    1. 8.1 Predictive Replenishment and Autonomous Dispatch | |
    2. 8.2 Platform Economics and Recurring Revenue | |
    3. 8.3 Storage for Energy-Transition Fuels | |
    4. 8.4 Emissions Reporting and ESG Disclosure | |
  9. 9 Segmentation Analysis | |
    1. 9.1 By Monitoring Type | | |
      1. 9.1.1 Point-Level Monitoring | | |
      2. 9.1.2 Continuous-Level Monitoring | |
    2. 9.2 By Technology | | |
      1. 9.2.1 Contact Sensors | | |
      2. 9.2.2 Non-Contact Sensors | |
    3. 9.3 By Connectivity | | |
      1. 9.3.1 Cellular (4G LTE, 5G, NB-IoT, Cat-M) | | |
      2. 9.3.2 LPWAN (LoRaWAN, Sigfox) | | |
      3. 9.3.3 Satellite (LEO / GEO) | | |
      4. 9.3.4 Short-Range RF / Wi-Fi / BLE | |
    4. 9.4 By Tank Type | | |
      1. 9.4.1 Above-Ground Fixed-Roof | | |
      2. 9.4.2 Above-Ground Floating-Roof | | |
      3. 9.4.3 Underground / UST | |
    5. 9.5 By End-User Industry | | |
      1. 9.5.1 Oil and Gas | | |
      2. 9.5.2 Chemicals and Petrochemicals | | |
      3. 9.5.3 Water and Wastewater | | |
      4. 9.5.4 Food and Beverage | | |
      5. 9.5.5 Agriculture and Irrigation | | |
      6. 9.5.6 Power Generation | | |
      7. 9.5.7 Mining and Metals | | |
      8. 9.5.8 Pharmaceuticals and Healthcare | |
    6. 9.6 By Service Model | | |
      1. 9.6.1 Stand-alone Hardware Sales | | |
      2. 9.6.2 Hardware-as-a-Service (HaaS) Subscription | | |
      3. 9.6.3 Fully Managed Turnkey Platforms | |
  10. 10 Competitive Landscape | |
    1. 10.1 Market Concentration Analysis | |
    2. 10.2 Competitive Benchmarking Matrix | |
    3. 10.3 Company Profiles | | |
      1. 10.3.1 Emerson Electric Co. | | |
      2. 10.3.2 Schneider Electric SE | | |
      3. 10.3.3 Honeywell International Inc. | | |
      4. 10.3.4 Endress+Hauser Group | | |
      5. 10.3.5 VEGA Grieshaber KG | | |
      6. 10.3.6 Dover Corporation (Anova) | | |
      7. 10.3.7 SkyBitz | | |
      8. 10.3.8 ATEK Access Technologies | | |
      9. 10.3.9 Otodata Wireless Network Inc. | | |
      10. 10.3.10 Franklin Fueling Systems | |
  11. 11 Recent News & Developments | |
  12. 12 Report Scope and Methodology | |
  13. 13 Detailed Sources and Citations | |
  14. 14 Frequently Asked Questions (FAQs) | | LIST OF TABLES | |
  15. TABLE 1 Market Snapshot, 2025–2035 | |
  16. TABLE 2 Global Market Size & Forecast, by Revenue (USD Billion), 2021–2035 | |
  17. TABLE 3 Driver Impact Analysis | |
  18. TABLE 4 Restraints Impact Analysis | |
  19. TABLE 5 Regional Market Summary, 2025 | |
  20. TABLE 6 North America Market, by Country, 2025 | |
  21. TABLE 7 Europe Market, by Country, 2025 | |
  22. TABLE 8 Asia-Pacific Market, by Country, 2025 | |
  23. TABLE 9 South America Market, by Country, 2025 | |
  24. TABLE 10 Middle East & Africa Market, by Country, 2025 | |
  25. TABLE 11 Market Segmentation, by Monitoring Type | |
  26. TABLE 12 Market Segmentation, by Technology | |
  27. TABLE 13 Market Segmentation, by Connectivity | |
  28. TABLE 14 Market Segmentation, by Tank Type | |
  29. TABLE 15 Market Segmentation, by End-User Industry | |
  30. TABLE 16 Market Segmentation, by Service Model | |
  31. TABLE 17 Competitive Benchmarking Matrix, 2025 | |
  32. TABLE 18 Report Scope and Methodology | |
  33. TABLE 19 Detailed Sources and Citations | |
  34. TABLE 20 Segmentation Quick Reference | | LIST OF FIGURES | |
  35. FIGURE 1 Market Dynamics Overview (Drivers, Restraints, Opportunities) | |
  36. FIGURE 2 Industry Value Chain Analysis | |
  37. FIGURE 3 Porter's Five Forces Analysis | |
  38. FIGURE 4 Global Market Size Trend, 2021–2035 (USD Billion) | |
  39. FIGURE 5 Year-over-Year Growth Rate, 2022–2035 | |
  40. FIGURE 6 Market Share by Monitoring Type, 2025 | |
  41. FIGURE 7 Market Share by Technology, 2025 | |
  42. FIGURE 8 Market Share by Connectivity, 2025 | |
  43. FIGURE 9 Market Share by Tank Type, 2025 | |
  44. FIGURE 10 Market Share by End-User Industry, 2025 | |
  45. FIGURE 11 Market Share by Service Model, 2025 | |
  46. FIGURE 12 Regional Market Share, 2025 | |
  47. FIGURE 13 Regional Growth Comparison, 2026–2035 | |
  48. FIGURE 14 Competitive Landscape Positioning Map, 2025 | |
  49. FIGURE 15 Estimated Revenue Share Ranges of Key Players, 2025

Segmentation Quick Reference

DimensionSub-SegmentsDominant SegmentFastest Growing Segment
By Monitoring TypePoint-Level Monitoring; Continuous-Level MonitoringContinuous-Level Monitoring (63.2% share)Continuous-Level Monitoring (63.2% share)
By TechnologyContact Sensors; Non-Contact SensorsNon-Contact Sensors (60.6% share)Contact Sensors (22.0% CAGR)
By ConnectivityCellular (4G LTE, 5G, NB-IoT, Cat-M); LPWAN (LoRaWAN, Sigfox); Satellite (LEO / GEO); Short-Range RF / Wi-Fi / BLECellular (4G LTE, 5G, NB-IoT, Cat-M) (49.3% share)Satellite (LEO / GEO) (22.4% CAGR)
By Tank TypeAbove-Ground Fixed-Roof; Above-Ground Floating-Roof; Underground / USTAbove-Ground Fixed-Roof (45.8% share)Above-Ground Floating-Roof (22.1% CAGR)
By End-User IndustryOil and Gas; Chemicals and Petrochemicals; Water and Wastewater; Food and Beverage; Agriculture and Irrigation; Power Generation; Mining and Metals; Pharmaceuticals and HealthcareOil and Gas (30.4% share)Agriculture and Irrigation (22.5% CAGR)
By Service ModelStand-alone Hardware Sales; Hardware-as-a-Service (HaaS) Subscription; Fully Managed Turnkey PlatformsStand-alone Hardware Sales (55.6% share)Hardware-as-a-Service (HaaS) Subscription (22.2% CAGR)
By RegionNorth America; Europe; Asia-Pacific; South America; Middle East & AfricaNorth America (38.6% share)Asia-Pacific (25.1% CAGR)

Market Segmentation Overview

By Monitoring Type

Sub-SegmentKey Trend
Point-Level MonitoringHigh/low alarms retained for low-value, non-hazardous liquids
Continuous-Level MonitoringReal-time level records demanded by spill and emissions rules

Continuous-Level Monitoring leads and also grows faster than Point-Level Monitoring because SPCC programs and European emissions permits favor uninterrupted level records. Continuous data also feeds consumption forecasts and leak detection, which point alarms cannot support. Point-Level Monitoring survives where a single threshold alert is enough, mainly on water and lubricant tanks.

By Technology

Sub-SegmentKey Trend
Contact SensorsMagnetostrictive and Hydrostatic Pressure probes replacing Float and Tape Gauge units
Non-Contact Sensors80 GHz Radar / FMCW displacing older designs; Ultrasonic for cost-sensitive tanks

Non-Contact Sensors dominate because radar measures through vapor and foam without wetted parts or routine maintenance. Contact Sensors post the faster growth as terminals replace aging Float and Tape Gauge devices with Magnetostrictive probes that meet custody-transfer accuracy. Optical / Laser units remain a niche for narrow vessels and bulk solids.

By Connectivity

Sub-SegmentKey Trend
Cellular (4G LTE, 5G, NB-IoT, Cat-M)Low-power plans extend battery life and cut monthly fees
LPWAN (LoRaWAN, Sigfox)Private networks across dense tank farms and campuses
Satellite (LEO / GEO)Smaller, cheaper LEO terminals reach off-grid sites
Short-Range RF / Wi-Fi / BLEIn-plant links to local gateways in hazardous areas

Cellular (4G LTE, 5G, NB-IoT, Cat-M) leads because NB-IoT and Cat-M deliver multi-year battery life at low cost wherever towers exist. Satellite (LEO / GEO) grows fastest as LEO constellations make oil fields, mines and ranches economical to connect. LPWAN (LoRaWAN, Sigfox) suits operators that prefer owning their network across a single large site.

By Tank Type

Sub-SegmentKey Trend
Above-Ground Fixed-RoofBroad use across water, chemical and food storage
Above-Ground Floating-RoofRadar with roof-tilt compensation for crude terminals
Underground / USTRelease-detection compliance at fuel retail sites

Above-Ground Fixed-Roof tanks lead because they house most water, chemical and food liquids, where installation is straightforward. Above-Ground Floating-Roof tanks grow fastest as overfill standards and methane audits push crude terminals to fit radar that tracks moving roofs. Underground / UST demand stays steady on release-detection obligations.

By End-User Industry

Sub-SegmentKey Trend
Oil and GasMidstream and well-pad compliance monitoring
Chemicals and PetrochemicalsHazardous-material safety and online monitoring mandates
Water and WastewaterUtility reservoirs and treatment-chemical tracking
Food and BeverageHygienic storage with batch traceability
Agriculture and IrrigationFertilizer and water tanks linked to variable-rate equipment
Power GenerationBackup fuel and water-treatment chemicals
Mining and MetalsDiesel and reagent tracking at remote sites
Pharmaceuticals and HealthcareValidated storage and GMP-compliant records

Oil and Gas leads because terminals and well pads carry the heaviest spill and methane compliance load. Agriculture and Irrigation grows fastest as farms connect fertilizer and water tanks to precision-application equipment, supported by public cost-share grants. Chemicals and Petrochemicals and Water and Wastewater provide the next largest, steadier demand pools.

By Service Model

Sub-SegmentKey Trend
Stand-alone Hardware SalesCapex ownership at refineries and pipelines
Hardware-as-a-Service (HaaS) SubscriptionOpex bundles for distributors and cooperatives
Fully Managed Turnkey PlatformsOutsourced installation, connectivity and analytics

Stand-alone Hardware Sales lead because large refineries and pipeline operators prefer to own devices and integrate them into existing control systems. Hardware-as-a-Service (HaaS) Subscription grows fastest as propane dealers and farm cooperatives move spending from capex to predictable monthly fees. Fully Managed Turnkey Platforms win operators that lack in-house IT capacity.

6 minutes ago

Download PDF ×

We do not share your information with anyone. However, we may send you emails based on your report interest from time to time. You may contact us at any time to opt-out.