Segmentation Quick Reference
| Dimension | Sub-Segments | Dominant Segment | Fastest Growing Segment |
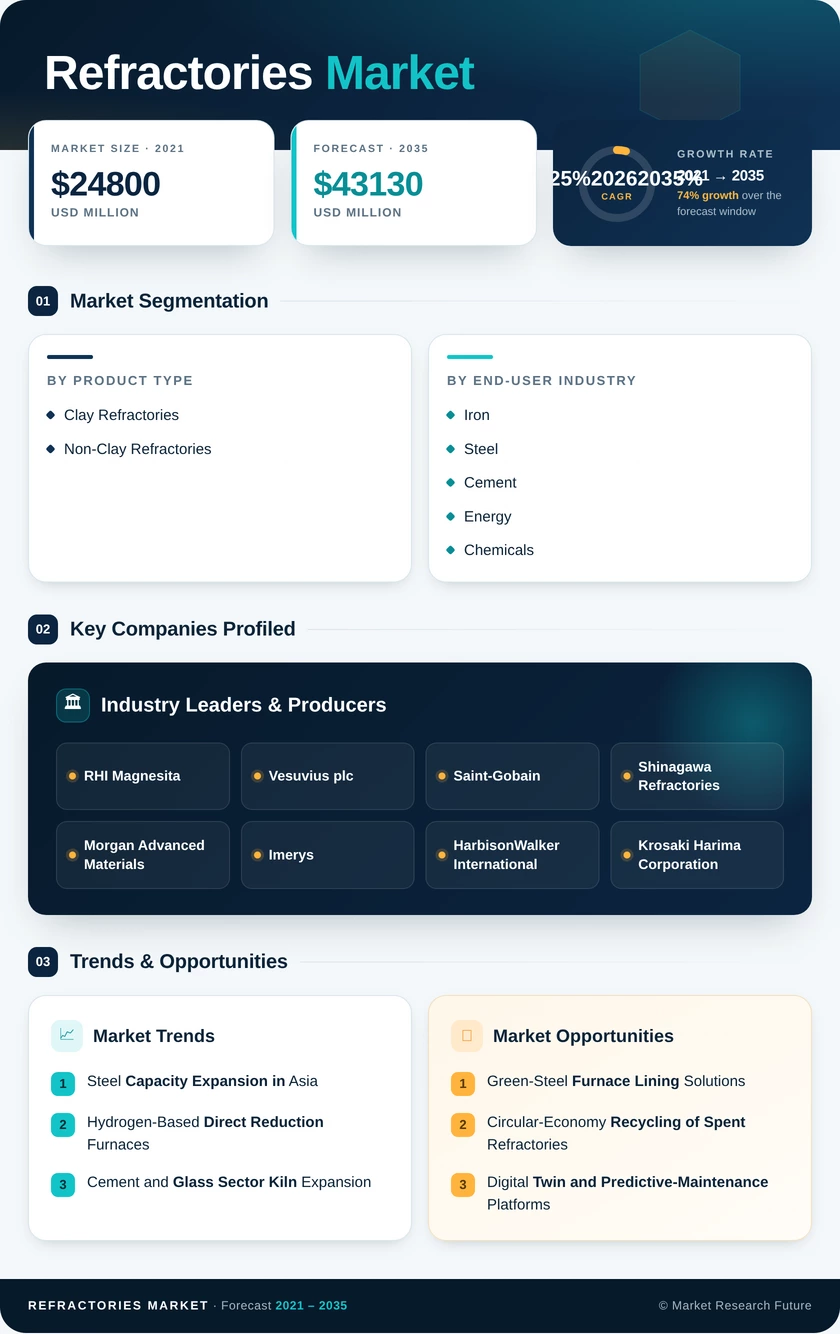
| By Product Type | Clay Refractories, Non-Clay Refractories | Clay Refractories | Non-Clay Refractories |
| By End-User Industry | Iron and Steel, Cement, Energy and Chemicals, Non-Ferrous Metals, Glass, Ceramic, Other End-User Industries | Iron and Steel | Cement |
Market Segmentation Overview
By Product Type
| Sub-Segment | Key Trend |
| Clay Refractories | Demand trend aligned with the RD segmentation analysis and regional adoption patterns. |
| Non-Clay Refractories | Demand trend aligned with the RD segmentation analysis and regional adoption patterns. |
By Product Type segmentation follows the same taxonomy used in Section 9 of the RD, keeping the TOC and segmentation add-on aligned with the generated report content.
By End-User Industry
| Sub-Segment | Key Trend |
| Iron and Steel | Demand trend aligned with the RD segmentation analysis and regional adoption patterns. |
| Cement | Demand trend aligned with the RD segmentation analysis and regional adoption patterns. |
| Energy and Chemicals | Demand trend aligned with the RD segmentation analysis and regional adoption patterns. |
| Non-Ferrous Metals | Demand trend aligned with the RD segmentation analysis and regional adoption patterns. |
| Glass | Demand trend aligned with the RD segmentation analysis and regional adoption patterns. |
| Ceramic | Demand trend aligned with the RD segmentation analysis and regional adoption patterns. |
| Other End-User Industries | Demand trend aligned with the RD segmentation analysis and regional adoption patterns. |
By End-User Industry segmentation follows the same taxonomy used in Section 9 of the RD, keeping the TOC and segmentation add-on aligned with the generated report content.