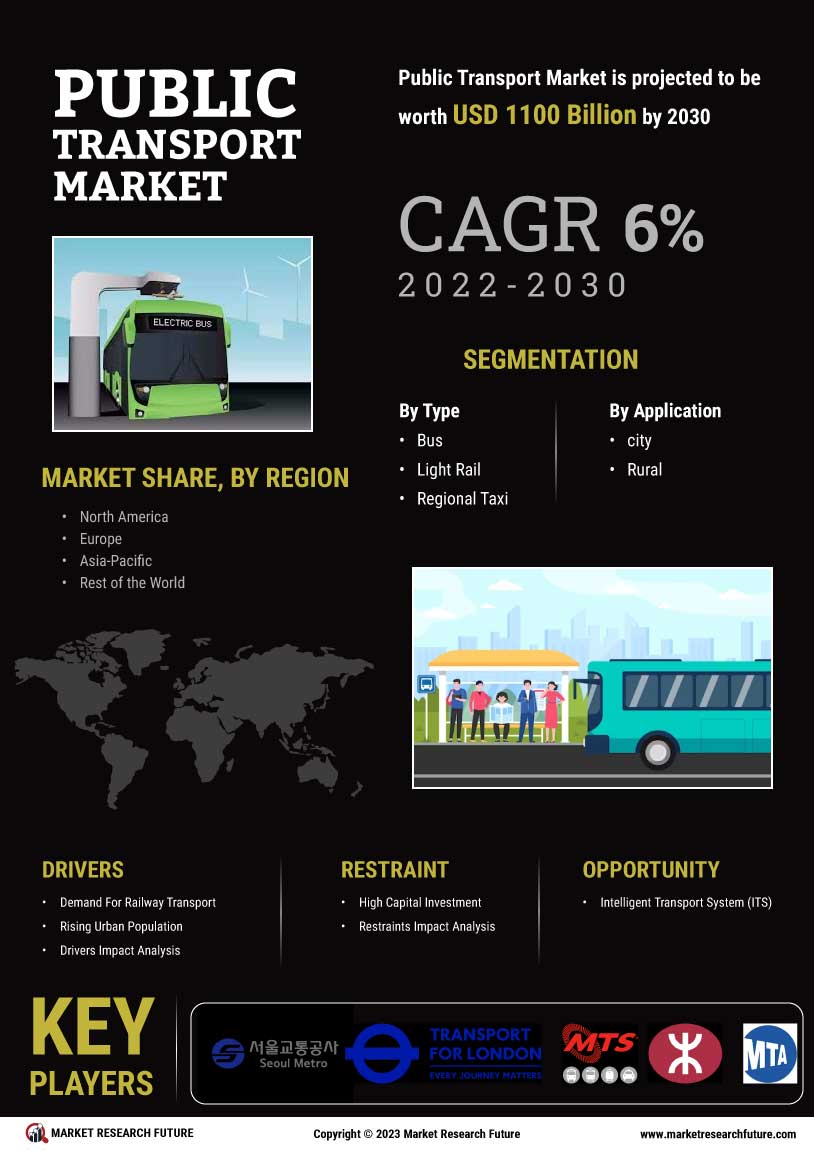
Certified Global Research Member
Isomar fd.webp Wcrc 57.webp
Key Questions Answered
  • Global Market Outlook
  • In-depth analysis of global and regional trends
  • Analyze and identify the major players in the market, their market share, key developments, etc.
  • To understand the capability of the major players based on products offered, financials, and strategies.
  • Identify disrupting products, companies, and trends.
  • To identify opportunities in the market.
  • Analyze the key challenges in the market.
  • Analyze the regional penetration of players, products, and services in the market.
  • Comparison of major players’ financial performance.
  • Evaluate strategies adopted by major players.
  • Recommendations
Why Choose Market Research Future?
  • Vigorous research methodologies for specific market.
  • Knowledge partners across the globe
  • Large network of partner consultants.
  • Ever-increasing/ Escalating data base with quarterly monitoring of various markets
  • Trusted by fortune 500 companies/startups/ universities/organizations
  • Large database of 5000+ markets reports.
  • Effective and prompt pre- and post-sales support.

Public Transport Market Research Report Information by Mobility (Bus, Tram, Train, Car Sharing, Others), By Propulsion (Diesel, Gasoline, Electric, Others), By Ownership Type (Private Owned, Public Owned), By End Use (Intracity, Intercity, Others) and By Region (North America, Europe, Asia-Pacific, Middle East and Africa, South America) –Market Forecast Till 2032


ID: MRFR/AM/7205-CR | 134 Pages | Author: Sejal Akre| October 2020

Research Methodology on Public Transport Market


Abstract


This study articulates a comprehensive analysis of the public transport market, which includes conducting a thorough analysis of market size, penetration, and key market dynamics that shape the industry landscape. This research report identifies and provides an in-depth analysis of the primary market trends, technology trends, and emerging opportunities which can serve to guide and give direction to the key stakeholders of the public transport market.


Introduction


Public transportation is a shared system of transportation including buses, vans, trains, and other forms of conveyance that provides people with a way of getting around their local area. The public transport system is an important part of many cities, providing access to employment, healthcare, and educational opportunities. The public transport market is also an important contributor to economic growth, as it creates job opportunities and encourages economic activity. As a result, it is an important sector of the global economy and continues to experience steady growth.


This research report analyzes the public transport market across various regions, providing insights into the forces which drive the public transport market. Additionally, this report examines the market development within individual regional markets and identifies key market trends which influence the public transport industry.


Research Methodology


This report is based on qualitative and quantitative analysis. The research method used to essentially gain information on market drivers and restraints, trends of the industry and key players involved in the market has been provided below.


1. Primary research:


  • a) Focus group interviews: These interviews are conducted with industry experts to gain firsthand knowledge and insights into current market dynamics, including key issues, and potential new opportunities within the public transport market.

  • b) Surveying: An online survey is administered to a sample of the population which is familiar with the public transport market to gain further insights into market trends and behaviour.

  • Secondary research: Secondary research is conducted to obtain information on the size and growth of the public transport market. Information regarding technological developments and public transport trends, such as the adoption of public transportation, is established through the analysis of various industry reports and journals.


Data Analysis


Data collected through primary and secondary research is analyzed using a combination of quantitative and qualitative methods. Quantitative methods include data analysis, descriptive statistics, and hypothesis testing, while qualitative methods included content analysis and thematic coding. Analyses were conducted on both high-level and detailed market trends in order to gain an overall picture of the public transport market.


Conclusion


This research analyzes the public transport market and identified potential opportunities for stakeholders. The results of the research provide an in-depth understanding of the current market, technological developments, and emerging trends which can be utilized to inform business strategies and industry decision-making. Furthermore, the findings of this research may be used as a guide to develop and implement strategies that capitalize on the public transport market’s growth potential.

Leading companies partner with us for data-driven Insights
client_1 client_2 client_3 client_4 client_5 client_6 client_7 client_8 client_9 client_10
Please fill in Business Email for Quick Response

1 Executive Summary

2 Market Introduction

2.1 Definition 15

2.2 Scope Of The Study 15

2.3 List Of Assumptions 16

2.4 Market Structure 17

2.5 Market Attractiveness Analysis 17

2.6 Global Public Transport Market, By Type 18

2.7 Global Public Transport Market, By Application 19

2.8 Key Buying Criteria 19

3 Research Methodology

3.1 Research Process 20

3.2 Primary Research 21

3.3 Secondary Research 22

3.4 Market Size Estimation 23

3.5 Forecast Model 23

4 Market Insights

5 Market Dynamics

5.1 Introduction 27

5.2 Drivers 28

5.2.1 Demand For Railway Transport 28

5.2.2 Rising Urban Population 29

5.2.3 Drivers Impact Analysis 30

5.3 Restraints 30

5.3.1 High Capital Investment 30

5.3.2 Restraints Impact Analysis 31

5.4 Opportunity 31

5.4.1 Intelligent Transport System (ITS) 31

6 Market Factor Analysis

6.1 Porter’s Five Forces Model 32

6.1.1 Threat Of New Entrants 33

6.1.2 Bargaining Power Of Suppliers 33

6.1.3 Bargaining Power Of Buyers 33

6.1.4 Threat Of Substitutes 33

6.1.5 Rivalry 34

6.2 Supply Chain Analysis 35

6.2.1 Design And Development 36

6.2.2 Raw Material/Component Supply 36

6.2.3 Manufacture/Assembly 36

6.2.4 End Use 36

6.3 Technology Trends 37

6.3.1 New Transport Concept 37

6.3.2 Digitalization In Railways 37

6.4 Patent Trends 38

6.5 Regulatory Landscape 41

7 Global Public Transport Market, By Type

7.1 Overview 42

7.2 Bus 42

7.3 Light Rail 42

7.4 Regional Taxi 42

7.5 Metro 42

7.6 Tram 42

8 Global Public Transport Market, By Application

8.1 Overview 45

8.2 City 45

8.3 Rural 45

9 Global Public Transport Market, By Region

9.1 Introduction 48

9.2 North America 51

9.2.1 US 56

9.2.2 Canada 59

9.2.3 Mexico 62

9.3 Europe 65

9.3.1 Germany 70

9.3.2 France 73

9.3.3 UK 76

9.3.4 Italy 78

9.3.5 Rest Of Europe 81

9.4 Asia-Pacific 84

9.4.1 China 88

9.4.2 India 91

9.4.3 Japan 94

9.4.4 Rest Of Asia-Pacific 96

9.5 Rest Of The World 100

9.5.1 South America 104

9.5.2 Middle East And Africa 106

10 Mobility As A Service Market Analysis

10.1 Overview 110

10.2 Global Mobility As A Service (MAAS) Market, By Service 110

11 Competitive Landscape

11.1 Competitive Overview 112

11.2 Competitive Benchmarking 113

11.3 Key Strategy Analysis 113

11.4 Leading Players (In Terms Of Number Of Developments) In Global Public Transport Market 114

12 Transport Authorities

12.1 Transport For London 115

12.1.1 Company Overview 115

12.1.2 Financial Overview 116

12.1.3 Products/Services Offered 116

12.1.4 Key Developments (2024-2032) 117

12.1.5 SWOT Analysis 117

12.1.6 Key Strategies 117

12.2 MTR Corporation 118

12.2.1 Company Overview 118

12.2.2 Financial Overview 118

12.2.3 Products/Services Offered 119

12.2.4 Key Developments (2024-2032) 119

12.2.5 SWOT Analysis 119

12.2.6 Key Strategies 119

12.3 Bay Area Rapid Transit (BART) 120

12.3.1 Company Overview 120

12.3.2 Financial Overview 120

12.3.3 Products/Services Offered 121

12.3.4 Key Developments (2024-2032) 121

12.3.5 SWOT Analysis 121

12.3.6 Key Strategies 121

12.4 Chicago Transit Authority 122

12.4.1 Company Overview 122

12.4.2 Financial Overview 122

12.4.3 Products/Services Offered 122

12.4.4 Key Developments (2024-2032) 123

12.4.5 SWOT Analysis 123

12.4.6 Key Strategies 123

12.5 The Washington Metropolitan Area Transit Authority 124

12.5.1 Company Overview 124

12.5.2 Financial Overview 124

12.5.3 Products/Services Offered 125

12.5.4 Key Developments (2024-2032) 125

12.5.5 SWOT Analysis 125

12.5.6 Key Strategies 125

12.6 Massachusetts Bay Transportation Authority 126

12.6.1 Company Overview 126

12.6.2 Financial Overview 126

12.6.3 Products/Services Offered 127

12.6.4 Key Developments (2024-2032) 127

12.7 Madrid Metro 128

12.7.1 Company Overview 128

12.7.2 Financial Overview 128

12.7.3 Products/Services Offered 129

12.7.4 Key Developments (2024-2032) 129

12.8 Metropolitan Transportation Authority 130

12.8.1 Company Overview 130

12.8.2 Financial Overview 130

12.8.3 Products/Services Offered 131

12.8.4 Key Developments (2024-2032) 131

12.9 The San Diego Metropolitan Transit System 132

12.9.1 Company Overview 132

12.9.2 Financial Overview 132

12.9.3 Products/Services Offered 133

12.9.4 Key Developments (2024-2032) 133

12.10 SEOUL METRO 134

12.10.1 Company Overview 134

12.10.2 Products/Services Offered 134

12.10.3 Key Developments (2024-2032) 134

13 List Of Tables

TABLE 1 LIST OF ASSUMPTIONS 16

TABLE 2 MAJOR GRANTED PATENTS ON PUBLIC TRANSPORT (AUGUST 10, 2015 – AUGUST 10, 2019) 38

TABLE 3 PUBLIC TRANSPORT: REGULATORY LANDSCAPE 41

TABLE 4 GLOBAL PUBLIC TRANSPORT INVESTMENT, BY TYPE, 2017–2025 (USD MILLION) 43

TABLE 5 GLOBAL PUBLIC TRANSPORT MARKET, BY TYPE, 2017–2025 (UNITS) 44

TABLE 6 GLOBAL PUBLIC TRANSPORT INVESTMENT, BY APPLICATION, 2017–2025 (USD MILLION) 46

TABLE 7 GLOBAL PUBLIC TRANSPORT MARKET, BY APPLICATION, 2017–2025 (UNITS) 46

TABLE 8 GLOBAL PUBLIC TRANSPORT INVESTMENT, BY REGION, 2024-2032 (USD MILLION) 48

TABLE 9 GLOBAL PUBLIC TRANSPORT MARKET, BY COUNTRY, 2024-2032 (UNITS) 50

TABLE 10 NORTH AMERICA: PUBLIC TRANSPORT INVESTMENT, BY COUNTRY, 2024-2032 (USD MILLION) 51

TABLE 11 NORTH AMERICA: PUBLIC TRANSPORT MARKET, BY COUNTRY, 2024-2032 (UNITS) 52

TABLE 12 NORTH AMERICA: PUBLIC TRANSPORT INVESTMENT, BY TYPE, 2024-2032 (USD MILLION) 53

TABLE 13 NORTH AMERICA: PUBLIC TRANSPORT MARKET, BY TYPE, 2024-2032 (UNITS) 53

TABLE 14 NORTH AMERICA: PUBLIC TRANSPORT INVESTMENT, BY APPLICATION, 2024-2032 (USD MILLION) 54

TABLE 15 NORTH AMERICA: PUBLIC TRANSPORT MARKET, BY APPLICATION, 2024-2032 (UNITS) 55

TABLE 16 US: PUBLIC TRANSPORT INVESTMENT, BY TYPE, 2024-2032 (USD MILLION) 56

TABLE 17 US: PUBLIC TRANSPORT MARKET, BY TYPE, 2024-2032 (UNITS) 57

TABLE 18 US: PUBLIC TRANSPORT INVESTMENT, BY APPLICATION, 2024-2032 (USD MILLION) 57

TABLE 19 US: PUBLIC TRANSPORT MARKET, BY APPLICATION, 2024-2032 (UNITS) 58

TABLE 20 CANADA: PUBLIC TRANSPORT INVESTMENT, BY TYPE, 2024-2032 (USD MILLION) 59

TABLE 21 CANADA: PUBLIC TRANSPORT MARKET, BY TYPE, 2024-2032 (UNITS) 60

TABLE 22 CANADA: PUBLIC TRANSPORT INVESTMENT, BY APPLICATION, 2024-2032 (USD MILLION) 60

TABLE 23 CANADA: PUBLIC TRANSPORT MARKET, BY APPLICATION, 2024-2032 (UNITS) 61

TABLE 24 MEXICO: PUBLIC TRANSPORT INVESTMENT, BY TYPE, 2024-2032 (USD MILLION) 62

TABLE 25 MEXICO: PUBLIC TRANSPORT MARKET, BY TYPE, 2024-2032 (UNITS) 63

TABLE 26 MEXICO: PUBLIC TRANSPORT INVESTMENT, BY APPLICATION, 2024-2032 (USD MILLION) 64

TABLE 27 MEXICO: PUBLIC TRANSPORT MARKET, BY APPLICATION, 2024-2032 (UNITS) 64

TABLE 28 EUROPE: PUBLIC TRANSPORT INVESTMENT, BY COUNTRY, 2024-2032 (USD MILLION) 65

TABLE 29 EUROPE: PUBLIC TRANSPORT MARKET, BY COUNTRY, 2024-2032 (UNITS) 66

TABLE 30 EUROPE: PUBLIC TRANSPORT INVESTMENT, BY TYPE, 2024-2032 (USD MILLION) 67

TABLE 31 EUROPE: PUBLIC TRANSPORT MARKET, BY TYPE, 2024-2032 (UNITS) 68

TABLE 32 EUROPE: PUBLIC TRANSPORT INVESTMENT, BY APPLICATION, 2024-2032 (USD MILLION) 69

TABLE 33 EUROPE: PUBLIC TRANSPORT MARKET, BY APPLICATION, 2024-2032 (UNITS) 69

TABLE 34 GERMANY: PUBLIC TRANSPORT INVESTMENT, BY TYPE, 2024-2032 (USD MILLION) 70

TABLE 35 GERMANY: PUBLIC TRANSPORT MARKET, BY TYPE, 2024-2032 (UNITS) 71

TABLE 36 GERMANY: PUBLIC TRANSPORT INVESTMENT, BY APPLICATION, 2024-2032 (USD MILLION) 71

TABLE 37 GERMANY: PUBLIC TRANSPORT MARKET, BY APPLICATION, 2024-2032 (UNITS) 72

TABLE 38 FRANCE: PUBLIC TRANSPORT INVESTMENT, BY TYPE, 2024-2032 (USD MILLION) 73

TABLE 39 FRANCE: PUBLIC TRANSPORT MARKET, BY TYPE, 2024-2032 (UNITS) 74

TABLE 40 FRANCE: PUBLIC TRANSPORT INVESTMENT, BY APPLICATION, 2024-2032 (USD MILLION) 75

TABLE 41 FRANCE: PUBLIC TRANSPORT MARKET, BY APPLICATION, 2024-2032 (UNITS) 75

TABLE 42 UK: PUBLIC TRANSPORT INVESTMENT, BY TYPE, 2024-2032 (USD MILLION) 76

TABLE 43 UK: PUBLIC TRANSPORT MARKET, BY TYPE, 2024-2032 (UNITS) 77

TABLE 44 UK: PUBLIC TRANSPORT INVESTMENT, BY APPLICATION, 2024-2032 (USD MILLION) 77

TABLE 45 UK: PUBLIC TRANSPORT MARKET, BY APPLICATION, 2024-2032 (UNITS) 78

TABLE 46 ITALY: PUBLIC TRANSPORT INVESTMENT, BY TYPE, 2024-2032 (USD MILLION) 78

TABLE 47 ITALY: PUBLIC TRANSPORT MARKET, BY TYPE, 2024-2032 (UNITS) 79

TABLE 48 ITALY: PUBLIC TRANSPORT INVESTMENT, BY APPLICATION, 2024-2032 (USD MILLION) 80

TABLE 49 ITALY: PUBLIC TRANSPORT MARKET, BY APPLICATION, 2024-2032 (UNITS) 80

TABLE 50 REST OF EUROPE: PUBLIC TRANSPORT INVESTMENT, BY TYPE, 2024-2032 (USD MILLION) 81

TABLE 51 REST OF EUROPE: PUBLIC TRANSPORT MARKET, BY TYPE, 2024-2032 (UNITS) 82

TABLE 52 REST OF EUROPE: PUBLIC TRANSPORT INVESTMENT, BY APPLICATION, 2024-2032 (USD MILLION) 83

TABLE 53 REST OF EUROPE: PUBLIC TRANSPORT MARKET, BY APPLICATION, 2024-2032 (UNITS) 83

TABLE 54 ASIA-PACIFIC: PUBLIC TRANSPORT INVESTMENT, BY COUNTRY, 2024-2032 (USD MILLION) 84

TABLE 55 ASIA-PACIFIC: PUBLIC TRANSPORT MARKET, BY COUNTRY, 2024-2032 (UNITS) 85

TABLE 56 ASIA-PACIFIC: PUBLIC TRANSPORT INVESTMENT, BY TYPE, 2024-2032 (USD MILLION) 86

TABLE 57 ASIA-PACIFIC: PUBLIC TRANSPORT MARKET, BY TYPE, 2024-2032 (UNITS) 86

TABLE 58 ASIA-PACIFIC: PUBLIC TRANSPORT INVESTMENT, BY APPLICATION, 2024-2032 (USD MILLION) 87

TABLE 59 ASIA-PACIFIC: PUBLIC TRANSPORT MARKET, BY APPLICATION, 2024-2032 (UNITS) 88

TABLE 60 CHINA: PUBLIC TRANSPORT INVESTMENT, BY TYPE, 2024-2032 (USD MILLION) 89

TABLE 61 CHINA: PUBLIC TRANSPORT MARKET, BY TYPE, 2024-2032 (UNITS) 89

TABLE 62 CHINA: PUBLIC TRANSPORT INVESTMENT, BY APPLICATION, 2024-2032 (USD MILLION) 90

TABLE 63 CHINA: PUBLIC TRANSPORT MARKET, BY APPLICATION, 2024-2032 (UNITS) 91

TABLE 64 INDIA: PUBLIC TRANSPORT INVESTMENT, BY TYPE, 2024-2032 (USD MILLION) 91

TABLE 65 INDIA: PUBLIC TRANSPORT MARKET, BY TYPE, 2024-2032 (UNITS) 92

TABLE 66 INDIA: PUBLIC TRANSPORT INVESTMENT, BY APPLICATION, 2024-2032 (USD MILLION) 93

TABLE 67 INDIA: PUBLIC TRANSPORT MARKET, BY APPLICATION, 2024-2032 (UNITS) 93

TABLE 68 JAPAN: PUBLIC TRANSPORT INVESTMENT, BY TYPE, 2024-2032 (USD MILLION) 94

TABLE 69 JAPAN: PUBLIC TRANSPORT MARKET, BY TYPE, 2024-2032 (UNITS) 95

TABLE 70 JAPAN: PUBLIC TRANSPORT INVESTMENT, BY APPLICATION, 2024-2032 (USD MILLION) 95

TABLE 71 JAPAN: PUBLIC TRANSPORT MARKET, BY APPLICATION, 2024-2032 (UNITS) 96

TABLE 72 REST OF ASIA-PACIFIC: PUBLIC TRANSPORT INVESTMENT, BY TYPE, 2024-2032 (USD MILLION) 97

TABLE 73 REST OF ASIA-PACIFIC: PUBLIC TRANSPORT MARKET, BY TYPE, 2024-2032 (UNITS) 97

TABLE 74 REST OF ASIA-PACIFIC: PUBLIC TRANSPORT INVESTMENT, BY APPLICATION, 2024-2032 (USD MILLION) 98

TABLE 75 REST OF ASIA-PACIFIC: PUBLIC TRANSPORT MARKET, BY APPLICATION, 2024-2032 (UNITS) 99

TABLE 76 REST OF THE WORLD: PUBLIC TRANSPORT INVESTMENT, BY COUNTRY, 2024-2032 (USD MILLION) 100

TABLE 77 REST OF THE WORLD: PUBLIC TRANSPORT MARKET, BY COUNTRY, 2020 (%VOLUME SHARE) 101

TABLE 78 REST OF THE WORLD: PUBLIC TRANSPORT MARKET, BY COUNTRY, 2024-2032 (UNITS) 101

TABLE 79 REST OF THE WORLD: PUBLIC TRANSPORT INVESTMENT, BY TYPE, 2024-2032 (USD MILLION) 101

TABLE 80 REST OF THE WORLD: PUBLIC TRANSPORT MARKET, BY TYPE, 2024-2032 (UNITS) 102

TABLE 81 REST OF THE WORLD: PUBLIC TRANSPORT INVESTMENT, BY APPLICATION, 2024-2032 (USD MILLION) 103

TABLE 82 REST OF THE WORLD: PUBLIC TRANSPORT MARKET, BY APPLICATION, 2024-2032 (UNITS) 103

TABLE 83 SOUTH AMERICA: PUBLIC TRANSPORT INVESTMENT, BY TYPE, 2024-2032 (USD MILLION) 104

TABLE 84 SOUTH AMERICA: PUBLIC TRANSPORT MARKET, BY TYPE, 2024-2032 (UNITS) 105

TABLE 85 SOUTH AMERICA: PUBLIC TRANSPORT INVESTMENT, BY APPLICATION, 2024-2032 (USD MILLION) 105

TABLE 86 SOUTH AMERICA: PUBLIC TRANSPORT MARKET, BY APPLICATION, 2024-2032 (UNITS) 106

TABLE 87 MIDDLE EAST AND AFRICA: PUBLIC TRANSPORT INVESTMENT, BY TYPE, 2024-2032 (USD MILLION) 107

TABLE 88 MIDDLE EAST AND AFRICA: PUBLIC TRANSPORT MARKET, BY TYPE, 2024-2032 (UNITS) 107

TABLE 89 MIDDLE EAST AND AFRICA: PUBLIC TRANSPORT INVESTMENT, BY APPLICATION, 2024-2032 (USD MILLION) 108

TABLE 90 MIDDLE EAST AND AFRICA: PUBLIC TRANSPORT MARKET, BY APPLICATION, 2024-2032 (UNITS) 109

TABLE 91 MOBILITY AS A SERVICE MARKET, BY SERVICE, 2024-2032 (USD MILLION) 110

TABLE 92 LIST OF ACTIVE PLAYERS IN THE GLOBAL PUBLIC TRANSPORT MARKET 114

TABLE 93 TRANSPORT FOR LONDON: PRODUCTS/SERVICES OFFERED 116

TABLE 94 TRANSPORT FOR LONDON: KEY DEVELOPMENTS 117

TABLE 95 MTR CORPORATION: PRODUCTS/SERVICES OFFERED 119

TABLE 96 MTR CORPORATION: KEY DEVELOPMENTS 119

TABLE 97 BAY AREA RAPID TRANSIT (BART): PRODUCTS/SERVICES OFFERED 121

TABLE 98 BAY AREA RAPID TRANSIT (BART): KEY DEVELOPMENTS 121

TABLE 99 CHICAGO TRANSIT AUTHORITY: PRODUCTS/SERVICES OFFERED 122

TABLE 100 CHICAGO TRANSIT AUTHORITY: KEY DEVELOPMENTS 123

TABLE 101 THE WASHINGTON METROPOLITAN AREA TRANSIT AUTHORITY: PRODUCTS/SERVICES OFFERED 125

TABLE 102 THE MASSACHUSETTS BAY TRANSPORTATION AUTHORITY: PRODUCTS/SERVICES OFFERED 127

TABLE 103 THE MASSACHUSETTS BAY TRANSPORTATION AUTHORITY: KEY DEVELOPMENTS 127

TABLE 104 MADRID METRO: PRODUCTS/SERVICES OFFERED 129

TABLE 105 METROPOLITAN TRANSPORTATION AUTHORITY: PRODUCTS/SERVICES OFFERED 131

TABLE 106 METROPOLITAN TRANSPORTATION AUTHORITY: KEY DEVELOPMENTS 131

TABLE 107 THE SAN DIEGO METROPOLITAN TRANSIT SYSTEM: PRODUCTS/SERVICES OFFERED 133

TABLE 108 SEOUL METRO: PRODUCTS/SERVICES OFFERED 134

14 List Of Figures

FIGURE 1 MARKET SYNOPSIS 14

FIGURE 2 GLOBAL PUBLIC TRANSPORT MARKET: MARKET STRUCTURE 17

FIGURE 3 MARKET ATTRACTIVENESS ANALYSIS: GLOBAL PUBLIC TRANSPORT MARKET, 2020, BY REGION 17

FIGURE 4 GLOBAL PUBLIC TRANSPORT MARKET, BY TYPE, 2024-2032 (USD MILLION) 18

FIGURE 5 GLOBAL PUBLIC TRANSPORT MARKET, BY APPLICATION, 2024-2032 (USD MILLION) 19

FIGURE 6 GLOBAL PUBLIC TRANSPORT MARKET: KEY BUYING CRITERIA 19

FIGURE 7 RESEARCH PROCESS OF MRFR 20

FIGURE 8 TOP-DOWN & BOTTOM-UP APPROACHES 23

FIGURE 9 NORTH AMERICA: PUBLIC TRANSPORT MARKET SIZE & MARKET SHARE BY COUNTRY, BY INVESTMENT (2020 VS 2027) 24

FIGURE 10 EUROPE: PUBLIC TRANSPORT MARKET SIZE & MARKET SHARE BY COUNTRY, BY INVESTMENT (2020 VS 2027) 25

FIGURE 11 ASIA-PACIFIC: PUBLIC TRANSPORT MARKET SIZE & MARKET SHARE BY COUNTRY, BY INVESTMENT (2020 VS 2027) 25

FIGURE 12 ROW: PUBLIC TRANSPORT MARKET SIZE & MARKET SHARE BY REGION, BY INVESTMENT (2020 VS 2027) 26

FIGURE 13 DRO ANALYSIS: GLOBAL PUBLIC TRANSPORT MARKET 27

FIGURE 14 GLOBAL URBAN POPULATION GROWTH, 2020–2027 29

FIGURE 15 DRIVERS IMPACT ANALYSIS: GLOBAL PUBLIC TRANSPORT MARKET 30

FIGURE 16 RESTRAINTS IMPACT ANALYSIS: PUBLIC TRANSPORT MARKET 31

FIGURE 17 GLOBAL PUBLIC TRANSPORT MARKET: PORTER'S FIVE FORCES ANALYSIS 32

FIGURE 18 SUPPLY CHAIN ANALYSIS: GLOBAL PUBLIC TRANSPORT MARKET 35

FIGURE 19 GLOBAL PUBLIC TRANSPORT INVESTMENT, BY TYPE, 2020 (%SHARE) 42

FIGURE 20 GLOBAL PUBLIC TRANSPORT MARKET, BY TYPE, 2020 (%VOLUME SHARE) 44

FIGURE 21 GLOBAL PUBLIC TRANSPORT INVESTMENT, BY APPLICATION, 2020 (%SHARE) 45

FIGURE 22 GLOBAL PUBLIC TRANSPORT MARKET, BY APPLICATION, 2020 (%VOLUME SHARE) 46

FIGURE 23 GLOBAL PUBLIC TRANSPORT INVESTMENT, BY REGION, 2020 (%SHARE) 48

FIGURE 24 GLOBAL PUBLIC TRANSPORT MARKET, BY REGION, 2020 (%VOLUME SHARE) 49

FIGURE 25 NORTH AMERICA: PUBLIC TRANSPORT INVESTMENT, BY COUNTRY, 2020 (%SHARE) 51

FIGURE 26 NORTH AMERICA: PUBLIC TRANSPORT MARKET, BY COUNTRY, 2020 (%VOLUME SHARE) 52

FIGURE 27 EUROPE: PUBLIC TRANSPORT INVESTMENT, BY COUNTRY, 2020 (%SHARE) 65

FIGURE 28 EUROPE: PUBLIC TRANSPORT MARKET, BY COUNTRY, 2020 (%VOLUME SHARE) 66

FIGURE 29 ASIA-PACIFIC: PUBLIC TRANSPORT INVESTMENT, BY COUNTRY, 2020 (%SHARE) 84

FIGURE 30 ASIA-PACIFIC: PUBLIC TRANSPORT MARKET, BY COUNTRY, 2020 (%VOLUME SHARE) 85

FIGURE 31 REST OF THE WORLD: PUBLIC TRANSPORT INVESTMENT, BY COUNTRY, 2020 (%SHARE) 100

FIGURE 32 GLOBAL MOBILITY AS A SERVICE (MAAS) MARKET, BY SERVICE, 2027 (% SHARE) 110

FIGURE 33 BENCHMARKING OF MAJOR COMPETITORS 113

FIGURE 34 KEY STRATEGY ANALYSIS: GLOBAL PUBLIC TRANSPORT MARKET 113

FIGURE 35 TRANSPORT FOR LONDON: FINANCIAL SNAPSHOT, 2020–2027 116

FIGURE 36 TRANSPORT FOR LONDON: SWOT ANALYSIS 117

FIGURE 37 MTR CORPORATION: FINANCIAL OVERVIEW SNAPSHOT, 2024-2032 (USD MILLION) 118

FIGURE 38 MTR CORPORATION: SWOT ANALYSIS 119

FIGURE 39 BAY AREA RAPID TRANSIT (BART): SALES REVENUE, 2024-2032 (USD MILLION) 120

FIGURE 40 BAY AREA RAPID TRANSIT (BART): SWOT ANALYSIS 121

FIGURE 41 CHICAGO TRANSIT AUTHORITY: SALES REVENUE, 2024-2032 (USD MILLION) 122

FIGURE 42 CHICAGO TRANSIT AUTHORITY: SWOT ANALYSIS 123

FIGURE 43 THE WASHINGTON METROPOLITAN AREA TRANSIT AUTHORITY: SALES REVENUE, 2024-2032 (USD MILLION) 124

FIGURE 44 THE WASHINGTON METROPOLITAN AREA TRANSIT AUTHORITY: SWOT ANALYSIS 125

FIGURE 45 THE MASSACHUSETTS BAY TRANSPORTATION AUTHORITY: FINANCIAL SNAPSHOT, 2024-2032 126

FIGURE 46 MADRID METRO: FINANCIAL OVERVIEW SNAPSHOT, 2020–2027 (USD MILLION) 128

FIGURE 47 METROPOLITAN TRANSPORTATION AUTHORITY: SALES REVENUE, 2024-2032 (USD MILLION) 130

FIGURE 48 THE SAN DIEGO METROPOLITAN TRANSIT SYSTEM: SALES REVENUE, 2024-2032 (USD MILLION) 132

Purchase Option
Single User $ 4,950
Multiuser License $ 5,950
Enterprise User $ 7,250
Compare Licenses
Tailored for You
  • Dedicated Research on any specifics segment or region.
  • Focused Research on specific players in the market.
  • Custom Report based only on your requirements.
  • Flexibility to add or subtract any chapter in the study.
  • Historic data from 2014 and forecasts outlook till 2040.
  • Flexibility of providing data/insights in formats (PDF, PPT, Excel).
  • Provide cross segmentation in applicable scenario/markets.