Property Insurance Market Summary
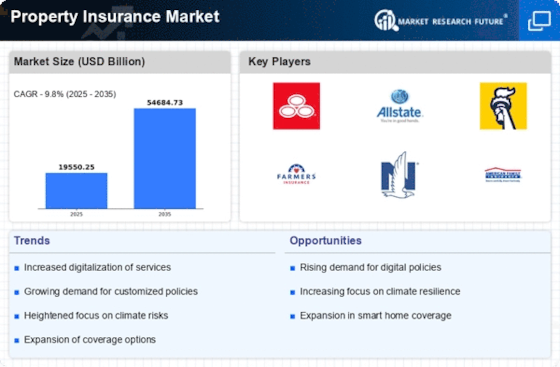
As per MRFR Analysis, the Global Property Insurance Market was valued at 761.73 USD Billion in 2023 and is projected to grow to 1,120 USD Billion by 2035, reflecting a CAGR of 3.26% from 2025 to 2035. The market is driven by increasing awareness of insurance importance among property owners, urbanization, and the rising frequency of natural disasters, which has led to a surge in demand for comprehensive coverage.
Key Market Trends & Highlights
The Property Insurance Market is witnessing significant trends influenced by various factors.
- Homeowners Insurance is projected to grow from 300.0 USD Billion in 2024 to 420.5 USD Billion by 2035.
- Renters Insurance is expected to increase from 150.0 USD Billion in 2024 to 210.0 USD Billion by 2035.
- Flood Insurance is projected to rise from 100.0 USD Billion in 2024 to 150.0 USD Billion by 2035.
- Earthquake Insurance is anticipated to grow from 156.57 USD Billion in 2024 to 229.5 USD Billion by 2035.
Market Size & Forecast
2023 Market Size: USD 761.73 Billion
2024 Market Size: USD 786.57 Billion
2035 Market Size: USD 1,120 Billion
CAGR (2025-2035): 3.26%
Largest Regional Market Share in 2024: North America.
Major Players
Key players include Zurich Insurance Group, Hartford, Chubb, Liberty Mutual, and State Farm.
Key Property Insurance Market Trends Highlighted
The Property Insurance Market is experiencing significant trends driven by various factors. One of the key market drivers is the increasing awareness among property owners regarding the importance of insurance coverage for safeguarding against potential risks such as natural disasters, theft, and liability claims. This heightened awareness is leading to a growing demand for property insurance policies across different regions as both residential and commercial property owners seek financial security. Additionally, the expansion of urbanization and infrastructure development globally is creating opportunities for insurers to tailor products that meet the specific needs of new homeowners and businesses.
In recent times, technology has played a pivotal role in shaping the property insurance landscape. The adoption of digital platforms for policy management, claims processing, and customer engagement has streamlined operations and improved customer experiences. Insurers are increasingly utilizing data analytics and artificial intelligence to better assess risks, personalize offerings, and enhance underwriting processes. This trend not only benefits insurers by optimizing profitability but also empowers consumers with more customized insurance solutions. Moreover, the Property Insurance Market is witnessing an increased focus on sustainable practices and climate change adaptation as more properties are affected by extreme weather events.
Insurers are now incentivizing policyholders to incorporate resilient building practices and risk mitigation strategies, thereby creating a strong link between sustainability and insurance coverage. This shift reflects a broader understanding that the insurance sector has a vital role in promoting resilience against climate risks. As such, there are numerous opportunities to be explored within the Property Insurance Market, including innovative policy offerings, partnerships with technology providers, and an emphasis on risk management services. Stakeholders can tap into these opportunities to expand their market presence and cater to the evolving needs of property owners worldwide.

Source: Primary Research, Secondary Research, MRFR Database and Analyst Review
Property Insurance Market Drivers
Increasing Frequency of Natural Disasters
The Property Insurance Market Industry is experiencing growth driven by the increasing frequency and severity of natural disasters such as hurricanes, floods, and wildfires. According to the United Nations Office for Disaster Risk Reduction, the frequency of disasters has risen by 40% over the past two decades, leading to a surge in claims and a higher demand for property insurance coverage. Additionally, the National Oceanic and Atmospheric Administration reported that the cost of natural disasters in the United States alone reached over 1 trillion USD in damages from 1980 to 2018, emphasizing the need for comprehensive property insurance.
Major insurance providers such as Allianz and Zurich Insurance Group have adapted their policies in response by offering tailored insurance solutions, which further stimulate market growth as they seek to cover a wider range of risks associated with natural catastrophes. As temperatures rise, the trend is expected to continue, creating sustained demand in the Property Insurance Market.
Urbanization and Growing Infrastructure Development
Urbanization is a prominent driver propelling the Property Insurance Market Industry as more individuals move to urban areas and infrastructure development accelerates. The World Bank estimates that by 2050, 68% of the population will live in urban areas, up from 55% today, which translates to billions of people requiring housing and commercial spaces. This rise in construction leads to increased property values, thereby necessitating property insurance for homeowners and businesses alike.
Furthermore, the U.S. Department of Commerce highlighted that private investment in construction reached approximately 1.43 trillion USD annually, which directly impacts property insurance needs. Companies like AIG and Lloyd's have expanded their offerings to navigate these urbanization trends, driving further growth in the Property Insurance Market.
Growing Awareness of Risks and Insurance Needs
There is a growing awareness among property owners of the risks associated with inadequate insurance coverage, which is significantly influencing the Property Insurance Market Industry. A survey conducted by the Insurance Information Institute revealed that approximately 75% of homeowners understand the importance of having property insurance, a figure that has increased from 55% in 2015. This growing recognition has resulted in more individuals purchasing property insurance, thus driving market growth.
Organizations like State Farm and Farmers Insurance have been proactive in promoting the importance of coverage and educating consumers about potential risks, thus fostering awareness and further validating the increase in demand seen in the Property Insurance Market.
Property Insurance Market Segment Insights:
Property Insurance Market Insurance Type Insights
The Property Insurance Market is witnessing robust growth with a wide array of offerings centered around different insurance types, specifically Homeowners Insurance, Renters Insurance, Condo Insurance, Flood Insurance, and Earthquake Insurance. In 2024, the market is valued at 786.57 USD Billion, showcasing the increasing recognition of property insurance as a financial safeguard against risks related to property loss and damage. Homeowners Insurance stands out prominently, projected to reach 300.0 USD Billion in 2024 and growing significantly to 420.5 USD Billion by 2035, making it a major player that encompasses a variety of coverages, including liability, dwelling protection, and personal property coverage.
This insurance type is particularly important as it offers homeowners peace of mind and financial security against unforeseen events, thus holding a majority share of the overall market. The Renters Insurance segment is also substantial, with a valuation of 150.0 USD Billion in 2024, expected to increase to 210.0 USD Billion by 2035, reflecting an upward trend in rental living arrangements globally. It serves as an essential protective measure for tenants, covering personal property against risks like theft, fire, and certain liabilities, driving its demand within the demographic.
Meanwhile, the Condo Insurance market is predicted to grow from 80.0 USD Billion in 2024 to 110.0 USD Billion in 2035, which highlights its significance in metropolitan regions where condo living is prevalent; this insurance caters specifically to residents of condo associations, distinguishing it from standard homeowners insurance. Furthermore, Flood Insurance is gaining traction with a value projected at 100.0 USD Billion in 2024, expanding to 150.0 USD Billion in 2035, primarily driven by increasing climate change impacts and higher awareness surrounding water-related damages.
Earthquake Insurance, valued at 156.57 USD Billion in 2024 and expected to rise to 229.5 USD Billion by 2035, signifies its importance in regions prone to seismic activities, providing essential coverage against catastrophic losses. As society increasingly recognizes the need for protection against specific risks, the Property Insurance Market segmentation is evolving to meet the diverse requirements of homeowners, renters, and property owners globally, enhancing its overall resilience in the face of unforeseen challenges. The combined statistics indicate a strong market growth potential, while the distinct attributes of each insurance type cater to varying needs, positioning them as crucial elements within the property insurance landscape.

Source: Primary Research, Secondary Research, MRFR Database and Analyst Review
Property Insurance Market Coverage Type Insights
The Property Insurance Market is poised for growth, with a valuation of 786.57 billion USD in 2024. Within this expansive market, the Coverage Type segmentation plays a critical role, capturing the variety of insurance options available to property owners. Coverage types are essential for determining how claims are paid, with Actual Cash Value, Replacement Cost, Extended Replacement Cost, and Guaranteed Replacement Cost representing key categories. Actual Cash Value typically considers depreciation, making it a cost-effective choice for some property owners.
Replacement Cost offers more comprehensive coverage, ensuring policyholders can replace their property without the deduction for depreciation. Extended Replacement Cost goes a step further, covering costs that exceed policy limits under certain conditions, thus providing added financial security for property owners. Guaranteed Replacement Cost is considered the most robust type, allowing policyholders full reimbursement to replace a property regardless of the rebuilding cost. The demand for these Coverage Types is driven by increasing property valuations and rising awareness of the importance of adequate insurance protection in the face of natural disasters and market fluctuations.
As the Property Insurance Market continues to expand, these segments will play a significant role in shaping consumer choices and overall market dynamics.
Property Insurance Market End Use Insights
The Property Insurance Market is primarily segmented by End Use into Residential, Commercial, and Industrial categories, reflecting diverse risk profiles and coverage needs. In 2024, the market is valued at 786.57 billion USD, showcasing its importance in addressing the varying needs across these segments. The Residential segment is particularly significant due to the increasing number of homeowners seeking protection against loss or damage caused by unforeseen events. Meanwhile, the Commercial segment is characterized by business property securing coverage to mitigate potential risks related to assets, liability, and employee safety, which is crucial for operational continuity.
Industrial properties also display a major presence, needing specialized policies to address the unique risks related to manufacturing and production activities. The growth of the Property Insurance Market is driven by rising awareness about risk management, urbanization, and regulatory requirements across the Globe.Â
Collectively, these segments contribute to the dynamics of the market, creating opportunities for tailored insurance solutions that cater to specific client needs while also facing challenges like evolving threats and regulations. This comprehensive structure of the market emphasizes its robustness and adaptability in meeting diverse insurance demands.
Property Insurance Market Distribution Channel Insights
The Property Insurance Market is segmented into various distribution channels, which play a crucial role in reaching customers and generating revenue. With the overall market valued at 786.57 billion USD in 2024, distribution channels significantly influence market dynamics and customer access. Direct sales provide a personal touch, enhancing customer relationships and boosting trust, while brokerage channels allow clients to compare various insurance policies, providing them with tailored solutions. Online platforms have gained traction, offering convenience and streamlined processes, reflecting the shifting consumer behaviors towards digital convenience.Â
Additionally, banks act as essential players in distribution, leveraging their established customer bases to provide insurance services alongside banking products, thus creating an integrated financial solution. The importance of these distribution channels is underscored by their ability to adapt to changing consumer preferences and technological advancements, thereby ensuring wider access and improved customer experience in the Property Insurance Market. Each channel’s contribution is significant, as they collectively reinforce the market's resilience and facilitate its steady growth amidst evolving industry trends.
Property Insurance Market Regional Insights
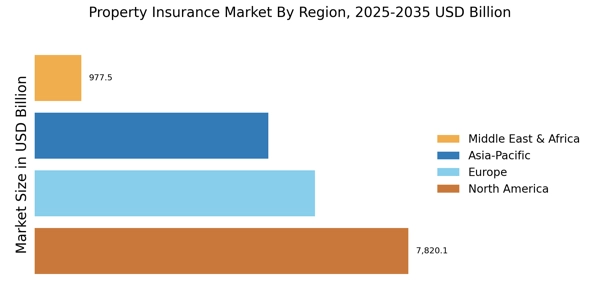
The Property Insurance Market is witnessing considerable growth, with the regional segmentation revealing key insights. In 2024, North America emerged as a dominant player, valued at 300.0 USD Billion, largely due to its robust regulatory frameworks and extensive coverage options. Europe follows, with a valuation of 220.0 USD Billion in the same year, benefiting from strong consumer awareness and stringent property protection laws. The APAC segment, valued at 180.0 USD Billion, experiences growth driven by rising urbanization and increasing disposable incomes, making it a significant player in this market.
South America and MEA represent smaller segments, valued at 50.0 USD Billion and 36.57 USD Billion, respectively, in 2024. South America's growth potential is boosted by developing economies, while MEA faces unique challenges, including political instability that affects its market dynamics. Together, these factors contribute to the overall Property Insurance Market revenue, reflecting diverse opportunities and challenges across regions. Insights reveal that while North America holds a majority share, the potential for growth in emerging markets like APAC positions it as a significant area for future investment and expansion in the property insurance domain.

 Source: Primary Research, Secondary Research, MRFR Database and Analyst Review
Property Insurance Market Key Players and Competitive Insights:
The Property Insurance Market is characterized by a dynamic landscape driven by various factors, including the increasing frequency of natural disasters, evolving customer expectations, and advancements in technology. Competition within this market is robust, as numerous players strive to offer innovative insurance solutions while maintaining profitability. Insurers are increasingly investing in digital platforms to enhance customer experience and streamline claims processing, which has become a critical differentiator. Market participants are also focused on expanding their geographical reach and product portfolios to capture emerging opportunities in both established and developing markets. As regulatory environments shift and consumer preferences change, competitors must adapt quickly to maintain their market positions. The competitive landscape is marked by significant collaborations, strategic partnerships, and mergers and acquisitions as companies aim to strengthen their market presence and capitalize on synergies.
Zurich Insurance Group has established itself as a strong player in the Property Insurance Market, leveraging its extensive experience and broad portfolio of property insurance products. The company’s strengths lie in its robust financial foundation and commitment to customer service, enabling it to provide tailored coverage options that meet diverse client needs globally. Zurich Insurance Group has strategically invested in risk assessment technologies, allowing it to enhance underwriting processes and offer competitive pricing. Its established brand reputation, paired with a vast distribution network, enhances its ability to penetrate markets effectively. Furthermore, Zurich is committed to sustainability, which resonates with environmentally conscious consumers, thus providing a competitive edge by aligning insurance offerings with the growing demand for responsible business practices.
Hartford operates in the Property Insurance Market with a focus on providing comprehensive insurance solutions that cater to both personal and commercial clients. The company is noted for its diverse range of products, including homeowners, renters, and business insurance, which positions it favorably to address various market segments. Hartford's strengths include its strong risk management capabilities and exceptional claims service reputation, both of which are critical in maintaining customer trust and loyalty. The company's proactive approach to mergers and acquisitions enables it to expand its market reach and enhance its product offerings continually. Hartford has pursued strategic partnerships that enhance its technological capabilities, allowing it to innovate within the property insurance space. Moreover, the company’s focus on customer-centric solutions and its ability to adapt to changing market demands further solidify its position in the competitive landscape of the Property Insurance Market.
Key Companies in the Property Insurance Market Include:
- Zurich Insurance Group
- Hartford
- Chubb
- Liberty Mutual
- Western and Southern Financial Group
- Nationwide
- State Farm
- MetLife
- Berkshire Hathaway
- Tokio Marine Holdings
- American International Group
- Allstate
- Travelers
- Progressive
- AXA
Property Insurance Industry Developments
The Property Insurance Market has been experiencing significant developments driven by increasing natural disasters and changing climate patterns. In recent months, September 2023 noticed Zurich Insurance Group announcing enhancements to their digital platforms to improve customer engagement and streamline claims processes. Similarly, Chubb has been expanding its product offerings to cover emerging risks, such as cyber insurance, amidst rising cyber threats. Noteworthy mergers and acquisitions include Hartford's acquisition of an undefined block of business from a rival company in August 2023, which aimed to expand its portfolio in the commercial property sector.Â
Moreover, in July 2023, Liberty Mutual completed its acquisition of a regional insurer, strengthening its foothold in the Northeast U.S. market. Growth in the property insurance sector continues, with the market valuation for companies like Berkshire Hathaway and Tokio Marine Holdings indicating a robust trajectory, reflecting an increasing demand for property protection amid economic uncertainties. Historical trends show that in 2021, the market reached a valuation milestone of over $800 billion, illustrating its resilience and potential for growth despite regulatory challenges and competition. Overall, the focus on technological advancement and strategic acquisitions marks a transformative period for the Property Insurance Market.
Property Insurance Market Segmentation Insights
Property Insurance Market Insurance Type Outlook
Property Insurance Market Coverage Type Outlook
- Extended Replacement Cost
- Guaranteed Replacement Cost
Property Insurance Market End Use Outlook
Property Insurance Market Distribution Channel Outlook
Property Insurance Market Regional Outlook
Report Attribute/Metric |
Details |
Market Size 2023 |
761.73 (USD Billion) |
Market Size 2024 |
786.57 (USD Billion) |
Market Size 2035 |
1120.0 (USD Billion) |
Compound Annual Growth Rate (CAGR) |
3.26% (2025 - 2035) |
Report Coverage |
Revenue Forecast, Competitive Landscape, Growth Factors, and Trends |
Base Year |
2024 |
Market Forecast Period |
2025 - 2035 |
Historical Data |
2019 - 2024 |
Market Forecast Units |
USD Billion |
Key Companies Profiled |
Zurich Insurance Group, Hartford, Chubb, Liberty Mutual, Western and Southern Financial Group, Nationwide, State Farm, MetLife, Berkshire Hathaway, Tokio Marine Holdings, American International Group, Allstate, Travelers, Progressive, AXA |
Segments Covered |
Insurance Type, Coverage Type, End Use, Distribution Channel, Regional |
Key Market Opportunities |
Digital transformation in underwriting, Increasing demand for cyber insurance, Growth in smart home technology, Expansion in emerging markets, Customizable insurance products for consumers |
Key Market Dynamics |
Increasing natural disasters, rising property values, regulatory changes, technological advancements, growing awareness of insurance |
Countries Covered |
North America, Europe, APAC, South America, MEA |
Frequently Asked Questions (FAQ):
The Property Insurance Market is projected to be valued at 786.57 USD Billion in 2024.
The Property Insurance Market is expected to reach a value of 1120.0 USD Billion by 2035.
The expected compound annual growth rate (CAGR) for the Property Insurance Market is 3.26% from 2025 to 2035.
North America is anticipated to dominate the Property Insurance Market with a valuation of 300.0 USD Billion in 2024.
Homeowners Insurance is expected to be valued at 300.0 USD Billion in 2024 within the Property Insurance Market.
Flood Insurance is projected to be valued at 100.0 USD Billion in 2024 and is expected to increase to 150.0 USD Billion in 2035.
Major players in the Property Insurance Market include Zurich Insurance Group, Hartford, Chubb, and Liberty Mutual, among others.
Renters Insurance is expected to grow to a valuation of 210.0 USD Billion by 2035 within the Property Insurance Market.
The APAC region is anticipated to reach a market size of 260.0 USD Billion by 2035 within the Property Insurance Market.
The Property Insurance Market may face challenges such as regulatory changes and increasing competition among major players.
TABLE OF CONTENTS
1. EXECUTIVE SUMMARY
1.1. Market Overview
1.2. Key Findings
1.3. Market Segmentation
1.4. Competitive Landscape
1.5. Challenges and Opportunities
1.6. Future Outlook
2. MARKET INTRODUCTION
2.1. Definition
2.2. Scope of the study
2.2.1. Research Objective
2.2.2. Assumption
2.2.3. Limitations
3. RESEARCH METHODOLOGY
3.1. Overview
3.2. Data Mining
3.3. Secondary Research
3.4. Primary Research
3.4.1. Primary Interviews and Information Gathering Process
3.4.2. Breakdown of Primary Respondents
3.5. Forecasting Model
3.6. Market Size Estimation
3.6.1. Bottom-Up Approach
3.6.2. Top-Down Approach
3.7. Data Triangulation
3.8. Validation
4. MARKET DYNAMICS
4.1. Overview
4.2. Drivers
4.3. Restraints
4.4. Opportunities
5. MARKET FACTOR ANALYSIS
5.1. Value chain Analysis
5.2. Porter's Five Forces Analysis
5.2.1. Bargaining Power of Suppliers
5.2.2. Bargaining Power of Buyers
5.2.3. Threat of New Entrants
5.2.4. Threat of Substitutes
5.2.5. Intensity of Rivalry
5.3. COVID-19 Impact Analysis
5.3.1. Market Impact Analysis
5.3.2. Regional Impact
5.3.3. Opportunity and Threat Analysis
6. PROPERTY INSURANCE MARKET, BY INSURANCE TYPE (USD BILLION)
6.1. Homeowners Insurance
6.2. Renters Insurance
6.3. Condo Insurance
6.4. Flood Insurance
6.5. Earthquake Insurance
7. PROPERTY INSURANCE MARKET, BY COVERAGE TYPE (USD BILLION)
7.1. Actual Cash Value
7.2. Replacement Cost
7.3. Extended Replacement Cost
7.4. Guaranteed Replacement Cost
8. PROPERTY INSURANCE MARKET, BY END USE (USD BILLION)
8.1. Residential
8.2. Commercial
8.3. Industrial
9. PROPERTY INSURANCE MARKET, BY DISTRIBUTION CHANNEL (USD BILLION)
9.1. Direct Sales
9.2. Brokerage
9.3. Online Platforms
9.4. Banks
10. PROPERTY INSURANCE MARKET, BY REGIONAL (USD BILLION)
10.1. North America
10.1.1. US
10.1.2. Canada
10.2. Europe
10.2.1. Germany
10.2.2. UK
10.2.3. France
10.2.4. Russia
10.2.5. Italy
10.2.6. Spain
10.2.7. Rest of Europe
10.3. APAC
10.3.1. China
10.3.2. India
10.3.3. Japan
10.3.4. South Korea
10.3.5. Malaysia
10.3.6. Thailand
10.3.7. Indonesia
10.3.8. Rest of APAC
10.4. South America
10.4.1. Brazil
10.4.2. Mexico
10.4.3. Argentina
10.4.4. Rest of South America
10.5. MEA
10.5.1. GCC Countries
10.5.2. South Africa
10.5.3. Rest of MEA
11. COMPETITIVE LANDSCAPE
11.1. Overview
11.2. Competitive Analysis
11.3. Market share Analysis
11.4. Major Growth Strategy in the Property Insurance Market
11.5. Competitive Benchmarking
11.6. Leading Players in Terms of Number of Developments in the Property Insurance Market
11.7. Key developments and growth strategies
11.7.1. New Product Launch/Service Deployment
11.7.2. Merger & Acquisitions
11.7.3. Joint Ventures
11.8. Major Players Financial Matrix
11.8.1. Sales and Operating Income
11.8.2. Major Players R&D Expenditure. 2023
12. COMPANY PROFILES
12.1. Zurich Insurance Group
12.1.1. Financial Overview
12.1.2. Products Offered
12.1.3. Key Developments
12.1.4. SWOT Analysis
12.1.5. Key Strategies
12.2. Hartford
12.2.1. Financial Overview
12.2.2. Products Offered
12.2.3. Key Developments
12.2.4. SWOT Analysis
12.2.5. Key Strategies
12.3. Chubb
12.3.1. Financial Overview
12.3.2. Products Offered
12.3.3. Key Developments
12.3.4. SWOT Analysis
12.3.5. Key Strategies
12.4. Liberty Mutual
12.4.1. Financial Overview
12.4.2. Products Offered
12.4.3. Key Developments
12.4.4. SWOT Analysis
12.4.5. Key Strategies
12.5. Western and Southern Financial Group
12.5.1. Financial Overview
12.5.2. Products Offered
12.5.3. Key Developments
12.5.4. SWOT Analysis
12.5.5. Key Strategies
12.6. Nationwide
12.6.1. Financial Overview
12.6.2. Products Offered
12.6.3. Key Developments
12.6.4. SWOT Analysis
12.6.5. Key Strategies
12.7. State Farm
12.7.1. Financial Overview
12.7.2. Products Offered
12.7.3. Key Developments
12.7.4. SWOT Analysis
12.7.5. Key Strategies
12.8. MetLife
12.8.1. Financial Overview
12.8.2. Products Offered
12.8.3. Key Developments
12.8.4. SWOT Analysis
12.8.5. Key Strategies
12.9. Berkshire Hathaway
12.9.1. Financial Overview
12.9.2. Products Offered
12.9.3. Key Developments
12.9.4. SWOT Analysis
12.9.5. Key Strategies
12.10. Tokio Marine Holdings
12.10.1. Financial Overview
12.10.2. Products Offered
12.10.3. Key Developments
12.10.4. SWOT Analysis
12.10.5. Key Strategies
12.11. American International Group
12.11.1. Financial Overview
12.11.2. Products Offered
12.11.3. Key Developments
12.11.4. SWOT Analysis
12.11.5. Key Strategies
12.12. Allstate
12.12.1. Financial Overview
12.12.2. Products Offered
12.12.3. Key Developments
12.12.4. SWOT Analysis
12.12.5. Key Strategies
12.13. Travelers
12.13.1. Financial Overview
12.13.2. Products Offered
12.13.3. Key Developments
12.13.4. SWOT Analysis
12.13.5. Key Strategies
12.14. Progressive
12.14.1. Financial Overview
12.14.2. Products Offered
12.14.3. Key Developments
12.14.4. SWOT Analysis
12.14.5. Key Strategies
12.15. AXA
12.15.1. Financial Overview
12.15.2. Products Offered
12.15.3. Key Developments
12.15.4. SWOT Analysis
12.15.5. Key Strategies
13. APPENDIX
13.1. References
13.2. Related Reports
LIST OF TABLES
TABLE 1. LIST OF ASSUMPTIONS
TABLE 2. NORTH AMERICA PROPERTY INSURANCE INDUSTRY SIZE ESTIMATES & FORECAST, BY INSURANCE TYPE, 2019-2035 (USD BILLIONS)
TABLE 3. NORTH AMERICA PROPERTY INSURANCE INDUSTRY SIZE ESTIMATES & FORECAST, BY COVERAGE TYPE, 2019-2035 (USD BILLIONS)
TABLE 4. NORTH AMERICA PROPERTY INSURANCE INDUSTRY SIZE ESTIMATES & FORECAST, BY END USE, 2019-2035 (USD BILLIONS)
TABLE 5. NORTH AMERICA PROPERTY INSURANCE INDUSTRY SIZE ESTIMATES & FORECAST, BY DISTRIBUTION CHANNEL, 2019-2035 (USD BILLIONS)
TABLE 6. NORTH AMERICA PROPERTY INSURANCE INDUSTRY SIZE ESTIMATES & FORECAST, BY REGIONAL, 2019-2035 (USD BILLIONS)
TABLE 7. US PROPERTY INSURANCE INDUSTRY SIZE ESTIMATES & FORECAST, BY INSURANCE TYPE, 2019-2035 (USD BILLIONS)
TABLE 8. US PROPERTY INSURANCE INDUSTRY SIZE ESTIMATES & FORECAST, BY COVERAGE TYPE, 2019-2035 (USD BILLIONS)
TABLE 9. US PROPERTY INSURANCE INDUSTRY SIZE ESTIMATES & FORECAST, BY END USE, 2019-2035 (USD BILLIONS)
TABLE 10. US PROPERTY INSURANCE INDUSTRY SIZE ESTIMATES & FORECAST, BY DISTRIBUTION CHANNEL, 2019-2035 (USD BILLIONS)
TABLE 11. US PROPERTY INSURANCE INDUSTRY SIZE ESTIMATES & FORECAST, BY REGIONAL, 2019-2035 (USD BILLIONS)
TABLE 12. CANADA PROPERTY INSURANCE INDUSTRY SIZE ESTIMATES & FORECAST, BY INSURANCE TYPE, 2019-2035 (USD BILLIONS)
TABLE 13. CANADA PROPERTY INSURANCE INDUSTRY SIZE ESTIMATES & FORECAST, BY COVERAGE TYPE, 2019-2035 (USD BILLIONS)
TABLE 14. CANADA PROPERTY INSURANCE INDUSTRY SIZE ESTIMATES & FORECAST, BY END USE, 2019-2035 (USD BILLIONS)
TABLE 15. CANADA PROPERTY INSURANCE INDUSTRY SIZE ESTIMATES & FORECAST, BY DISTRIBUTION CHANNEL, 2019-2035 (USD BILLIONS)
TABLE 16. CANADA PROPERTY INSURANCE INDUSTRY SIZE ESTIMATES & FORECAST, BY REGIONAL, 2019-2035 (USD BILLIONS)
TABLE 17. EUROPE PROPERTY INSURANCE INDUSTRY SIZE ESTIMATES & FORECAST, BY INSURANCE TYPE, 2019-2035 (USD BILLIONS)
TABLE 18. EUROPE PROPERTY INSURANCE INDUSTRY SIZE ESTIMATES & FORECAST, BY COVERAGE TYPE, 2019-2035 (USD BILLIONS)
TABLE 19. EUROPE PROPERTY INSURANCE INDUSTRY SIZE ESTIMATES & FORECAST, BY END USE, 2019-2035 (USD BILLIONS)
TABLE 20. EUROPE PROPERTY INSURANCE INDUSTRY SIZE ESTIMATES & FORECAST, BY DISTRIBUTION CHANNEL, 2019-2035 (USD BILLIONS)
TABLE 21. EUROPE PROPERTY INSURANCE INDUSTRY SIZE ESTIMATES & FORECAST, BY REGIONAL, 2019-2035 (USD BILLIONS)
TABLE 22. GERMANY PROPERTY INSURANCE INDUSTRY SIZE ESTIMATES & FORECAST, BY INSURANCE TYPE, 2019-2035 (USD BILLIONS)
TABLE 23. GERMANY PROPERTY INSURANCE INDUSTRY SIZE ESTIMATES & FORECAST, BY COVERAGE TYPE, 2019-2035 (USD BILLIONS)
TABLE 24. GERMANY PROPERTY INSURANCE INDUSTRY SIZE ESTIMATES & FORECAST, BY END USE, 2019-2035 (USD BILLIONS)
TABLE 25. GERMANY PROPERTY INSURANCE INDUSTRY SIZE ESTIMATES & FORECAST, BY DISTRIBUTION CHANNEL, 2019-2035 (USD BILLIONS)
TABLE 26. GERMANY PROPERTY INSURANCE INDUSTRY SIZE ESTIMATES & FORECAST, BY REGIONAL, 2019-2035 (USD BILLIONS)
TABLE 27. UK PROPERTY INSURANCE INDUSTRY SIZE ESTIMATES & FORECAST, BY INSURANCE TYPE, 2019-2035 (USD BILLIONS)
TABLE 28. UK PROPERTY INSURANCE INDUSTRY SIZE ESTIMATES & FORECAST, BY COVERAGE TYPE, 2019-2035 (USD BILLIONS)
TABLE 29. UK PROPERTY INSURANCE INDUSTRY SIZE ESTIMATES & FORECAST, BY END USE, 2019-2035 (USD BILLIONS)
TABLE 30. UK PROPERTY INSURANCE INDUSTRY SIZE ESTIMATES & FORECAST, BY DISTRIBUTION CHANNEL, 2019-2035 (USD BILLIONS)
TABLE 31. UK PROPERTY INSURANCE INDUSTRY SIZE ESTIMATES & FORECAST, BY REGIONAL, 2019-2035 (USD BILLIONS)
TABLE 32. FRANCE PROPERTY INSURANCE INDUSTRY SIZE ESTIMATES & FORECAST, BY INSURANCE TYPE, 2019-2035 (USD BILLIONS)
TABLE 33. FRANCE PROPERTY INSURANCE INDUSTRY SIZE ESTIMATES & FORECAST, BY COVERAGE TYPE, 2019-2035 (USD BILLIONS)
TABLE 34. FRANCE PROPERTY INSURANCE INDUSTRY SIZE ESTIMATES & FORECAST, BY END USE, 2019-2035 (USD BILLIONS)
TABLE 35. FRANCE PROPERTY INSURANCE INDUSTRY SIZE ESTIMATES & FORECAST, BY DISTRIBUTION CHANNEL, 2019-2035 (USD BILLIONS)
TABLE 36. FRANCE PROPERTY INSURANCE INDUSTRY SIZE ESTIMATES & FORECAST, BY REGIONAL, 2019-2035 (USD BILLIONS)
TABLE 37. RUSSIA PROPERTY INSURANCE INDUSTRY SIZE ESTIMATES & FORECAST, BY INSURANCE TYPE, 2019-2035 (USD BILLIONS)
TABLE 38. RUSSIA PROPERTY INSURANCE INDUSTRY SIZE ESTIMATES & FORECAST, BY COVERAGE TYPE, 2019-2035 (USD BILLIONS)
TABLE 39. RUSSIA PROPERTY INSURANCE INDUSTRY SIZE ESTIMATES & FORECAST, BY END USE, 2019-2035 (USD BILLIONS)
TABLE 40. RUSSIA PROPERTY INSURANCE INDUSTRY SIZE ESTIMATES & FORECAST, BY DISTRIBUTION CHANNEL, 2019-2035 (USD BILLIONS)
TABLE 41. RUSSIA PROPERTY INSURANCE INDUSTRY SIZE ESTIMATES & FORECAST, BY REGIONAL, 2019-2035 (USD BILLIONS)
TABLE 42. ITALY PROPERTY INSURANCE INDUSTRY SIZE ESTIMATES & FORECAST, BY INSURANCE TYPE, 2019-2035 (USD BILLIONS)
TABLE 43. ITALY PROPERTY INSURANCE INDUSTRY SIZE ESTIMATES & FORECAST, BY COVERAGE TYPE, 2019-2035 (USD BILLIONS)
TABLE 44. ITALY PROPERTY INSURANCE INDUSTRY SIZE ESTIMATES & FORECAST, BY END USE, 2019-2035 (USD BILLIONS)
TABLE 45. ITALY PROPERTY INSURANCE INDUSTRY SIZE ESTIMATES & FORECAST, BY DISTRIBUTION CHANNEL, 2019-2035 (USD BILLIONS)
TABLE 46. ITALY PROPERTY INSURANCE INDUSTRY SIZE ESTIMATES & FORECAST, BY REGIONAL, 2019-2035 (USD BILLIONS)
TABLE 47. SPAIN PROPERTY INSURANCE INDUSTRY SIZE ESTIMATES & FORECAST, BY INSURANCE TYPE, 2019-2035 (USD BILLIONS)
TABLE 48. SPAIN PROPERTY INSURANCE INDUSTRY SIZE ESTIMATES & FORECAST, BY COVERAGE TYPE, 2019-2035 (USD BILLIONS)
TABLE 49. SPAIN PROPERTY INSURANCE INDUSTRY SIZE ESTIMATES & FORECAST, BY END USE, 2019-2035 (USD BILLIONS)
TABLE 50. SPAIN PROPERTY INSURANCE INDUSTRY SIZE ESTIMATES & FORECAST, BY DISTRIBUTION CHANNEL, 2019-2035 (USD BILLIONS)
TABLE 51. SPAIN PROPERTY INSURANCE INDUSTRY SIZE ESTIMATES & FORECAST, BY REGIONAL, 2019-2035 (USD BILLIONS)
TABLE 52. REST OF EUROPE PROPERTY INSURANCE INDUSTRY SIZE ESTIMATES & FORECAST, BY INSURANCE TYPE, 2019-2035 (USD BILLIONS)
TABLE 53. REST OF EUROPE PROPERTY INSURANCE INDUSTRY SIZE ESTIMATES & FORECAST, BY COVERAGE TYPE, 2019-2035 (USD BILLIONS)
TABLE 54. REST OF EUROPE PROPERTY INSURANCE INDUSTRY SIZE ESTIMATES & FORECAST, BY END USE, 2019-2035 (USD BILLIONS)
TABLE 55. REST OF EUROPE PROPERTY INSURANCE INDUSTRY SIZE ESTIMATES & FORECAST, BY DISTRIBUTION CHANNEL, 2019-2035 (USD BILLIONS)
TABLE 56. REST OF EUROPE PROPERTY INSURANCE INDUSTRY SIZE ESTIMATES & FORECAST, BY REGIONAL, 2019-2035 (USD BILLIONS)
TABLE 57. APAC PROPERTY INSURANCE INDUSTRY SIZE ESTIMATES & FORECAST, BY INSURANCE TYPE, 2019-2035 (USD BILLIONS)
TABLE 58. APAC PROPERTY INSURANCE INDUSTRY SIZE ESTIMATES & FORECAST, BY COVERAGE TYPE, 2019-2035 (USD BILLIONS)
TABLE 59. APAC PROPERTY INSURANCE INDUSTRY SIZE ESTIMATES & FORECAST, BY END USE, 2019-2035 (USD BILLIONS)
TABLE 60. APAC PROPERTY INSURANCE INDUSTRY SIZE ESTIMATES & FORECAST, BY DISTRIBUTION CHANNEL, 2019-2035 (USD BILLIONS)
TABLE 61. APAC PROPERTY INSURANCE INDUSTRY SIZE ESTIMATES & FORECAST, BY REGIONAL, 2019-2035 (USD BILLIONS)
TABLE 62. CHINA PROPERTY INSURANCE INDUSTRY SIZE ESTIMATES & FORECAST, BY INSURANCE TYPE, 2019-2035 (USD BILLIONS)
TABLE 63. CHINA PROPERTY INSURANCE INDUSTRY SIZE ESTIMATES & FORECAST, BY COVERAGE TYPE, 2019-2035 (USD BILLIONS)
TABLE 64. CHINA PROPERTY INSURANCE INDUSTRY SIZE ESTIMATES & FORECAST, BY END USE, 2019-2035 (USD BILLIONS)
TABLE 65. CHINA PROPERTY INSURANCE INDUSTRY SIZE ESTIMATES & FORECAST, BY DISTRIBUTION CHANNEL, 2019-2035 (USD BILLIONS)
TABLE 66. CHINA PROPERTY INSURANCE INDUSTRY SIZE ESTIMATES & FORECAST, BY REGIONAL, 2019-2035 (USD BILLIONS)
TABLE 67. INDIA PROPERTY INSURANCE INDUSTRY SIZE ESTIMATES & FORECAST, BY INSURANCE TYPE, 2019-2035 (USD BILLIONS)
TABLE 68. INDIA PROPERTY INSURANCE INDUSTRY SIZE ESTIMATES & FORECAST, BY COVERAGE TYPE, 2019-2035 (USD BILLIONS)
TABLE 69. INDIA PROPERTY INSURANCE INDUSTRY SIZE ESTIMATES & FORECAST, BY END USE, 2019-2035 (USD BILLIONS)
TABLE 70. INDIA PROPERTY INSURANCE INDUSTRY SIZE ESTIMATES & FORECAST, BY DISTRIBUTION CHANNEL, 2019-2035 (USD BILLIONS)
TABLE 71. INDIA PROPERTY INSURANCE INDUSTRY SIZE ESTIMATES & FORECAST, BY REGIONAL, 2019-2035 (USD BILLIONS)
TABLE 72. JAPAN PROPERTY INSURANCE INDUSTRY SIZE ESTIMATES & FORECAST, BY INSURANCE TYPE, 2019-2035 (USD BILLIONS)
TABLE 73. JAPAN PROPERTY INSURANCE INDUSTRY SIZE ESTIMATES & FORECAST, BY COVERAGE TYPE, 2019-2035 (USD BILLIONS)
TABLE 74. JAPAN PROPERTY INSURANCE INDUSTRY SIZE ESTIMATES & FORECAST, BY END USE, 2019-2035 (USD BILLIONS)
TABLE 75. JAPAN PROPERTY INSURANCE INDUSTRY SIZE ESTIMATES & FORECAST, BY DISTRIBUTION CHANNEL, 2019-2035 (USD BILLIONS)
TABLE 76. JAPAN PROPERTY INSURANCE INDUSTRY SIZE ESTIMATES & FORECAST, BY REGIONAL, 2019-2035 (USD BILLIONS)
TABLE 77. SOUTH KOREA PROPERTY INSURANCE INDUSTRY SIZE ESTIMATES & FORECAST, BY INSURANCE TYPE, 2019-2035 (USD BILLIONS)
TABLE 78. SOUTH KOREA PROPERTY INSURANCE INDUSTRY SIZE ESTIMATES & FORECAST, BY COVERAGE TYPE, 2019-2035 (USD BILLIONS)
TABLE 79. SOUTH KOREA PROPERTY INSURANCE INDUSTRY SIZE ESTIMATES & FORECAST, BY END USE, 2019-2035 (USD BILLIONS)
TABLE 80. SOUTH KOREA PROPERTY INSURANCE INDUSTRY SIZE ESTIMATES & FORECAST, BY DISTRIBUTION CHANNEL, 2019-2035 (USD BILLIONS)
TABLE 81. SOUTH KOREA PROPERTY INSURANCE INDUSTRY SIZE ESTIMATES & FORECAST, BY REGIONAL, 2019-2035 (USD BILLIONS)
TABLE 82. MALAYSIA PROPERTY INSURANCE INDUSTRY SIZE ESTIMATES & FORECAST, BY INSURANCE TYPE, 2019-2035 (USD BILLIONS)
TABLE 83. MALAYSIA PROPERTY INSURANCE INDUSTRY SIZE ESTIMATES & FORECAST, BY COVERAGE TYPE, 2019-2035 (USD BILLIONS)
TABLE 84. MALAYSIA PROPERTY INSURANCE INDUSTRY SIZE ESTIMATES & FORECAST, BY END USE, 2019-2035 (USD BILLIONS)
TABLE 85. MALAYSIA PROPERTY INSURANCE INDUSTRY SIZE ESTIMATES & FORECAST, BY DISTRIBUTION CHANNEL, 2019-2035 (USD BILLIONS)
TABLE 86. MALAYSIA PROPERTY INSURANCE INDUSTRY SIZE ESTIMATES & FORECAST, BY REGIONAL, 2019-2035 (USD BILLIONS)
TABLE 87. THAILAND PROPERTY INSURANCE INDUSTRY SIZE ESTIMATES & FORECAST, BY INSURANCE TYPE, 2019-2035 (USD BILLIONS)
TABLE 88. THAILAND PROPERTY INSURANCE INDUSTRY SIZE ESTIMATES & FORECAST, BY COVERAGE TYPE, 2019-2035 (USD BILLIONS)
TABLE 89. THAILAND PROPERTY INSURANCE INDUSTRY SIZE ESTIMATES & FORECAST, BY END USE, 2019-2035 (USD BILLIONS)
TABLE 90. THAILAND PROPERTY INSURANCE INDUSTRY SIZE ESTIMATES & FORECAST, BY DISTRIBUTION CHANNEL, 2019-2035 (USD BILLIONS)
TABLE 91. THAILAND PROPERTY INSURANCE INDUSTRY SIZE ESTIMATES & FORECAST, BY REGIONAL, 2019-2035 (USD BILLIONS)
TABLE 92. INDONESIA PROPERTY INSURANCE INDUSTRY SIZE ESTIMATES & FORECAST, BY INSURANCE TYPE, 2019-2035 (USD BILLIONS)
TABLE 93. INDONESIA PROPERTY INSURANCE INDUSTRY SIZE ESTIMATES & FORECAST, BY COVERAGE TYPE, 2019-2035 (USD BILLIONS)
TABLE 94. INDONESIA PROPERTY INSURANCE INDUSTRY SIZE ESTIMATES & FORECAST, BY END USE, 2019-2035 (USD BILLIONS)
TABLE 95. INDONESIA PROPERTY INSURANCE INDUSTRY SIZE ESTIMATES & FORECAST, BY DISTRIBUTION CHANNEL, 2019-2035 (USD BILLIONS)
TABLE 96. INDONESIA PROPERTY INSURANCE INDUSTRY SIZE ESTIMATES & FORECAST, BY REGIONAL, 2019-2035 (USD BILLIONS)
TABLE 97. REST OF APAC PROPERTY INSURANCE INDUSTRY SIZE ESTIMATES & FORECAST, BY INSURANCE TYPE, 2019-2035 (USD BILLIONS)
TABLE 98. REST OF APAC PROPERTY INSURANCE INDUSTRY SIZE ESTIMATES & FORECAST, BY COVERAGE TYPE, 2019-2035 (USD BILLIONS)
TABLE 99. REST OF APAC PROPERTY INSURANCE INDUSTRY SIZE ESTIMATES & FORECAST, BY END USE, 2019-2035 (USD BILLIONS)
TABLE 100. REST OF APAC PROPERTY INSURANCE INDUSTRY SIZE ESTIMATES & FORECAST, BY DISTRIBUTION CHANNEL, 2019-2035 (USD BILLIONS)
TABLE 101. REST OF APAC PROPERTY INSURANCE INDUSTRY SIZE ESTIMATES & FORECAST, BY REGIONAL, 2019-2035 (USD BILLIONS)
TABLE 102. SOUTH AMERICA PROPERTY INSURANCE INDUSTRY SIZE ESTIMATES & FORECAST, BY INSURANCE TYPE, 2019-2035 (USD BILLIONS)
TABLE 103. SOUTH AMERICA PROPERTY INSURANCE INDUSTRY SIZE ESTIMATES & FORECAST, BY COVERAGE TYPE, 2019-2035 (USD BILLIONS)
TABLE 104. SOUTH AMERICA PROPERTY INSURANCE INDUSTRY SIZE ESTIMATES & FORECAST, BY END USE, 2019-2035 (USD BILLIONS)
TABLE 105. SOUTH AMERICA PROPERTY INSURANCE INDUSTRY SIZE ESTIMATES & FORECAST, BY DISTRIBUTION CHANNEL, 2019-2035 (USD BILLIONS)
TABLE 106. SOUTH AMERICA MARKET SIZE ESTIMATES & FORECAST, BY REGIONAL, 2019-2035 (USD BILLIONS)
TABLE 107. BRAZIL MARKET SIZE ESTIMATES & FORECAST, BY INSURANCE TYPE, 2019-2035 (USD BILLIONS)
TABLE 108. BRAZIL MARKET SIZE ESTIMATES & FORECAST, BY COVERAGE TYPE, 2019-2035 (USD BILLIONS)
TABLE 109. BRAZIL MARKET SIZE ESTIMATES & FORECAST, BY END USE, 2019-2035 (USD BILLIONS)
TABLE 110. BRAZIL MARKET SIZE ESTIMATES & FORECAST, BY DISTRIBUTION CHANNEL, 2019-2035 (USD BILLIONS)
TABLE 111. BRAZIL MARKET SIZE ESTIMATES & FORECAST, BY REGIONAL, 2019-2035 (USD BILLIONS)
TABLE 112. MEXICO MARKET SIZE ESTIMATES & FORECAST, BY INSURANCE TYPE, 2019-2035 (USD BILLIONS)
TABLE 113. MEXICO MARKET SIZE ESTIMATES & FORECAST, BY COVERAGE TYPE, 2019-2035 (USD BILLIONS)
TABLE 114. MEXICO MARKET SIZE ESTIMATES & FORECAST, BY END USE, 2019-2035 (USD BILLIONS)
TABLE 115. MEXICO MARKET SIZE ESTIMATES & FORECAST, BY DISTRIBUTION CHANNEL, 2019-2035 (USD BILLIONS)
TABLE 116. MEXICO MARKET SIZE ESTIMATES & FORECAST, BY REGIONAL, 2019-2035 (USD BILLIONS)
TABLE 117. ARGENTINA MARKET SIZE ESTIMATES & FORECAST, BY INSURANCE TYPE, 2019-2035 (USD BILLIONS)
TABLE 118. ARGENTINA MARKET SIZE ESTIMATES & FORECAST, BY COVERAGE TYPE, 2019-2035 (USD BILLIONS)
TABLE 119. ARGENTINA MARKET SIZE ESTIMATES & FORECAST, BY END USE, 2019-2035 (USD BILLIONS)
TABLE 120. ARGENTINA MARKET SIZE ESTIMATES & FORECAST, BY DISTRIBUTION CHANNEL, 2019-2035 (USD BILLIONS)
TABLE 121. ARGENTINA MARKET SIZE ESTIMATES & FORECAST, BY REGIONAL, 2019-2035 (USD BILLIONS)
TABLE 122. REST OF SOUTH AMERICA MARKET SIZE ESTIMATES & FORECAST, BY INSURANCE TYPE, 2019-2035 (USD BILLIONS)
TABLE 123. REST OF SOUTH AMERICA MARKET SIZE ESTIMATES & FORECAST, BY COVERAGE TYPE, 2019-2035 (USD BILLIONS)
TABLE 124. REST OF SOUTH AMERICA MARKET SIZE ESTIMATES & FORECAST, BY END USE, 2019-2035 (USD BILLIONS)
TABLE 125. REST OF SOUTH AMERICA MARKET SIZE ESTIMATES & FORECAST, BY DISTRIBUTION CHANNEL, 2019-2035 (USD BILLIONS)
TABLE 126. REST OF SOUTH AMERICA MARKET SIZE ESTIMATES & FORECAST, BY REGIONAL, 2019-2035 (USD BILLIONS)
TABLE 127. MEA MARKET SIZE ESTIMATES & FORECAST, BY INSURANCE TYPE, 2019-2035 (USD BILLIONS)
TABLE 128. MEA MARKET SIZE ESTIMATES & FORECAST, BY COVERAGE TYPE, 2019-2035 (USD BILLIONS)
TABLE 129. MEA MARKET SIZE ESTIMATES & FORECAST, BY END USE, 2019-2035 (USD BILLIONS)
TABLE 130. MEA MARKET SIZE ESTIMATES & FORECAST, BY DISTRIBUTION CHANNEL, 2019-2035 (USD BILLIONS)
TABLE 131. MEA MARKET SIZE ESTIMATES & FORECAST, BY REGIONAL, 2019-2035 (USD BILLIONS)
TABLE 132. GCC COUNTRIES MARKET SIZE ESTIMATES & FORECAST, BY INSURANCE TYPE, 2019-2035 (USD BILLIONS)
TABLE 133. GCC COUNTRIES MARKET SIZE ESTIMATES & FORECAST, BY COVERAGE TYPE, 2019-2035 (USD BILLIONS)
TABLE 134. GCC COUNTRIES MARKET SIZE ESTIMATES & FORECAST, BY END USE, 2019-2035 (USD BILLIONS)
TABLE 135. GCC COUNTRIES MARKET SIZE ESTIMATES & FORECAST, BY DISTRIBUTION CHANNEL, 2019-2035 (USD BILLIONS)
TABLE 136. GCC COUNTRIES MARKET SIZE ESTIMATES & FORECAST, BY REGIONAL, 2019-2035 (USD BILLIONS)
TABLE 137. SOUTH AFRICA MARKET SIZE ESTIMATES & FORECAST, BY INSURANCE TYPE, 2019-2035 (USD BILLIONS)
TABLE 138. SOUTH AFRICA MARKET SIZE ESTIMATES & FORECAST, BY COVERAGE TYPE, 2019-2035 (USD BILLIONS)
TABLE 139. SOUTH AFRICA MARKET SIZE ESTIMATES & FORECAST, BY END USE, 2019-2035 (USD BILLIONS)
TABLE 140. SOUTH AFRICA MARKET SIZE ESTIMATES & FORECAST, BY DISTRIBUTION CHANNEL, 2019-2035 (USD BILLIONS)
TABLE 141. SOUTH AFRICA MARKET SIZE ESTIMATES & FORECAST, BY REGIONAL, 2019-2035 (USD BILLIONS)
TABLE 142. REST OF MEA MARKET SIZE ESTIMATES & FORECAST, BY INSURANCE TYPE, 2019-2035 (USD BILLIONS)
TABLE 143. REST OF MEA MARKET SIZE ESTIMATES & FORECAST, BY COVERAGE TYPE, 2019-2035 (USD BILLIONS)
TABLE 144. REST OF MEA MARKET SIZE ESTIMATES & FORECAST, BY END USE, 2019-2035 (USD BILLIONS)
TABLE 145. REST OF MEA MARKET SIZE ESTIMATES & FORECAST, BY DISTRIBUTION CHANNEL, 2019-2035 (USD BILLIONS)
TABLE 146. REST OF MEA PROPERTY INSURANCE MARKET SIZE ESTIMATES & FORECAST, BY REGIONAL, 2019-2035 (USD BILLIONS)
TABLE 147. PRODUCT LAUNCH/PRODUCT DEVELOPMENT/APPROVAL
TABLE 148. ACQUISITION/PARTNERSHIP
LIST OF FIGURES
FIGURE 1. MARKET SYNOPSIS
FIGURE 2. NORTH AMERICA MARKET ANALYSIS
FIGURE 3. US MARKET ANALYSIS BY INSURANCE TYPE
FIGURE 4. US MARKET ANALYSIS BY COVERAGE TYPE
FIGURE 5. US MARKET ANALYSIS BY END USE
FIGURE 6. US MARKET ANALYSIS BY DISTRIBUTION CHANNEL
FIGURE 7. US MARKET ANALYSIS BY REGIONAL
FIGURE 8. CANADA MARKET ANALYSIS BY INSURANCE TYPE
FIGURE 9. CANADA MARKET ANALYSIS BY COVERAGE TYPE
FIGURE 10. CANADA MARKET ANALYSIS BY END USE
FIGURE 11. CANADA MARKET ANALYSIS BY DISTRIBUTION CHANNEL
FIGURE 12. CANADA MARKET ANALYSIS BY REGIONAL
FIGURE 13. EUROPE MARKET ANALYSIS
FIGURE 14. GERMANY MARKET ANALYSIS BY INSURANCE TYPE
FIGURE 15. GERMANY MARKET ANALYSIS BY COVERAGE TYPE
FIGURE 16. GERMANY MARKET ANALYSIS BY END USE
FIGURE 17. GERMANY MARKET ANALYSIS BY DISTRIBUTION CHANNEL
FIGURE 18. GERMANY MARKET ANALYSIS BY REGIONAL
FIGURE 19. UK MARKET ANALYSIS BY INSURANCE TYPE
FIGURE 20. UK MARKET ANALYSIS BY COVERAGE TYPE
FIGURE 21. UK MARKET ANALYSIS BY END USE
FIGURE 22. UK MARKET ANALYSIS BY DISTRIBUTION CHANNEL
FIGURE 23. UK MARKET ANALYSIS BY REGIONAL
FIGURE 24. FRANCE MARKET ANALYSIS BY INSURANCE TYPE
FIGURE 25. FRANCE MARKET ANALYSIS BY COVERAGE TYPE
FIGURE 26. FRANCE MARKET ANALYSIS BY END USE
FIGURE 27. FRANCE MARKET ANALYSIS BY DISTRIBUTION CHANNEL
FIGURE 28. FRANCE MARKET ANALYSIS BY REGIONAL
FIGURE 29. RUSSIA MARKET ANALYSIS BY INSURANCE TYPE
FIGURE 30. RUSSIA MARKET ANALYSIS BY COVERAGE TYPE
FIGURE 31. RUSSIA MARKET ANALYSIS BY END USE
FIGURE 32. RUSSIA MARKET ANALYSIS BY DISTRIBUTION CHANNEL
FIGURE 33. RUSSIA MARKET ANALYSIS BY REGIONAL
FIGURE 34. ITALY MARKET ANALYSIS BY INSURANCE TYPE
FIGURE 35. ITALY MARKET ANALYSIS BY COVERAGE TYPE
FIGURE 36. ITALY MARKET ANALYSIS BY END USE
FIGURE 37. ITALY MARKET ANALYSIS BY DISTRIBUTION CHANNEL
FIGURE 38. ITALY MARKET ANALYSIS BY REGIONAL
FIGURE 39. SPAIN MARKET ANALYSIS BY INSURANCE TYPE
FIGURE 40. SPAIN MARKET ANALYSIS BY COVERAGE TYPE
FIGURE 41. SPAIN MARKET ANALYSIS BY END USE
FIGURE 42. SPAIN MARKET ANALYSIS BY DISTRIBUTION CHANNEL
FIGURE 43. SPAIN MARKET ANALYSIS BY REGIONAL
FIGURE 44. REST OF EUROPE MARKET ANALYSIS BY INSURANCE TYPE
FIGURE 45. REST OF EUROPE MARKET ANALYSIS BY COVERAGE TYPE
FIGURE 46. REST OF EUROPE MARKET ANALYSIS BY END USE
FIGURE 47. REST OF EUROPE MARKET ANALYSIS BY DISTRIBUTION CHANNEL
FIGURE 48. REST OF EUROPE MARKET ANALYSIS BY REGIONAL
FIGURE 49. APAC MARKET ANALYSIS
FIGURE 50. CHINA MARKET ANALYSIS BY INSURANCE TYPE
FIGURE 51. CHINA MARKET ANALYSIS BY COVERAGE TYPE
FIGURE 52. CHINA MARKET ANALYSIS BY END USE
FIGURE 53. CHINA MARKET ANALYSIS BY DISTRIBUTION CHANNEL
FIGURE 54. CHINA MARKET ANALYSIS BY REGIONAL
FIGURE 55. INDIA MARKET ANALYSIS BY INSURANCE TYPE
FIGURE 56. INDIA MARKET ANALYSIS BY COVERAGE TYPE
FIGURE 57. INDIA MARKET ANALYSIS BY END USE
FIGURE 58. INDIA MARKET ANALYSIS BY DISTRIBUTION CHANNEL
FIGURE 59. INDIA MARKET ANALYSIS BY REGIONAL
FIGURE 60. JAPAN MARKET ANALYSIS BY INSURANCE TYPE
FIGURE 61. JAPAN MARKET ANALYSIS BY COVERAGE TYPE
FIGURE 62. JAPAN MARKET ANALYSIS BY END USE
FIGURE 63. JAPAN MARKET ANALYSIS BY DISTRIBUTION CHANNEL
FIGURE 64. JAPAN MARKET ANALYSIS BY REGIONAL
FIGURE 65. SOUTH KOREA MARKET ANALYSIS BY INSURANCE TYPE
FIGURE 66. SOUTH KOREA MARKET ANALYSIS BY COVERAGE TYPE
FIGURE 67. SOUTH KOREA MARKET ANALYSIS BY END USE
FIGURE 68. SOUTH KOREA MARKET ANALYSIS BY DISTRIBUTION CHANNEL
FIGURE 69. SOUTH KOREA MARKET ANALYSIS BY REGIONAL
FIGURE 70. MALAYSIA MARKET ANALYSIS BY INSURANCE TYPE
FIGURE 71. MALAYSIA MARKET ANALYSIS BY COVERAGE TYPE
FIGURE 72. MALAYSIA MARKET ANALYSIS BY END USE
FIGURE 73. MALAYSIA MARKET ANALYSIS BY DISTRIBUTION CHANNEL
FIGURE 74. MALAYSIA MARKET ANALYSIS BY REGIONAL
FIGURE 75. THAILAND MARKET ANALYSIS BY INSURANCE TYPE
FIGURE 76. THAILAND MARKET ANALYSIS BY COVERAGE TYPE
FIGURE 77. THAILAND MARKET ANALYSIS BY END USE
FIGURE 78. THAILAND MARKET ANALYSIS BY DISTRIBUTION CHANNEL
FIGURE 79. THAILAND MARKET ANALYSIS BY REGIONAL
FIGURE 80. INDONESIA MARKET ANALYSIS BY INSURANCE TYPE
FIGURE 81. INDONESIA MARKET ANALYSIS BY COVERAGE TYPE
FIGURE 82. INDONESIA MARKET ANALYSIS BY END USE
FIGURE 83. INDONESIA MARKET ANALYSIS BY DISTRIBUTION CHANNEL
FIGURE 84. INDONESIA MARKET ANALYSIS BY REGIONAL
FIGURE 85. REST OF APAC MARKET ANALYSIS BY INSURANCE TYPE
FIGURE 86. REST OF APAC MARKET ANALYSIS BY COVERAGE TYPE
FIGURE 87. REST OF APAC MARKET ANALYSIS BY END USE
FIGURE 88. REST OF APAC MARKET ANALYSIS BY DISTRIBUTION CHANNEL
FIGURE 89. REST OF APAC MARKET ANALYSIS BY REGIONAL
FIGURE 90. SOUTH AMERICA MARKET ANALYSIS
FIGURE 91. BRAZIL MARKET ANALYSIS BY INSURANCE TYPE
FIGURE 92. BRAZIL MARKET ANALYSIS BY COVERAGE TYPE
FIGURE 93. BRAZIL MARKET ANALYSIS BY END USE
FIGURE 94. BRAZIL MARKET ANALYSIS BY DISTRIBUTION CHANNEL
FIGURE 95. BRAZIL MARKET ANALYSIS BY REGIONAL
FIGURE 96. MEXICO MARKET ANALYSIS BY INSURANCE TYPE
FIGURE 97. MEXICO MARKET ANALYSIS BY COVERAGE TYPE
FIGURE 98. MEXICO MARKET ANALYSIS BY END USE
FIGURE 99. MEXICO MARKET ANALYSIS BY DISTRIBUTION CHANNEL
FIGURE 100. MEXICO MARKET ANALYSIS BY REGIONAL
FIGURE 101. ARGENTINA MARKET ANALYSIS BY INSURANCE TYPE
FIGURE 102. ARGENTINA MARKET ANALYSIS BY COVERAGE TYPE
FIGURE 103. ARGENTINA MARKET ANALYSIS BY END USE
FIGURE 104. ARGENTINA MARKET ANALYSIS BY DISTRIBUTION CHANNEL
FIGURE 105. ARGENTINA MARKET ANALYSIS BY REGIONAL
FIGURE 106. REST OF SOUTH AMERICA MARKET ANALYSIS BY INSURANCE TYPE
FIGURE 107. REST OF SOUTH AMERICA MARKET ANALYSIS BY COVERAGE TYPE
FIGURE 108. REST OF SOUTH AMERICA MARKET ANALYSIS BY END USE
FIGURE 109. REST OF SOUTH AMERICA MARKET ANALYSIS BY DISTRIBUTION CHANNEL
FIGURE 110. REST OF SOUTH AMERICA MARKET ANALYSIS BY REGIONAL
FIGURE 111. MEA MARKET ANALYSIS
FIGURE 112. GCC COUNTRIES MARKET ANALYSIS BY INSURANCE TYPE
FIGURE 113. GCC COUNTRIES MARKET ANALYSIS BY COVERAGE TYPE
FIGURE 114. GCC COUNTRIES MARKET ANALYSIS BY END USE
FIGURE 115. GCC COUNTRIES MARKET ANALYSIS BY DISTRIBUTION CHANNEL
FIGURE 116. GCC COUNTRIES MARKET ANALYSIS BY REGIONAL
FIGURE 117. SOUTH AFRICA MARKET ANALYSIS BY INSURANCE TYPE
FIGURE 118. SOUTH AFRICA MARKET ANALYSIS BY COVERAGE TYPE
FIGURE 119. SOUTH AFRICA MARKET ANALYSIS BY END USE
FIGURE 120. SOUTH AFRICA MARKET ANALYSIS BY DISTRIBUTION CHANNEL
FIGURE 121. SOUTH AFRICA MARKET ANALYSIS BY REGIONAL
FIGURE 122. REST OF MEA MARKET ANALYSIS BY INSURANCE TYPE
FIGURE 123. REST OF MEA MARKET ANALYSIS BY COVERAGE TYPE
FIGURE 124. REST OF MEA MARKET ANALYSIS BY END USE
FIGURE 125. REST OF MEA MARKET ANALYSIS BY DISTRIBUTION CHANNEL
FIGURE 126. REST OF MEA MARKET ANALYSIS BY REGIONAL
FIGURE 127. KEY BUYING CRITERIA OF MARKET
FIGURE 128. RESEARCH PROCESS OF MRFR
FIGURE 129. DRO ANALYSIS OF MARKET
FIGURE 130. DRIVERS IMPACT ANALYSIS: MARKET
FIGURE 131. RESTRAINTS IMPACT ANALYSIS: MARKET
FIGURE 132. SUPPLY / VALUE CHAIN: MARKET
FIGURE 133. MARKET, BY INSURANCE TYPE, 2025 (% SHARE)
FIGURE 134. MARKET, BY INSURANCE TYPE, 2019 TO 2035 (USD Billions)
FIGURE 135. MARKET, BY COVERAGE TYPE, 2025 (% SHARE)
FIGURE 136. MARKET, BY COVERAGE TYPE, 2019 TO 2035 (USD Billions)
FIGURE 137. MARKET, BY END USE, 2025 (% SHARE)
FIGURE 138. MARKET, BY END USE, 2019 TO 2035 (USD Billions)
FIGURE 139. MARKET, BY DISTRIBUTION CHANNEL, 2025 (% SHARE)
FIGURE 140. MARKET, BY DISTRIBUTION CHANNEL, 2019 TO 2035 (USD Billions)
FIGURE 141. MARKET, BY REGIONAL, 2025 (% SHARE)
FIGURE 142. MARKET, BY REGIONAL, 2019 TO 2035 (USD Billions)
FIGURE 143. BENCHMARKING OF MAJOR COMPETITORS