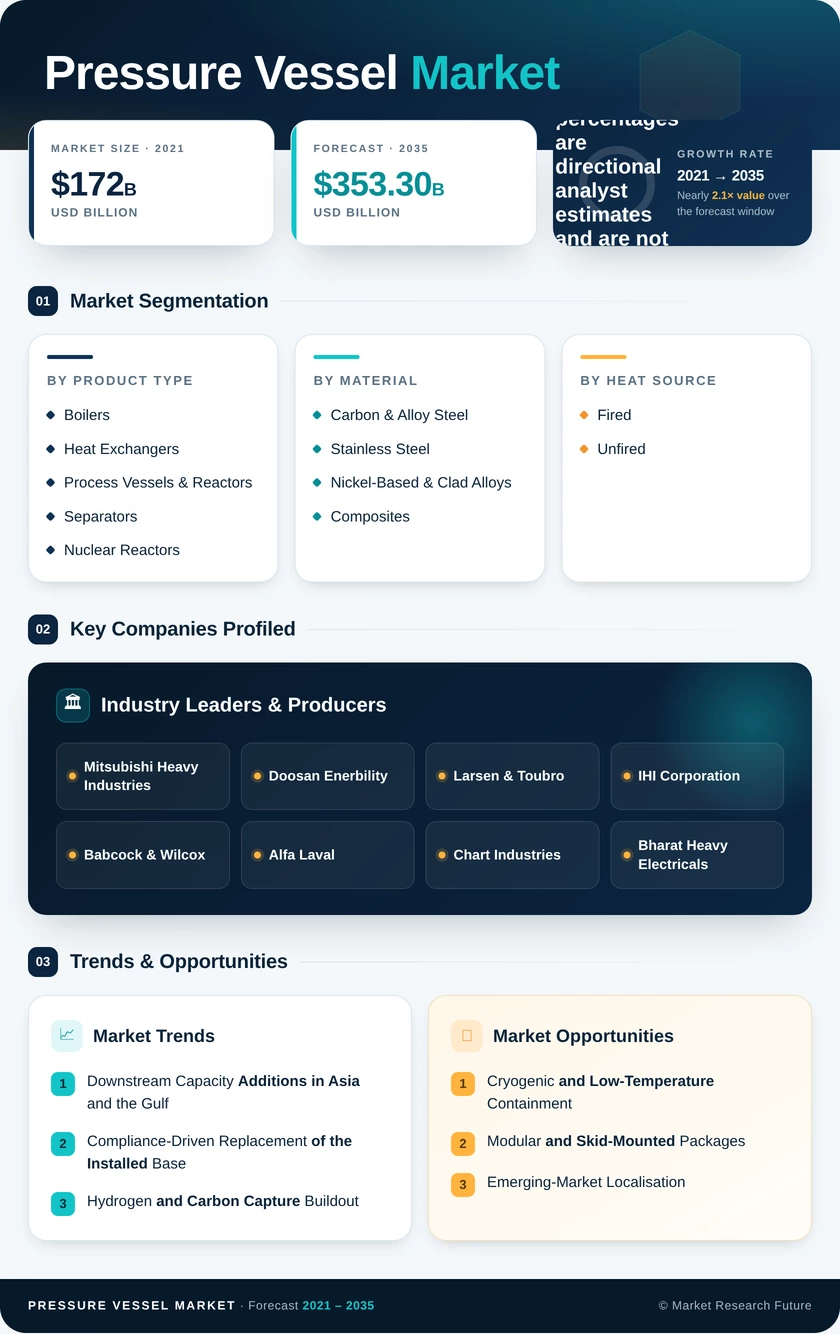
Pressure Vessel Market (2026 - 2035)

ID: MRFR/EnP/2352-HCR 111 Pages Priya Nagrale Last Updated: October 17, 2026
Pressure Vessel Market Research Report By Product Type (Boilers, Heat Exchangers, Process Vessels & Reactors, Separators, Nuclear Reactors, Storage & Transport Vessels), By Material (Carbon & Alloy Steel, Stainless Steel, Nickel-Based & Clad Alloys, Composites), By Heat Source (Fired, Unfired), By End-User Industry (Oil & Gas, Chemical & Petrochemical, Power Generation, Food & Beverage, Pharmaceutical, Water Treatment, Others) - Forecast to 2035
Pressure Vessel Market
Market Size
Forecast Period2026-2035
CAGR (2026-2035)5.1%
2025 Market SizeUSD 214.8 Billion
2035 Market SizeUSD 353.3 Billion
Key Players
Mitsubishi Heavy Industries
Doosan Enerbility
Larsen & Toubro
IHI Corporation
Babcock & Wilcox
Alfa Laval
Opportunities
  • Cryogenic and Low-Temperature Containment
  • Modular and Skid-Mounted Packages
  • Emerging-Market Localisation
  1. 1 Market Overview | |
    1. 1.1 Study Assumptions & Market Definition | |
    2. 1.2 Scope of the Study | |
    3. 1.3 Research Methodology | |
  2. 2 Market Summary & Key Report Takeaways | |
    1. 2.1 Takeaways by Product Type | |
    2. 2.2 Takeaways by End-User Sector | |
    3. 2.3 Takeaways by Region | |
  3. 3 Global Market Size & Forecast (2021–2035) | |
    1. 3.1 Historical Market Size (2021–2025) | |
    2. 3.2 Current & Forecast Market Size (2026–2035) | |
    3. 3.3 Market Size by Revenue (USD Billion) | |
    4. 3.4 Year-over-Year Growth Analysis | |
  4. 4 Driver Impact Analysis | |
    1. 4.1 Downstream Capacity Additions in Asia and the Gulf | |
    2. 4.2 Compliance-Driven Replacement of the Installed Base | |
    3. 4.3 Hydrogen and Carbon Capture Buildout | |
    4. 4.4 Power Generation Renewal | |
  5. 5 Restraints Impact Analysis | |
    1. 5.1 Input Cost Volatility | |
    2. 5.2 Skilled Labour and Certification Bottlenecks | |
    3. 5.3 Forging Supply Concentration | |
  6. 6 Market Opportunity Analysis | |
    1. 6.1 Cryogenic and Low-Temperature Containment | |
    2. 6.2 Modular and Skid-Mounted Packages | |
    3. 6.3 Emerging-Market Localisation | |
    4. 6.4 Inspection-as-a-Service and Digital Aftermarket | |
    5. 6.5 Nuclear Small Modular Reactor Supply Chains | |
    6. 6.6 Industry Value Chain Analysis | |
    7. 6.7 Porter's Five Forces Analysis | |
  7. 7 Regional Analysis | |
    1. 7.1 North America | | |
      1. 7.1.1 United States | | |
      2. 7.1.2 Canada | | |
      3. 7.1.3 Mexico | |
    2. 7.2 Europe | | |
      1. 7.2.1 Germany | | |
      2. 7.2.2 Italy | | |
      3. 7.2.3 France | | |
      4. 7.2.4 United Kingdom | | |
      5. 7.2.5 Rest of Europe | |
    3. 7.3 Asia-Pacific | | |
      1. 7.3.1 China | | |
      2. 7.3.2 India | | |
      3. 7.3.3 Japan | | |
      4. 7.3.4 South Korea | | |
      5. 7.3.5 Rest of Asia-Pacific | |
    4. 7.4 South America | | |
      1. 7.4.1 Brazil | | |
      2. 7.4.2 Argentina | | |
      3. 7.4.3 Rest of South America | |
    5. 7.5 Middle East & Africa | | |
      1. 7.5.1 Saudi Arabia | | |
      2. 7.5.2 United Arab Emirates | | |
      3. 7.5.3 Qatar | | |
      4. 7.5.4 South Africa | | |
      5. 7.5.5 Rest of Middle East & Africa | |
  8. 8 Future Outlook (2026–2035) | |
    1. 8.1 Predictive Integrity Management | |
    2. 8.2 Materials Substitution | |
    3. 8.3 Decarbonised Process Heat | |
    4. 8.4 Supply Chain Regionalisation | |
  9. 9 Segmentation Analysis | |
    1. 9.1 By Product Type | | |
      1. 9.1.1 Boilers | | |
      2. 9.1.2 Heat Exchangers | | |
      3. 9.1.3 Process Vessels & Reactors | | |
      4. 9.1.4 Separators | | |
      5. 9.1.5 Nuclear Reactors | | |
      6. 9.1.6 Storage & Transport Vessels | |
    2. 9.2 By Material | | |
      1. 9.2.1 Carbon & Alloy Steel | | |
      2. 9.2.2 Stainless Steel | | |
      3. 9.2.3 Nickel-Based & Clad Alloys | | |
      4. 9.2.4 Composites | |
    3. 9.3 By Heat Source | | |
      1. 9.3.1 Fired | | |
      2. 9.3.2 Unfired | |
    4. 9.4 By End-User Industry | | |
      1. 9.4.1 Oil & Gas | | |
      2. 9.4.2 Chemical & Petrochemical | | |
      3. 9.4.3 Power Generation | | |
      4. 9.4.4 Food & Beverage | | |
      5. 9.4.5 Pharmaceutical | | |
      6. 9.4.6 Water Treatment | | |
      7. 9.4.7 Others | |
  10. 10 Competitive Landscape | |
    1. 10.1 Market Share Analysis (2026) | |
    2. 10.2 Competitive Benchmarking Matrix | |
    3. 10.3 Company Profiles | | |
      1. 10.3.1 Mitsubishi Heavy Industries | | |
      2. 10.3.2 Doosan Enerbility | | |
      3. 10.3.3 Larsen & Toubro | | |
      4. 10.3.4 IHI Corporation | | |
      5. 10.3.5 Babcock & Wilcox | | |
      6. 10.3.6 Alfa Laval | | |
      7. 10.3.7 Chart Industries | | |
      8. 10.3.8 Bharat Heavy Electricals | | |
      9. 10.3.9 Hitachi Zosen | | |
      10. 10.3.10 Hexagon Purus | |
  11. 11 Recent Developments & News | |
  12. 12 Report Scope & Methodology | |
    1. 12.1 Study Period & Base Year | |
    2. 12.2 Data Sources & Citations | |
    3. 12.3 Abbreviations | |
  13. 13 Detailed Sources and Citations | |
  14. 14 Frequently Asked Questions | | LIST OF TABLES | |
  15. TABLE 1 Global Pressure Vessel Market Size & Forecast, by Revenue (USD Billion), 2021–2035 | |
  16. TABLE 2 Global Market – Year-over-Year Growth Analysis, 2021–2035 | |
  17. TABLE 3 Driver Impact Analysis Matrix, 2026–2035 | |
  18. TABLE 4 Restraint Impact Analysis Matrix, 2026–2035 | |
  19. TABLE 5 Global Market Size, by Region, 2021–2035 (USD Billion) | |
  20. TABLE 6 North America Market Size, by Country, 2021–2035 (USD Billion) | |
  21. TABLE 7 Europe Market Size, by Country, 2021–2035 (USD Billion) | |
  22. TABLE 8 Asia-Pacific Market Size, by Country, 2021–2035 (USD Billion) | |
  23. TABLE 9 South America Market Size, by Country, 2021–2035 (USD Billion) | |
  24. TABLE 10 Middle East & Africa Market Size, by Country, 2021–2035 (USD Billion) | |
  25. TABLE 11 Global Market Size, by Product Type, 2021–2035 (USD Billion) | |
  26. TABLE 12 Global Market Size, by Material, 2021–2035 (USD Billion) | |
  27. TABLE 13 Global Market Size, by Heat Source, 2021–2035 (USD Billion) | |
  28. TABLE 14 Global Market Size, by End-User Industry, 2021–2035 (USD Billion) | |
  29. TABLE 15 North America Market Size, by Product Type, 2021–2035 (USD Billion) | |
  30. TABLE 16 North America Market Size, by End-User Industry, 2021–2035 (USD Billion) | |
  31. TABLE 17 Europe Market Size, by Product Type, 2021–2035 (USD Billion) | |
  32. TABLE 18 Europe Market Size, by End-User Industry, 2021–2035 (USD Billion) | |
  33. TABLE 19 Asia-Pacific Market Size, by Product Type, 2021–2035 (USD Billion) | |
  34. TABLE 20 Asia-Pacific Market Size, by End-User Industry, 2021–2035 (USD Billion) | |
  35. TABLE 21 South America Market Size, by Product Type, 2021–2035 (USD Billion) | |
  36. TABLE 22 Middle East & Africa Market Size, by Product Type, 2021–2035 (USD Billion) | |
  37. TABLE 23 Competitive Benchmarking Matrix, 2026 | |
  38. TABLE 24 Company Profiles – Key Players | |
  39. TABLE 25 Recent Developments & Strategic Announcements, 2023–2025 | |
  40. TABLE 26 Report Scope & Methodology Summary | |
  41. TABLE 27 Detailed Sources and Citations | | LIST OF FIGURES | |
  42. FIGURE 1 Market Dynamics – Drivers, Restraints, Opportunities and Challenges | |
  43. FIGURE 2 Industry Value Chain Analysis | |
  44. FIGURE 3 Porter's Five Forces Analysis | |
  45. FIGURE 4 Global Market Size Trend, 2021–2035 (USD Billion) | |
  46. FIGURE 5 Year-over-Year Growth Trend, 2022–2035 (%) | |
  47. FIGURE 6 Market Share by Product Type, 2025 vs 2035 (%) | |
  48. FIGURE 7 Market Share by Material, 2025 vs 2035 (%) | |
  49. FIGURE 8 Market Share by Heat Source, 2025 (%) | |
  50. FIGURE 9 Market Share by End-User Industry, 2025 (%) | |
  51. FIGURE 10 Regional Revenue Share, 2025 (%) | |
  52. FIGURE 11 Regional CAGR Comparison, 2026–2035 (%) | |
  53. FIGURE 12 Country-Level Revenue Contribution, Top 10 Markets, 2025 | |
  54. FIGURE 13 Competitive Landscape – Estimated Revenue Share Bands, 2026 | |
  55. FIGURE 14 Strategic Positioning Matrix – Key Players

Segmentation Quick Reference

DimensionSub-SegmentsDominant SegmentFastest Growing Segment
By Product TypeBoilers; Heat Exchangers; Process Vessels & Reactors; Separators; Nuclear Reactors; Storage & Transport VesselsBoilersStorage & Transport Vessels
By MaterialCarbon & Alloy Steel; Stainless Steel; Nickel-Based & Clad Alloys; CompositesCarbon & Alloy SteelComposites
By Heat SourceFired; UnfiredUnfiredUnfired
By End-User IndustryOil & Gas; Chemical & Petrochemical; Power Generation; Food & Beverage; Pharmaceutical; Water Treatment; OthersOil & GasPharmaceutical
By RegionNorth America; Europe; Asia-Pacific; South America; Middle East & AfricaAsia-PacificMiddle East & Africa


Market Segmentation Overview

By Product Type

Sub-SegmentKey Trend
BoilersReplacement-led demand as fleets extend operating life
Heat ExchangersEfficiency mandates driving welded-plate substitution
Process Vessels & ReactorsHigher alloy content lifting revenue faster than tonnage
SeparatorsTied to upstream activity and gas processing buildout
Nuclear ReactorsNew build plus modular programmes reviving order flow
Storage & Transport VesselsIndustrial gas and hydrogen logistics expanding fastest


Product demand is shifting from combustion-linked equipment toward containment and thermal transfer. Boilers retain the largest revenue base, but growth increasingly sits in storage categories serving gas logistics and clean-fuel supply chains.

By Material

Sub-SegmentKey Trend
Carbon & Alloy SteelDefault choice for standard service; share slowly eroding
Stainless SteelGrowth from hygienic and corrosive-duty applications
Nickel-Based & Clad AlloysClad construction winning on cost versus solid alloy
CompositesHigh-pressure mobile service driving fastest expansion


Metallurgy choices increasingly reflect lifecycle cost rather than installed price. Clad plate has become the practical compromise for severe service, while composites remain confined to applications where weight or cycling economics justify the premium.

By Heat Source

Sub-SegmentKey Trend
FiredSteady in coal- and gas-heavy regions; flat elsewhere
UnfiredExpanding with process electrification and storage duty


Unfired equipment gains share as industrial heating decarbonises and as storage applications multiply. Fired equipment remains resilient in Asia, where thermal generation additions continue.

By End-User Industry

Sub-SegmentKey Trend
Oil & GasStill the anchor sector, though share is gradually declining
Chemical & PetrochemicalCapacity additions in Asia and the Gulf sustaining orders
Power GenerationRenewal and nuclear programmes stabilising demand
Food & BeverageSterilisation and processing capacity in emerging economies
PharmaceuticalBiologics buildout driving high-specification stainless demand
Water TreatmentDesalination and reuse programmes expanding steadily
OthersMining, pulp, and aerospace applications


End-user concentration has loosened meaningfully since 2021. Hydrocarbon sectors remain dominant in absolute terms, but pharmaceutical, water, and clean-fuel buyers now contribute a growing and less cyclical share of order intake.




Download PDF ×

We do not share your information with anyone. However, we may send you emails based on your report interest from time to time. You may contact us at any time to opt-out.