info@marketresearchfuture.com   📞 +1 (855) 661-4441(US)   📞 +44 1720 412 167(UK)   📞 +91 2269738890(APAC)
Certified Global Research Member
Isomar 1 Iso 1
Key Questions Answered
  • Global Market Outlook
  • In-depth analysis of global and regional trends
  • Analyze and identify the major players in the market, their market share, key developments, etc.
  • To understand the capability of the major players based on products offered, financials, and strategies.
  • Identify disrupting products, companies, and trends.
  • To identify opportunities in the market.
  • Analyze the key challenges in the market.
  • Analyze the regional penetration of players, products, and services in the market.
  • Comparison of major players financial performance.
  • Evaluate strategies adopted by major players.
  • Recommendations
Why Choose Market Research Future?
  • Vigorous research methodologies for specific market.
  • Knowledge partners across the globe
  • Large network of partner consultants.
  • Ever-increasing/ Escalating data base with quarterly monitoring of various markets
  • Trusted by fortune 500 companies/startups/ universities/organizations
  • Large database of 5000+ markets reports.
  • Effective and prompt pre- and post-sales support.

Pressure Pumping Market Research Report By Service Type (Hydraulic Fracturing, Acidizing, Cementing, Coiled Tubing, Well Intervention), By Application (Onshore, Offshore, Decommissioning, Well Completion), By Technology (Conventional Pressure Pumping, High-Pressure Pumping, Multistage Fracturing), By End Use (Oil and Gas, Mining, Geothermal Energy) and By Regional (North America, Europe, South America, Asia Pacific, Middle East and Africa) - Forecast to 2035


ID: MRFR/E&P/0846-HCR | 120 Pages | Author: Anshula Mandaokar| August 2025

Pressure Pumping Market Summary

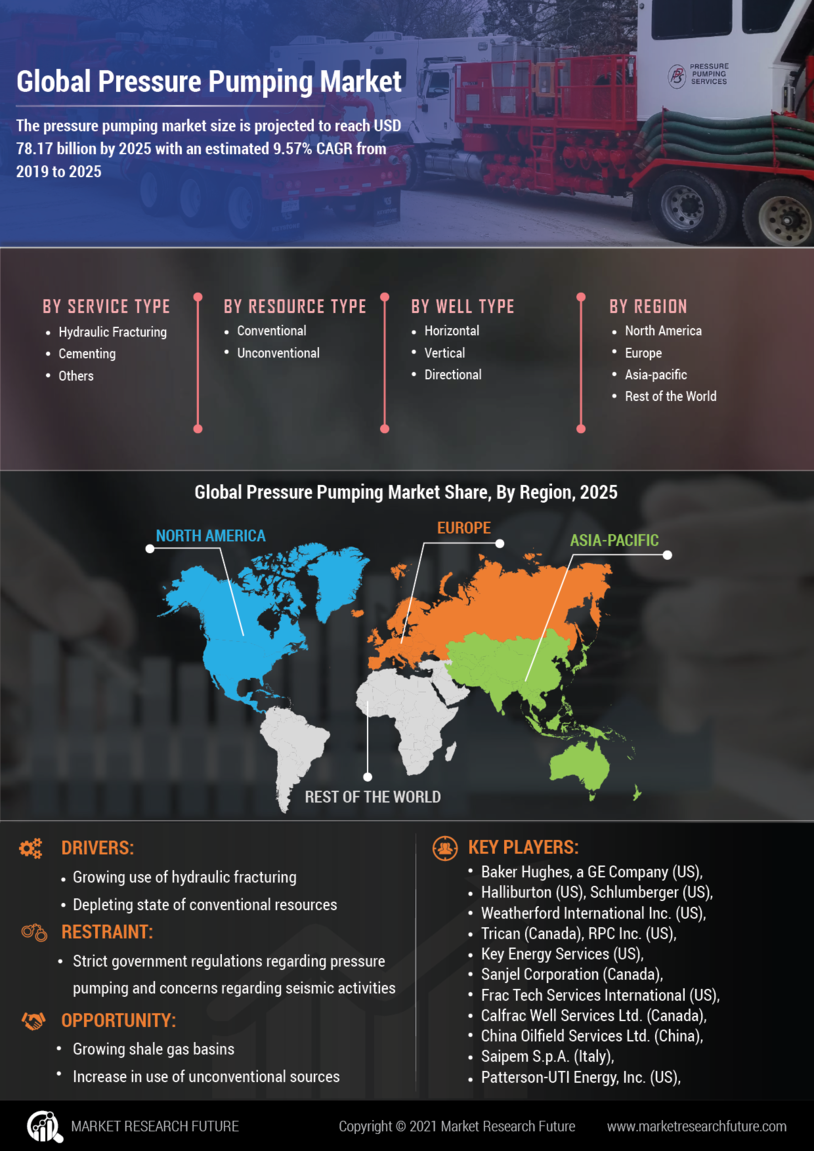
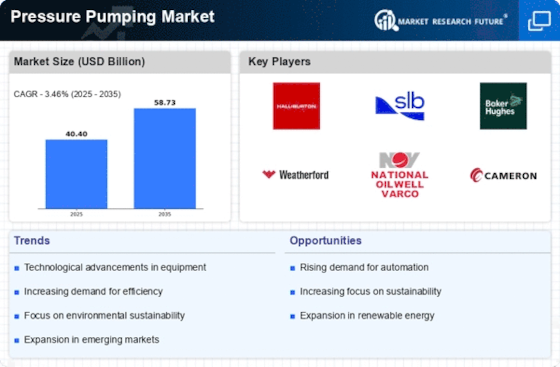
As per MRFR Analysis, the Global Pressure Pumping Market was valued at 39.05 USD Billion in 2023 and is projected to grow to 58.7 USD Billion by 2035, with a CAGR of 3.46% from 2025 to 2035. The market is driven by increasing demand for hydraulic fracturing, technological advancements, and regulatory support for cleaner energy solutions.

Key Market Trends & Highlights

Key trends driving the Pressure Pumping Market include advancements in technology and a shift towards sustainable energy practices.

  • Hydraulic Fracturing Market Value in 2024: 14.5 USD Billion, projected to reach 20.8 USD Billion by 2035.
  • Acidizing Service Value in 2024: 8.5 USD Billion, expected to grow to 12.2 USD Billion by 2035.
  • North America Market Size in 2024: 18.5 USD Billion, anticipated to increase to 26.7 USD Billion by 2035.
  • Investment in shale oil and gas exploration has increased by 25% over the last five years.

Market Size & Forecast

2023 Market Size: USD 39.05 Billion
2024 Market Size: USD 40.4 Billion
2035 Market Size: USD 58.7 Billion
CAGR (2025-2035): 3.46%
Largest Regional Market Share in 2024: North America

Major Players

Key Companies include Superior Energy Services, Baker Hughes, Schlumberger, Halliburton, and ProPetro Holding Corp.

Key Pressure Pumping Market Trends Highlighted

Significant growth in the Pressure Pumping Market is being driven by the growing demand for oil and gas exploration and production, which is primarily due to the recovery of global energy consumption and the increase in unconventional resource development. The transition to healthier energy sources also drives the market, as pressure pumping services are essential for the efficient extraction of hydrocarbons while minimizing the environmental impact. Furthermore, advancements in technology, including hydraulic fracturing and advances in pumping equipment, are increasing operational efficiency and attracting investments into this market. In areas such as renewable energy applications, opportunities also exist, as pressure pumping techniques can support geothermal energy production and improve water management strategies.

The integration of pressure pumping technologies with renewable energy initiatives can generate substantial benefits, thereby promoting new growth opportunities in the market, as governments worldwide strive for sustainability. In recent years, there has been a substantial rise in the number of partnerships and collaborations between companies. This trend is fueled by the desire to expand service offerings and capitalize on expertise, thereby allowing them to more effectively meet the changing requirements of their clients. 

In addition, the industry landscape is being transformed by the increasing emphasis on automation and digitalization in pressure pumping operations, which is resulting in a reduction in operational costs and an improvement in safety and accuracy during drilling processes. Innovations that mitigate emissions and water consumption associated with pressure pumping operations are emerging as a consequence of the movement toward sustainable practices.

The Pressure Pumping Market is becoming more resilient and responsive as a result of this proactive response to market and environmental demands.

Global Pressure Pumping Market Overview

Source: Primary Research, Secondary Research, MRFR Database, and Analyst Review

Increasing Global Energy Demand

The Pressure Pumping Market Industry is benefiting significantly from the increasing demand for energy worldwide. As populations grow and urbanization accelerates, energy requirements are projected to rise, and global consumption of primary energy is expected to increase by nearly 50% by 2040, as per the International Energy Agency initiatives. This surge in energy demand compels oil and gas companies to enhance their production capabilities, particularly in shale oil and gas, which requires advanced pressure pumping techniques.

Established companies such as Halliburton and Schlumberger are investing heavily in innovative technologies to cater to this demand, thereby propelling market growth. The Geological Survey's reports estimate that the global crude oil production is expected to reach approximately 100 million barrels per day in the next decade, necessitating improved pressure pumping processes to optimize extraction.

Advancements in Hydraulic Fracturing Technology

The evolution of hydraulic fracturing technology is a critical driver for the Pressure Pumping Market Industry. Innovations in this area have led to more efficient and effective extraction methods, allowing energy companies to access previously unreachable reservoirs. According to the United States Energy Information Administration, technological advancements have contributed to a noteworthy increase in U.S natural gas production, projected to exceed 100 billion cubic feet per day in the coming years.

This trend is supported by major players like Baker Hughes, which is continuously working on developing new fracturing fluids that enhance productivity and safety, alongside complying with environmental regulations. As these advancements continue, they are expected to support the overall pressure pumping sector more robustly.

Regulatory Support for Energy Exploration

Global governmental policies aimed at boosting energy exploration are significantly influencing the Pressure Pumping Market Industry. Initiatives promoting energy independence and sustainability are encouraging investments in new drilling technologies and pressure pumping services. For instance, the U.S. Government has set ambitious clean energy targets, intending to achieve 50% carbon-free power by 2030, which necessitates efficient energy extraction processes.

As a result, organizations such as the American Petroleum Institute advocate for policies that support hydraulic fracturing and related services, influencing market dynamics positively. The Energy Policy Act encourages enhanced resource development, aligning with the industry's growing focus on innovative pressure pumping solutions to meet evolving energy demands.

Pressure Pumping Market Segment Insights

Pressure Pumping Market Service Type Insights

The Pressure Pumping Market segmentation under Service Type showcases significant revenue opportunities across various essential services. By 2024, the market is poised to reach a valuation of 40.4 USD Billion, driven primarily by growth across multiple service offerings. The hydraulic fracturing segment stands out with a substantial contribution, forecasted to be valued at 15.0 USD Billion in 2024 and growing to 22.5 USD billion by 2035, reflecting its majority holding and pivotal role in enhancing oil and gas extraction efficiencies. Acidizing is another key area, anticipated to reach a valuation of 10.5 USD Billion in 2024 and expand to 15.8 USD billion by 2035, as its significance in improving well productivity continues to gain traction.

On the other hand, cementing, valued at 6.5 USD Billion in 2024 and expected to grow to 9.7 USD billion by 2035, remains crucial for ensuring the structural integrity of oil wells, solidifying its importance in well construction and operation. The coiled tubing segment, with a valuation of 4.5 USD Billion in 2024, is projected to increase to 6.7 USD billion by 2035, indicating its significant role in facilitating real-time interventions without the need to drill new wells. In contrast, the well intervention sector shows modest growth, moving from 4.4 USD Billion in 2024 to just 4.5 USD billion by 2035, reflecting its specialized nature in maintaining well performance.

This sector is critical in addressing challenges such as reservoir depletion and ensuring optimal operability. The growth of these service types is significantly influenced by increased exploration activities and advancements in technology, set against the backdrop of a recovering global oil market. Overall, the varied revenue implications across these services showcase their essential roles within the broader Pressure Pumping Market industry, highlighting essential operational drivers and regional development strategies.

Pressure Pumping Market Service Type Insights

Source: Primary Research, Secondary Research, MRFR Database, and Analyst Review

Pressure Pumping Market Application Insights

The Pressure Pumping Market revenue is expected to reach 40.4 USD Billion by 2024, driven by various applications such as Onshore, Offshore, Decommissioning, and Well Completion. The Onshore segment plays a critical role as it involves extensive oil and gas extraction operations, significantly contributing to production levels. Offshore applications are also paramount for their ability to enable access to deep water resources, which are increasingly vital as onshore reserves deplete. Decommissioning is emerging as a necessary focus area due to rising regulatory pressure and aging infrastructure, making it a significant component of the market.

Well Completion is essential for enhancing production efficiency, ensuring that wells operate at optimal levels, which continues to dominate industry practices. Overall, the Pressure Pumping Market data shows a growing trend towards automation and environmentally-friendly technologies, addressing challenges related to sustainability and operational costs. The combination of these applications signifies an evolving industry landscape, where the emphasis is on innovation and efficiency to meet rising global energy demands.

Pressure Pumping Market Technology Insights

The Pressure Pumping Market is projected to experience significant growth, expected to be valued at 40.4 billion USD by 2024, eventually reaching 58.7 billion USD by 2035. This market segment focuses on various technologies essential for optimizing oil and gas extraction. Conventional Pressure Pumping remains vital due to its wide applicability in various drilling operations, offering cost-effective solutions. Meanwhile, High-Pressure Pumping is becoming increasingly important, especially in deepwater drilling, where enhanced extraction techniques are applied.

Multistage Fracturing, on the other hand, plays a significant role in maximizing production rates from unconventional resources, thereby unlocking previously inaccessible reserves. Each of these technologies contributes uniquely to the overall dynamics of the industry, influenced by the need for efficiency, reduced operational costs, and the growing emphasis on sustainable practices. Advancements in technology and innovation characterize the competition within the Pressure Pumping Market, pushing companies to optimize their offerings while addressing the evolving demands of the energy sector.

Rising energy consumption and the need for enhanced recovery methods drive the market's growth, supported by a favorable regulatory environment in various countries promoting investment in this sector.

Pressure Pumping Market End Use Insights

The Pressure Pumping Market has been significantly influenced by its end-use applications, primarily in sectors such as Oil and Gas, Mining, and Geothermal Energy. In 2024, the overall market is projected to reach a value of 40.4 billion USD, emphasizing the growing demand for efficient pressure pumping solutions across various industries. The Oil and Gas sector remains a major contributor, due to the necessity for advanced extraction techniques and enhanced oil recovery processes. Mining increasingly utilizes pressure pumping to facilitate the extraction of minerals and provide services that improve operational efficiency.

Meanwhile, the Geothermal Energy sector is gaining traction as a sustainable energy source, driving investments in pressure pumping technologies to maximize resource extraction and utilization. With trends towards renewable energy and resource efficiency, these applications are expected to shape the future landscape of the Pressure Pumping Market. Additionally, the integration of innovative technologies and the rising need for energy storage solutions represent significant opportunities that can further enhance market growth, despite challenges such as fluctuating energy prices and environmental regulations.

The Pressure Pumping Market statistics reflect a robust growth trajectory, showcasing the importance of these end-use segments in supporting industrial advancements globally.

Pressure Pumping Market Regional Insights

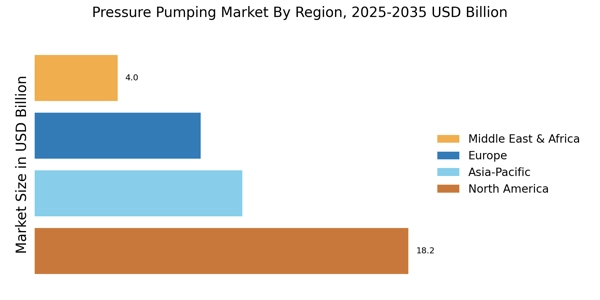
The Pressure Pumping Market segment is expected to showcase significant growth across various regions, highlighted by a total market value of 40.4 USD Billion in 2024. North America leads with a dominant valuation of 16.5 USD Billion in 2024, capturing the majority holding due to advanced technological capabilities and a robust oil and gas industry. Europe follows, valued at 10.0 USD billion, benefiting from stringent regulations that drive demand for efficient pumping solutions. South America shows a notable presence, with a market worth 4.0 USD Billion, supported by its growing exploration activities.

The Asia Pacific region is expected to expand to 7.5 USD billion, driven by rapid industrialization and increased energy requirements. Lastly, the Middle East and Africa, while more modest at 2.4 USD billion, are significant due to their abundant natural resources and focus on sustainable development. The regional insights demonstrate varying degrees of market penetration, highlighting strong opportunities and challenges tailored to each market’s unique dynamics, further reinforced by trends in energy consumption and technological advancements.

Pressure Pumping Market Regional Insights

Source: Primary Research, Secondary Research, MRFR Database, and Analyst Review

Pressure Pumping Market Key Players and Competitive Insights

The Pressure Pumping Market is characterized by a dynamic competitive landscape, driven by the increasing demand for energy and the adoption of advanced technologies in oil and gas extraction processes. Companies in this sector are continually innovating to enhance their service offerings, improve operational efficiencies, and reduce costs. As the market evolves, factors such as regulatory developments, environmental concerns, and fluctuations in crude oil prices influence competitive strategies. Market players are focusing on strategic partnerships, mergers, and acquisitions to expand their service capabilities and geographic reach. Additionally, advancements in hydraulic fracturing techniques and the integration of digital technologies in pressure pumping services are reshaping the competitive framework within the market.

Weatherford International has established a notable presence in the Pressure Pumping Market, leveraging its comprehensive range of pressure pumping services, which include hydraulic fracturing, cementing, and stimulation services. The company capitalizes on its extensive expertise and technological innovations that enhance operational efficiency and effectiveness, positioning itself as a trusted partner in complex oil and gas environments. Weatherford's strengths lie in its global operational footprint, which allows it to cater to diverse customer needs across various regions while maintaining high service quality standards. The company's robust research and development focus enables it to introduce new technologies that improve the performance of pressure pumping applications, thereby solidifying its competitive advantage.

Keane Group, a key player in the Pressure Pumping Market, specializes in pressure pumping services and has developed a strong market presence through its commitment to operational excellence and customer satisfaction. The company offers a range of services, including hydraulic fracturing and well completion solutions that cater to the needs of its clients in the oil and gas sector. Keane Group's strengths are highlighted by its emphasis on technological advancements and efficient operations, allowing for cost-effective service delivery. Moreover, through strategic mergers and acquisitions, the company has enhanced its capabilities and expanded its operational footprint, enabling it to effectively respond to market demands and improve its competitive positioning within the global landscape.

Key Companies in the Pressure Pumping Market Include:

  • Weatherford International
  • Keane Group
  • FESCO
  • Halliburton
  • ProPetro Holding Corp
  • Baker Hughes
  • Schlumberger
  • Innovative Pressure Services
  • Patriot Pressure Pumping
  • Cudd Energy Services
  • High Mountains Energy
  • Trinity Oilfield Services
  • TOPS Energy
  • National Oilwell Varco
  • Pioneer Energy Services

Pressure Pumping Market Industry Developments

The Pressure Pumping Market has recently witnessed several noteworthy developments and shifts. Notable companies such as Weatherford International and Halliburton have been scaling their operations to meet the increasing demand for pressure pumping services in oil and gas exploration, driven by rising crude oil prices and subsequent upstream activity.

In June 2025, Baker Hughes completed an agreement to sell a 65% stake in its surface pressure control business to Cactus, creating a joint venture centered on specialized wellheads and production tree equipment, with Baker Hughes retaining 35%.

In June 2025, Baker Hughes announced the sale of its Precision Sensors & Instrumentation (PSI) unit—including Druck, Reuter-Stokes, and Panametrics brands—to Crane for $1.15 billion, refocusing its portfolio on core services.

Report Attribute/Metric Details
Market Size 2023 39.05 (USD Billion)
Market Size 2024 40.4 (USD Billion)
Market Size 2035 58.73 (USD Billion)
Compound Annual Growth Rate (CAGR) 3.46% (2025 - 2035)
Report Coverage Revenue Forecast, Competitive Landscape, Growth Factors, and Trends
Base Year 2024
Market Forecast Period 2025 - 2035
Historical Data 2019 - 2024
Market Forecast Units USD Billion
Key Companies Profiled Weatherford International, Keane Group, FESCO, Halliburton, ProPetro Holding Corp, Baker Hughes, Schlumberger, Innovative Pressure Services, Patriot Pressure Pumping, Cudd Energy Services, High Mountains Energy, Trinity Oilfield Services, TOPS Energy, National Oilwell Varco, Pioneer Energy Services
Segments Covered Service Type, Application, Technology, End Use, Regional
Key Market Opportunities Increased shale oil production, growing offshore drilling activities, Expansion of renewable energy projects, Advancements in pressure pumping technology, and rising demand in emerging markets
Key Market Dynamics Growing oil and gas demand, Technological advancements in pumping, Regulatory environment and compliance, Shift towards unconventional resources, increasing focus on sustainability
Countries Covered North America, Europe, APAC, South America, MEA


Frequently Asked Questions (FAQ):

The Pressure Pumping Market is expected to be valued at 40.4 USD Billion in 2024.

By 2035, the Pressure Pumping Market is projected to reach 58.73 USD billion.

The expected CAGR for the Pressure Pumping Market from 2025 to 2035 is 3.46%.

North America is expected to hold the largest market share in the Pressure Pumping Market with a value of 16.5 USD Billion in 2024.

South America is projected to have a market value of 5.6 USD Billion in the Pressure Pumping Market by 2035.

Some key players in the Pressure Pumping Market include Halliburton, Schlumberger, and Baker Hughes.

The market value for hydraulic fracturing services in the Pressure Pumping Market is expected to reach 22.5 USD billion by 2035.

The Pressure Pumping Market faces challenges such as fluctuating oil prices and evolving regulatory requirements.

The coiled tubing segment of the Pressure Pumping Market is expected to be valued at 4.5 USD Billion in 2024.

The North American region is anticipated to experience the highest growth rate within the Pressure Pumping Market from 2025 to 2035.

Comments

Pressure Pumping Market Segmentation

  • Pressure Pumping Market By Service Type (USD Billion, 2019-2035)

    • Hydraulic Fracturing

    • Acidizing

    • Cementing

    • Coiled Tubing

    • Well Intervention

  • Pressure Pumping Market By Application (USD Billion, 2019-2035)

    • Onshore

    • Offshore

    • Decommissioning

    • Well Completion

  • Pressure Pumping Market By Technology (USD Billion, 2019-2035)

    • Conventional Pressure Pumping

    • High-Pressure Pumping

    • Multistage Fracturing

  • Pressure Pumping Market By End Use (USD Billion, 2019-2035)

    • Oil and Gas

    • Mining

    • Geothermal Energy

  • Pressure Pumping Market By Regional (USD Billion, 2019-2035)

    • North America

    • Europe

    • South America

    • Asia Pacific

    • Middle East and Africa

Pressure Pumping Market Regional Outlook (USD Billion, 2019-2035)

  • North America Pressure Pumping Market Outlook (USD Billion, 2019-2035)

    • North America by Service Type

      • Hydraulic Fracturing

      • Acidizing

      • Cementing

      • Coiled Tubing

      • Well Intervention

    • North America by Application Type

      • Onshore

      • Offshore

      • Decommissioning

      • Well Completion

    • North America by Technology Type

      • Conventional Pressure Pumping

      • High-Pressure Pumping

      • Multistage Fracturing

    • North America by End Use Type

      • Oil and Gas

      • Mining

      • Geothermal Energy

    • North America by Regional Type

      • US

      • Canada

    • US Pressure Pumping Market Outlook (USD Billion, 2019-2035)

    • US by Service Type

      • Hydraulic Fracturing

      • Acidizing

      • Cementing

      • Coiled Tubing

      • Well Intervention

    • US by Application Type

      • Onshore

      • Offshore

      • Decommissioning

      • Well Completion

    • US by Technology Type

      • Conventional Pressure Pumping

      • High-Pressure Pumping

      • Multistage Fracturing

    • US by End Use Type

      • Oil and Gas

      • Mining

      • Geothermal Energy

    • CANADA Outlook (USD Billion, 2019-2035)

    • CANADA by Service Type

      • Hydraulic Fracturing

      • Acidizing

      • Cementing

      • Coiled Tubing

      • Well Intervention

    • CANADA by Application Type

      • Onshore

      • Offshore

      • Decommissioning

      • Well Completion

    • CANADA by Technology Type

      • Conventional Pressure Pumping

      • High-Pressure Pumping

      • Multistage Fracturing

    • CANADA by End Use Type

      • Oil and Gas

      • Mining

      • Geothermal Energy

    • Europe Pressure Pumping Market Outlook (USD Billion, 2019-2035)

      • Europe by Service Type

        • Hydraulic Fracturing

        • Acidizing

        • Cementing

        • Coiled Tubing

        • Well Intervention

      • Europe by Application Type

        • Onshore

        • Offshore

        • Decommissioning

        • Well Completion

      • Europe by Technology Type

        • Conventional Pressure Pumping

        • High-Pressure Pumping

        • Multistage Fracturing

      • Europe by End Use Type

        • Oil and Gas

        • Mining

        • Geothermal Energy

      • Europe by Regional Type

        • Germany

        • UK

        • France

        • Russia

        • Italy

        • Spain

        • Rest of Europe

      • GERMANY Outlook (USD Billion, 2019-2035)

      • GERMANY by Service Type

        • Hydraulic Fracturing

        • Acidizing

        • Cementing

        • Coiled Tubing

        • Well Intervention

      • GERMANY by Application Type

        • Onshore

        • Offshore

        • Decommissioning

        • Well Completion

      • GERMANY by Technology Type

        • Conventional Pressure Pumping

        • High-Pressure Pumping

        • Multistage Fracturing

      • GERMANY by End Use Type

        • Oil and Gas

        • Mining

        • Geothermal Energy

      • UK Outlook (USD Billion, 2019-2035)

      • UK by Service Type

        • Hydraulic Fracturing

        • Acidizing

        • Cementing

        • Coiled Tubing

        • Well Intervention

      • UK by Application Type

        • Onshore

        • Offshore

        • Decommissioning

        • Well Completion

      • UK by Technology Type

        • Conventional Pressure Pumping

        • High-Pressure Pumping

        • Multistage Fracturing

      • UK by End Use Type

        • Oil and Gas

        • Mining

        • Geothermal Energy

      • FRANCE Outlook (USD Billion, 2019-2035)

      • FRANCE by Service Type

        • Hydraulic Fracturing

        • Acidizing

        • Cementing

        • Coiled Tubing

        • Well Intervention

      • FRANCE by Application Type

        • Onshore

        • Offshore

        • Decommissioning

        • Well Completion

      • FRANCE by Technology Type

        • Conventional Pressure Pumping

        • High-Pressure Pumping

        • Multistage Fracturing

      • FRANCE by End Use Type

        • Oil and Gas

        • Mining

        • Geothermal Energy

      • RUSSIA Outlook (USD Billion, 2019-2035)

      • RUSSIA by Service Type

        • Hydraulic Fracturing

        • Acidizing

        • Cementing

        • Coiled Tubing

        • Well Intervention

      • RUSSIA by Application Type

        • Onshore

        • Offshore

        • Decommissioning

        • Well Completion

      • RUSSIA by Technology Type

        • Conventional Pressure Pumping

        • High-Pressure Pumping

        • Multistage Fracturing

      • RUSSIA by End Use Type

        • Oil and Gas

        • Mining

        • Geothermal Energy

      • ITALY Outlook (USD Billion, 2019-2035)

      • ITALY by Service Type

        • Hydraulic Fracturing

        • Acidizing

        • Cementing

        • Coiled Tubing

        • Well Intervention

      • ITALY by Application Type

        • Onshore

        • Offshore

        • Decommissioning

        • Well Completion

      • ITALY by Technology Type

        • Conventional Pressure Pumping

        • High-Pressure Pumping

        • Multistage Fracturing

      • ITALY by End Use Type

        • Oil and Gas

        • Mining

        • Geothermal Energy

      • SPAIN Outlook (USD Billion, 2019-2035)

      • SPAIN by Service Type

        • Hydraulic Fracturing

        • Acidizing

        • Cementing

        • Coiled Tubing

        • Well Intervention

      • SPAIN by Application Type

        • Onshore

        • Offshore

        • Decommissioning

        • Well Completion

      • SPAIN by Technology Type

        • Conventional Pressure Pumping

        • High-Pressure Pumping

        • Multistage Fracturing

      • SPAIN by End Use Type

        • Oil and Gas

        • Mining

        • Geothermal Energy

      • REST OF EUROPE Outlook (USD Billion, 2019-2035)

      • REST OF EUROPE by Service Type

        • Hydraulic Fracturing

        • Acidizing

        • Cementing

        • Coiled Tubing

        • Well Intervention

      • REST OF EUROPE by Application Type

        • Onshore

        • Offshore

        • Decommissioning

        • Well Completion

      • REST OF EUROPE by Technology Type

        • Conventional Pressure Pumping

        • High-Pressure Pumping

        • Multistage Fracturing

      • REST OF EUROPE by End Use Type

        • Oil and Gas

        • Mining

        • Geothermal Energy

      • APAC Pressure Pumping Market Outlook (USD Billion, 2019-2035)

        • APAC by Service Type

          • Hydraulic Fracturing

          • Acidizing

          • Cementing

          • Coiled Tubing

          • Well Intervention

        • APAC by Application Type

          • Onshore

          • Offshore

          • Decommissioning

          • Well Completion

        • APAC by Technology Type

          • Conventional Pressure Pumping

          • High-Pressure Pumping

          • Multistage Fracturing

        • APAC by End Use Type

          • Oil and Gas

          • Mining

          • Geothermal Energy

        • APAC by Regional Type

          • China

          • India

          • Japan

          • South Korea

          • Malaysia

          • Thailand

          • Indonesia

          • Rest of APAC

        • CHINA Outlook (USD Billion, 2019-2035)

        • CHINA by Service Type

          • Hydraulic Fracturing

          • Acidizing

          • Cementing

          • Coiled Tubing

          • Well Intervention

        • CHINA by Application Type

          • Onshore

          • Offshore

          • Decommissioning

          • Well Completion

        • CHINA by Technology Type

          • Conventional Pressure Pumping

          • High-Pressure Pumping

          • Multistage Fracturing

        • CHINA by End Use Type

          • Oil and Gas

          • Mining

          • Geothermal Energy

        • INDIA Outlook (USD Billion, 2019-2035)

        • INDIA by Service Type

          • Hydraulic Fracturing

          • Acidizing

          • Cementing

          • Coiled Tubing

          • Well Intervention

        • INDIA by Application Type

          • Onshore

          • Offshore

          • Decommissioning

          • Well Completion

        • INDIA by Technology Type

          • Conventional Pressure Pumping

          • High-Pressure Pumping

          • Multistage Fracturing

        • INDIA by End Use Type

          • Oil and Gas

          • Mining

          • Geothermal Energy

        • JAPAN Outlook (USD Billion, 2019-2035)

        • JAPAN by Service Type

          • Hydraulic Fracturing

          • Acidizing

          • Cementing

          • Coiled Tubing

          • Well Intervention

        • JAPAN by Application Type

          • Onshore

          • Offshore

          • Decommissioning

          • Well Completion

        • JAPAN by Technology Type

          • Conventional Pressure Pumping

          • High-Pressure Pumping

          • Multistage Fracturing

        • JAPAN by End Use Type

          • Oil and Gas

          • Mining

          • Geothermal Energy

        • SOUTH KOREA Outlook (USD Billion, 2019-2035)

        • SOUTH KOREA by Service Type

          • Hydraulic Fracturing

          • Acidizing

          • Cementing

          • Coiled Tubing

          • Well Intervention

        • SOUTH KOREA by Application Type

          • Onshore

          • Offshore

          • Decommissioning

          • Well Completion

        • SOUTH KOREA by Technology Type

          • Conventional Pressure Pumping

          • High-Pressure Pumping

          • Multistage Fracturing

        • SOUTH KOREA by End Use Type

          • Oil and Gas

          • Mining

          • Geothermal Energy

        • MALAYSIA Outlook (USD Billion, 2019-2035)

        • MALAYSIA by Service Type

          • Hydraulic Fracturing

          • Acidizing

          • Cementing

          • Coiled Tubing

          • Well Intervention

        • MALAYSIA by Application Type

          • Onshore

          • Offshore

          • Decommissioning

          • Well Completion

        • MALAYSIA by Technology Type

          • Conventional Pressure Pumping

          • High-Pressure Pumping

          • Multistage Fracturing

        • MALAYSIA by End Use Type

          • Oil and Gas

          • Mining

          • Geothermal Energy

        • THAILAND Outlook (USD Billion, 2019-2035)

        • THAILAND by Service Type

          • Hydraulic Fracturing

          • Acidizing

          • Cementing

          • Coiled Tubing

          • Well Intervention

        • THAILAND by Application Type

          • Onshore

          • Offshore

          • Decommissioning

          • Well Completion

        • THAILAND by Technology Type

          • Conventional Pressure Pumping

          • High-Pressure Pumping

          • Multistage Fracturing

        • THAILAND by End Use Type

          • Oil and Gas

          • Mining

          • Geothermal Energy

        • INDONESIA Outlook (USD Billion, 2019-2035)

        • INDONESIA by Service Type

          • Hydraulic Fracturing

          • Acidizing

          • Cementing

          • Coiled Tubing

          • Well Intervention

        • INDONESIA by Application Type

          • Onshore

          • Offshore

          • Decommissioning

          • Well Completion

        • INDONESIA by Technology Type

          • Conventional Pressure Pumping

          • High-Pressure Pumping

          • Multistage Fracturing

        • INDONESIA by End Use Type

          • Oil and Gas

          • Mining

          • Geothermal Energy

        • REST OF APAC Outlook (USD Billion, 2019-2035)

        • REST OF APAC by Service Type

          • Hydraulic Fracturing

          • Acidizing

          • Cementing

          • Coiled Tubing

          • Well Intervention

        • REST OF APAC by Application Type

          • Onshore

          • Offshore

          • Decommissioning

          • Well Completion

        • REST OF APAC by Technology Type

          • Conventional Pressure Pumping

          • High-Pressure Pumping

          • Multistage Fracturing

        • REST OF APAC by End Use Type

          • Oil and Gas

          • Mining

          • Geothermal Energy

        • South America Pressure Pumping Market Outlook (USD Billion, 2019-2035)

          • South America by Service Type

            • Hydraulic Fracturing

            • Acidizing

            • Cementing

            • Coiled Tubing

            • Well Intervention

          • South America by Application Type

            • Onshore

            • Offshore

            • Decommissioning

            • Well Completion

          • South America by Technology Type

            • Conventional Pressure Pumping

            • High-Pressure Pumping

            • Multistage Fracturing

          • South America by End Use Type

            • Oil and Gas

            • Mining

            • Geothermal Energy

          • South America by Regional Type

            • Brazil

            • Mexico

            • Argentina

            • Rest of South America

          • BRAZIL Outlook (USD Billion, 2019-2035)

          • BRAZIL by Service Type

            • Hydraulic Fracturing

            • Acidizing

            • Cementing

            • Coiled Tubing

            • Well Intervention

          • BRAZIL by Application Type

            • Onshore

            • Offshore

            • Decommissioning

            • Well Completion

          • BRAZIL by Technology Type

            • Conventional Pressure Pumping

            • High-Pressure Pumping

            • Multistage Fracturing

          • BRAZIL by End Use Type

            • Oil and Gas

            • Mining

            • Geothermal Energy

          • MEXICO Outlook (USD Billion, 2019-2035)

          • MEXICO by Service Type

            • Hydraulic Fracturing

            • Acidizing

            • Cementing

            • Coiled Tubing

            • Well Intervention

          • MEXICO by Application Type

            • Onshore

            • Offshore

            • Decommissioning

            • Well Completion

          • MEXICO by Technology Type

            • Conventional Pressure Pumping

            • High-Pressure Pumping

            • Multistage Fracturing

          • MEXICO by End Use Type

            • Oil and Gas

            • Mining

            • Geothermal Energy

          • ARGENTINA Outlook (USD Billion, 2019-2035)

          • ARGENTINA by Service Type

            • Hydraulic Fracturing

            • Acidizing

            • Cementing

            • Coiled Tubing

            • Well Intervention

          • ARGENTINA by Application Type

            • Onshore

            • Offshore

            • Decommissioning

            • Well Completion

          • ARGENTINA by Technology Type

            • Conventional Pressure Pumping

            • High-Pressure Pumping

            • Multistage Fracturing

          • ARGENTINA by End Use Type

            • Oil and Gas

            • Mining

            • Geothermal Energy

          • REST OF SOUTH AMERICA Outlook (USD Billion, 2019-2035)

          • REST OF SOUTH AMERICA by Service Type

            • Hydraulic Fracturing

            • Acidizing

            • Cementing

            • Coiled Tubing

            • Well Intervention

          • REST OF SOUTH AMERICA by Application Type

            • Onshore

            • Offshore

            • Decommissioning

            • Well Completion

          • REST OF SOUTH AMERICA by Technology Type

            • Conventional Pressure Pumping

            • High-Pressure Pumping

            • Multistage Fracturing

          • REST OF SOUTH AMERICA by End Use Type

            • Oil and Gas

            • Mining

            • Geothermal Energy

          • MEA Outlook (USD Billion, 2019-2035)

            • MEA by Service Type

              • Hydraulic Fracturing

              • Acidizing

              • Cementing

              • Coiled Tubing

              • Well Intervention

            • MEA by Application Type

              • Onshore

              • Offshore

              • Decommissioning

              • Well Completion

            • MEA by Technology Type

              • Conventional Pressure Pumping

              • High-Pressure Pumping

              • Multistage Fracturing

            • MEA by End Use Type

              • Oil and Gas

              • Mining

              • Geothermal Energy

            • MEA by Regional Type

              • GCC Countries

              • South Africa

              • Rest of MEA

            • GCC COUNTRIES Outlook (USD Billion, 2019-2035)

            • GCC COUNTRIES by Service Type

              • Hydraulic Fracturing

              • Acidizing

              • Cementing

              • Coiled Tubing

              • Well Intervention

            • GCC COUNTRIES by Application Type

              • Onshore

              • Offshore

              • Decommissioning

              • Well Completion

            • GCC COUNTRIES by Technology Type

              • Conventional Pressure Pumping

              • High-Pressure Pumping

              • Multistage Fracturing

            • GCC COUNTRIES by End Use Type

              • Oil and Gas

              • Mining

              • Geothermal Energy

            • SOUTH AFRICA Outlook (USD Billion, 2019-2035)

            • SOUTH AFRICA by Service Type

              • Hydraulic Fracturing

              • Acidizing

              • Cementing

              • Coiled Tubing

              • Well Intervention

            • SOUTH AFRICA by Application Type

              • Onshore

              • Offshore

              • Decommissioning

              • Well Completion

            • SOUTH AFRICA by Technology Type

              • Conventional Pressure Pumping

              • High-Pressure Pumping

              • Multistage Fracturing

            • SOUTH AFRICA by End Use Type

              • Oil and Gas

              • Mining

              • Geothermal Energy

            • REST OF MEA Outlook (USD Billion, 2019-2035)

            • REST OF MEA by Service Type

              • Hydraulic Fracturing

              • Acidizing

              • Cementing

              • Coiled Tubing

              • Well Intervention

            • REST OF MEA by Application Type

              • Onshore

              • Offshore

              • Decommissioning

              • Well Completion

            • REST OF MEA by Technology Type

              • Conventional Pressure Pumping

              • High-Pressure Pumping

              • Multistage Fracturing

            • REST OF MEA by End Use Type

              • Oil and Gas

              • Mining

              • Geothermal Energy

TABLE OF CONTENTS

1. EXECUTIVE SUMMARY

1.1. Market Overview

1.2. Key Findings

1.3. Market Segmentation

1.4. Competitive Landscape

1.5. Challenges and Opportunities

1.6. Future Outlook

2. MARKET INTRODUCTION

2.1. Definition

2.2. Scope of the study

2.2.1. Research Objective

2.2.2. Assumption

2.2.3. Limitations

3. RESEARCH METHODOLOGY

3.1. Overview

3.2. Data Mining

3.3. Secondary Research

3.4. Primary Research

3.4.1. Primary Interviews and Information Gathering Process

3.4.2. Breakdown of Primary Respondents

3.5. Forecasting Model

3.6. Market Size Estimation

3.6.1. Bottom-Up Approach

3.6.2. Top-Down Approach

3.7. Data Triangulation

3.8. Validation

4. MARKET DYNAMICS

4.1. Overview

4.2. Drivers

4.3. Restraints

4.4. Opportunities

5. MARKET FACTOR ANALYSIS

5.1. Value chain Analysis

5.2. Porter's Five Forces Analysis

5.2.1. Bargaining Power of Suppliers

5.2.2. Bargaining Power of Buyers

5.2.3. Threat of New Entrants

5.2.4. Threat of Substitutes

5.2.5. Intensity of Rivalry

5.3. COVID-19 Impact Analysis

5.3.1. Market Impact Analysis

5.3.2. Regional Impact

5.3.3. Opportunity and Threat Analysis

6. PRESSURE PUMPING MARKET, BY SERVICE TYPE (USD BILLION)

6.1. Hydraulic Fracturing

6.2. Acidizing

6.3. Cementing

6.4. Coiled Tubing

6.5. Well Intervention

7. PRESSURE PUMPING MARKET, BY APPLICATION (USD BILLION)

7.1. Onshore

7.2. Offshore

7.3. Decommissioning

7.4. Well Completion

8. PRESSURE PUMPING MARKET, BY TECHNOLOGY (USD BILLION)

8.1. Conventional Pressure Pumping

8.2. High-Pressure Pumping

8.3. Multistage Fracturing

9. PRESSURE PUMPING MARKET, BY END USE (USD BILLION)

9.1. Oil and Gas

9.2. Mining

9.3. Geothermal Energy

10. PRESSURE PUMPING MARKET, BY REGIONAL (USD BILLION)

10.1. North America

10.1.1. US

10.1.2. Canada

10.2. Europe

10.2.1. Germany

10.2.2. UK

10.2.3. France

10.2.4. Russia

10.2.5. Italy

10.2.6. Spain

10.2.7. Rest of Europe

10.3. APAC

10.3.1. China

10.3.2. India

10.3.3. Japan

10.3.4. South Korea

10.3.5. Malaysia

10.3.6. Thailand

10.3.7. Indonesia

10.3.8. Rest of APAC

10.4. South America

10.4.1. Brazil

10.4.2. Mexico

10.4.3. Argentina

10.4.4. Rest of South America

10.5. MEA

10.5.1. GCC Countries

10.5.2. South Africa

10.5.3. Rest of MEA

11. COMPETITIVE LANDSCAPE

11.1. Overview

11.2. Competitive Analysis

11.3. Market share Analysis

11.4. Major Growth Strategy in the Pressure Pumping Market

11.5. Competitive Benchmarking

11.6. Leading Players in Terms of Number of Developments in the Pressure Pumping Market

11.7. Key developments and growth strategies

11.7.1. New Product Launch/Service Deployment

11.7.2. Merger & Acquisitions

11.7.3. Joint Ventures

11.8. Major Players Financial Matrix

11.8.1. Sales and Operating Income

11.8.2. Major Players R&D Expenditure. 2023

12. COMPANY PROFILES

12.1. Weatherford International

12.1.1. Financial Overview

12.1.2. Products Offered

12.1.3. Key Developments

12.1.4. SWOT Analysis

12.1.5. Key Strategies

12.2. Keane Group

12.2.1. Financial Overview

12.2.2. Products Offered

12.2.3. Key Developments

12.2.4. SWOT Analysis

12.2.5. Key Strategies

12.3. FESCO

12.3.1. Financial Overview

12.3.2. Products Offered

12.3.3. Key Developments

12.3.4. SWOT Analysis

12.3.5. Key Strategies

12.4. Halliburton

12.4.1. Financial Overview

12.4.2. Products Offered

12.4.3. Key Developments

12.4.4. SWOT Analysis

12.4.5. Key Strategies

12.5. ProPetro Holding Corp

12.5.1. Financial Overview

12.5.2. Products Offered

12.5.3. Key Developments

12.5.4. SWOT Analysis

12.5.5. Key Strategies

12.6. Baker Hughes

12.6.1. Financial Overview

12.6.2. Products Offered

12.6.3. Key Developments

12.6.4. SWOT Analysis

12.6.5. Key Strategies

12.7. Schlumberger

12.7.1. Financial Overview

12.7.2. Products Offered

12.7.3. Key Developments

12.7.4. SWOT Analysis

12.7.5. Key Strategies

12.8. Innovative Pressure Services

12.8.1. Financial Overview

12.8.2. Products Offered

12.8.3. Key Developments

12.8.4. SWOT Analysis

12.8.5. Key Strategies

12.9. Patriot Pressure Pumping

12.9.1. Financial Overview

12.9.2. Products Offered

12.9.3. Key Developments

12.9.4. SWOT Analysis

12.9.5. Key Strategies

12.10. Cudd Energy Services

12.10.1. Financial Overview

12.10.2. Products Offered

12.10.3. Key Developments

12.10.4. SWOT Analysis

12.10.5. Key Strategies

12.11. High Mountains Energy

12.11.1. Financial Overview

12.11.2. Products Offered

12.11.3. Key Developments

12.11.4. SWOT Analysis

12.11.5. Key Strategies

12.12. Trinity Oilfield Services

12.12.1. Financial Overview

12.12.2. Products Offered

12.12.3. Key Developments

12.12.4. SWOT Analysis

12.12.5. Key Strategies

12.13. TOPS Energy

12.13.1. Financial Overview

12.13.2. Products Offered

12.13.3. Key Developments

12.13.4. SWOT Analysis

12.13.5. Key Strategies

12.14. National Oilwell Varco

12.14.1. Financial Overview

12.14.2. Products Offered

12.14.3. Key Developments

12.14.4. SWOT Analysis

12.14.5. Key Strategies

12.15. Pioneer Energy Services

12.15.1. Financial Overview

12.15.2. Products Offered

12.15.3. Key Developments

12.15.4. SWOT Analysis

12.15.5. Key Strategies

13. APPENDIX

13.1. References

13.2. Related Reports

LIST OF TABLES

TABLE 1. LIST OF ASSUMPTIONS

TABLE 2. NORTH AMERICA MARKET SIZE ESTIMATES & FORECAST, BY SERVICE TYPE, 2019-2035 (USD BILLIONS)

TABLE 3. NORTH AMERICA MARKET SIZE ESTIMATES & FORECAST, BY APPLICATION, 2019-2035 (USD BILLIONS)

TABLE 4. NORTH AMERICA MARKET SIZE ESTIMATES & FORECAST, BY TECHNOLOGY, 2019-2035 (USD BILLIONS)

TABLE 5. NORTH AMERICA MARKET SIZE ESTIMATES & FORECAST, BY END USE, 2019-2035 (USD BILLIONS)

TABLE 6. NORTH AMERICA MARKET SIZE ESTIMATES & FORECAST, BY REGIONAL, 2019-2035 (USD BILLIONS)

TABLE 7. US MARKET SIZE ESTIMATES & FORECAST, BY SERVICE TYPE, 2019-2035 (USD BILLIONS)

TABLE 8. US MARKET SIZE ESTIMATES & FORECAST, BY APPLICATION, 2019-2035 (USD BILLIONS)

TABLE 9. US MARKET SIZE ESTIMATES & FORECAST, BY TECHNOLOGY, 2019-2035 (USD BILLIONS)

TABLE 10. US MARKET SIZE ESTIMATES & FORECAST, BY END USE, 2019-2035 (USD BILLIONS)

TABLE 11. US MARKET SIZE ESTIMATES & FORECAST, BY REGIONAL, 2019-2035 (USD BILLIONS)

TABLE 12. CANADA MARKET SIZE ESTIMATES & FORECAST, BY SERVICE TYPE, 2019-2035 (USD BILLIONS)

TABLE 13. CANADA MARKET SIZE ESTIMATES & FORECAST, BY APPLICATION, 2019-2035 (USD BILLIONS)

TABLE 14. CANADA MARKET SIZE ESTIMATES & FORECAST, BY TECHNOLOGY, 2019-2035 (USD BILLIONS)

TABLE 15. CANADA MARKET SIZE ESTIMATES & FORECAST, BY END USE, 2019-2035 (USD BILLIONS)

TABLE 16. CANADA MARKET SIZE ESTIMATES & FORECAST, BY REGIONAL, 2019-2035 (USD BILLIONS)

TABLE 17. EUROPE MARKET SIZE ESTIMATES & FORECAST, BY SERVICE TYPE, 2019-2035 (USD BILLIONS)

TABLE 18. EUROPE MARKET SIZE ESTIMATES & FORECAST, BY APPLICATION, 2019-2035 (USD BILLIONS)

TABLE 19. EUROPE MARKET SIZE ESTIMATES & FORECAST, BY TECHNOLOGY, 2019-2035 (USD BILLIONS)

TABLE 20. EUROPE MARKET SIZE ESTIMATES & FORECAST, BY END USE, 2019-2035 (USD BILLIONS)

TABLE 21. EUROPE MARKET SIZE ESTIMATES & FORECAST, BY REGIONAL, 2019-2035 (USD BILLIONS)

TABLE 22. GERMANY MARKET SIZE ESTIMATES & FORECAST, BY SERVICE TYPE, 2019-2035 (USD BILLIONS)

TABLE 23. GERMANY MARKET SIZE ESTIMATES & FORECAST, BY APPLICATION, 2019-2035 (USD BILLIONS)

TABLE 24. GERMANY MARKET SIZE ESTIMATES & FORECAST, BY TECHNOLOGY, 2019-2035 (USD BILLIONS)

TABLE 25. GERMANY MARKET SIZE ESTIMATES & FORECAST, BY END USE, 2019-2035 (USD BILLIONS)

TABLE 26. GERMANY MARKET SIZE ESTIMATES & FORECAST, BY REGIONAL, 2019-2035 (USD BILLIONS)

TABLE 27. UK MARKET SIZE ESTIMATES & FORECAST, BY SERVICE TYPE, 2019-2035 (USD BILLIONS)

TABLE 28. UK MARKET SIZE ESTIMATES & FORECAST, BY APPLICATION, 2019-2035 (USD BILLIONS)

TABLE 29. UK MARKET SIZE ESTIMATES & FORECAST, BY TECHNOLOGY, 2019-2035 (USD BILLIONS)

TABLE 30. UK MARKET SIZE ESTIMATES & FORECAST, BY END USE, 2019-2035 (USD BILLIONS)

TABLE 31. UK MARKET SIZE ESTIMATES & FORECAST, BY REGIONAL, 2019-2035 (USD BILLIONS)

TABLE 32. FRANCE MARKET SIZE ESTIMATES & FORECAST, BY SERVICE TYPE, 2019-2035 (USD BILLIONS)

TABLE 33. FRANCE MARKET SIZE ESTIMATES & FORECAST, BY APPLICATION, 2019-2035 (USD BILLIONS)

TABLE 34. FRANCE MARKET SIZE ESTIMATES & FORECAST, BY TECHNOLOGY, 2019-2035 (USD BILLIONS)

TABLE 35. FRANCE MARKET SIZE ESTIMATES & FORECAST, BY END USE, 2019-2035 (USD BILLIONS)

TABLE 36. FRANCE MARKET SIZE ESTIMATES & FORECAST, BY REGIONAL, 2019-2035 (USD BILLIONS)

TABLE 37. RUSSIA MARKET SIZE ESTIMATES & FORECAST, BY SERVICE TYPE, 2019-2035 (USD BILLIONS)

TABLE 38. RUSSIA MARKET SIZE ESTIMATES & FORECAST, BY APPLICATION, 2019-2035 (USD BILLIONS)

TABLE 39. RUSSIA MARKET SIZE ESTIMATES & FORECAST, BY TECHNOLOGY, 2019-2035 (USD BILLIONS)

TABLE 40. RUSSIA MARKET SIZE ESTIMATES & FORECAST, BY END USE, 2019-2035 (USD BILLIONS)

TABLE 41. RUSSIA MARKET SIZE ESTIMATES & FORECAST, BY REGIONAL, 2019-2035 (USD BILLIONS)

TABLE 42. ITALY PRESSURE PUMPING MARKET SIZE ESTIMATES & FORECAST, BY SERVICE TYPE, 2019-2035 (USD BILLIONS)

TABLE 43. ITALY PRESSURE PUMPING MARKET SIZE ESTIMATES & FORECAST, BY APPLICATION, 2019-2035 (USD BILLIONS)

TABLE 44. ITALY PRESSURE PUMPING MARKET SIZE ESTIMATES & FORECAST, BY TECHNOLOGY, 2019-2035 (USD BILLIONS)

TABLE 45. ITALY PRESSURE PUMPING MARKET SIZE ESTIMATES & FORECAST, BY END USE, 2019-2035 (USD BILLIONS)

TABLE 46. ITALY PRESSURE PUMPING MARKET SIZE ESTIMATES & FORECAST, BY REGIONAL, 2019-2035 (USD BILLIONS)

TABLE 47. SPAIN PRESSURE PUMPING MARKET SIZE ESTIMATES & FORECAST, BY SERVICE TYPE, 2019-2035 (USD BILLIONS)

TABLE 48. SPAIN PRESSURE PUMPING MARKET SIZE ESTIMATES & FORECAST, BY APPLICATION, 2019-2035 (USD BILLIONS)

TABLE 49. SPAIN PRESSURE PUMPING MARKET SIZE ESTIMATES & FORECAST, BY TECHNOLOGY, 2019-2035 (USD BILLIONS)

TABLE 50. SPAIN PRESSURE PUMPING MARKET SIZE ESTIMATES & FORECAST, BY END USE, 2019-2035 (USD BILLIONS)

TABLE 51. SPAIN PRESSURE PUMPING MARKET SIZE ESTIMATES & FORECAST, BY REGIONAL, 2019-2035 (USD BILLIONS)

TABLE 52. REST OF EUROPE MARKET SIZE ESTIMATES & FORECAST, BY SERVICE TYPE, 2019-2035 (USD BILLIONS)

TABLE 53. REST OF EUROPE MARKET SIZE ESTIMATES & FORECAST, BY APPLICATION, 2019-2035 (USD BILLIONS)

TABLE 54. REST OF EUROPE MARKET SIZE ESTIMATES & FORECAST, BY TECHNOLOGY, 2019-2035 (USD BILLIONS)

TABLE 55. REST OF EUROPE MARKET SIZE ESTIMATES & FORECAST, BY END USE, 2019-2035 (USD BILLIONS)

TABLE 56. REST OF EUROPE MARKET SIZE ESTIMATES & FORECAST, BY REGIONAL, 2019-2035 (USD BILLIONS)

TABLE 57. APAC MARKET SIZE ESTIMATES & FORECAST, BY SERVICE TYPE, 2019-2035 (USD BILLIONS)

TABLE 58. APAC MARKET SIZE ESTIMATES & FORECAST, BY APPLICATION, 2019-2035 (USD BILLIONS)

TABLE 59. APAC MARKET SIZE ESTIMATES & FORECAST, BY TECHNOLOGY, 2019-2035 (USD BILLIONS)

TABLE 60. APAC MARKET SIZE ESTIMATES & FORECAST, BY END USE, 2019-2035 (USD BILLIONS)

TABLE 61. APAC MARKET SIZE ESTIMATES & FORECAST, BY REGIONAL, 2019-2035 (USD BILLIONS)

TABLE 62. CHINA MARKET SIZE ESTIMATES & FORECAST, BY SERVICE TYPE, 2019-2035 (USD BILLIONS)

TABLE 63. CHINA MARKET SIZE ESTIMATES & FORECAST, BY APPLICATION, 2019-2035 (USD BILLIONS)

TABLE 64. CHINA MARKET SIZE ESTIMATES & FORECAST, BY TECHNOLOGY, 2019-2035 (USD BILLIONS)

TABLE 65. CHINA MARKET SIZE ESTIMATES & FORECAST, BY END USE, 2019-2035 (USD BILLIONS)

TABLE 66. CHINA MARKET SIZE ESTIMATES & FORECAST, BY REGIONAL, 2019-2035 (USD BILLIONS)

TABLE 67. INDIA MARKET SIZE ESTIMATES & FORECAST, BY SERVICE TYPE, 2019-2035 (USD BILLIONS)

TABLE 68. INDIA MARKET SIZE ESTIMATES & FORECAST, BY APPLICATION, 2019-2035 (USD BILLIONS)

TABLE 69. INDIA MARKET SIZE ESTIMATES & FORECAST, BY TECHNOLOGY, 2019-2035 (USD BILLIONS)

TABLE 70. INDIA MARKET SIZE ESTIMATES & FORECAST, BY END USE, 2019-2035 (USD BILLIONS)

TABLE 71. INDIA MARKET SIZE ESTIMATES & FORECAST, BY REGIONAL, 2019-2035 (USD BILLIONS)

TABLE 72. JAPAN MARKET SIZE ESTIMATES & FORECAST, BY SERVICE TYPE, 2019-2035 (USD BILLIONS)

TABLE 73. JAPAN MARKET SIZE ESTIMATES & FORECAST, BY APPLICATION, 2019-2035 (USD BILLIONS)

TABLE 74. JAPAN MARKET SIZE ESTIMATES & FORECAST, BY TECHNOLOGY, 2019-2035 (USD BILLIONS)

TABLE 75. JAPAN MARKET SIZE ESTIMATES & FORECAST, BY END USE, 2019-2035 (USD BILLIONS)

TABLE 76. JAPAN MARKET SIZE ESTIMATES & FORECAST, BY REGIONAL, 2019-2035 (USD BILLIONS)

TABLE 77. SOUTH KOREA MARKET SIZE ESTIMATES & FORECAST, BY SERVICE TYPE, 2019-2035 (USD BILLIONS)

TABLE 78. SOUTH KOREA MARKET SIZE ESTIMATES & FORECAST, BY APPLICATION, 2019-2035 (USD BILLIONS)

TABLE 79. SOUTH KOREA MARKET SIZE ESTIMATES & FORECAST, BY TECHNOLOGY, 2019-2035 (USD BILLIONS)

TABLE 80. SOUTH KOREA MARKET SIZE ESTIMATES & FORECAST, BY END USE, 2019-2035 (USD BILLIONS)

TABLE 81. SOUTH KOREA MARKET SIZE ESTIMATES & FORECAST, BY REGIONAL, 2019-2035 (USD BILLIONS)

TABLE 82. MALAYSIA MARKET SIZE ESTIMATES & FORECAST, BY SERVICE TYPE, 2019-2035 (USD BILLIONS)

TABLE 83. MALAYSIA MARKET SIZE ESTIMATES & FORECAST, BY APPLICATION, 2019-2035 (USD BILLIONS)

TABLE 84. MALAYSIA MARKET SIZE ESTIMATES & FORECAST, BY TECHNOLOGY, 2019-2035 (USD BILLIONS)

TABLE 85. MALAYSIA MARKET SIZE ESTIMATES & FORECAST, BY END USE, 2019-2035 (USD BILLIONS)

TABLE 86. MALAYSIA MARKET SIZE ESTIMATES & FORECAST, BY REGIONAL, 2019-2035 (USD BILLIONS)

TABLE 87. THAILAND MARKET SIZE ESTIMATES & FORECAST, BY SERVICE TYPE, 2019-2035 (USD BILLIONS)

TABLE 88. THAILAND MARKET SIZE ESTIMATES & FORECAST, BY APPLICATION, 2019-2035 (USD BILLIONS)

TABLE 89. THAILAND MARKET SIZE ESTIMATES & FORECAST, BY TECHNOLOGY, 2019-2035 (USD BILLIONS)

TABLE 90. THAILAND MARKET SIZE ESTIMATES & FORECAST, BY END USE, 2019-2035 (USD BILLIONS)

TABLE 91. THAILAND MARKET SIZE ESTIMATES & FORECAST, BY REGIONAL, 2019-2035 (USD BILLIONS)

TABLE 92. INDONESIA MARKET SIZE ESTIMATES & FORECAST, BY SERVICE TYPE, 2019-2035 (USD BILLIONS)

TABLE 93. INDONESIA MARKET SIZE ESTIMATES & FORECAST, BY APPLICATION, 2019-2035 (USD BILLIONS)

TABLE 94. INDONESIA MARKET SIZE ESTIMATES & FORECAST, BY TECHNOLOGY, 2019-2035 (USD BILLIONS)

TABLE 95. INDONESIA MARKET SIZE ESTIMATES & FORECAST, BY END USE, 2019-2035 (USD BILLIONS)

TABLE 96. INDONESIA MARKET SIZE ESTIMATES & FORECAST, BY REGIONAL, 2019-2035 (USD BILLIONS)

TABLE 97. REST OF APAC MARKET SIZE ESTIMATES & FORECAST, BY SERVICE TYPE, 2019-2035 (USD BILLIONS)

TABLE 98. REST OF APAC MARKET SIZE ESTIMATES & FORECAST, BY APPLICATION, 2019-2035 (USD BILLIONS)

TABLE 99. REST OF APAC MARKET SIZE ESTIMATES & FORECAST, BY TECHNOLOGY, 2019-2035 (USD BILLIONS)

TABLE 100. REST OF APAC MARKET SIZE ESTIMATES & FORECAST, BY END USE, 2019-2035 (USD BILLIONS)

TABLE 101. REST OF APAC MARKET SIZE ESTIMATES & FORECAST, BY REGIONAL, 2019-2035 (USD BILLIONS)

TABLE 102. SOUTH AMERICA MARKET SIZE ESTIMATES & FORECAST, BY SERVICE TYPE, 2019-2035 (USD BILLIONS)

TABLE 103. SOUTH AMERICA MARKET SIZE ESTIMATES & FORECAST, BY APPLICATION, 2019-2035 (USD BILLIONS)

TABLE 104. SOUTH AMERICA MARKET SIZE ESTIMATES & FORECAST, BY TECHNOLOGY, 2019-2035 (USD BILLIONS)

TABLE 105. SOUTH AMERICA MARKET SIZE ESTIMATES & FORECAST, BY END USE, 2019-2035 (USD BILLIONS)

TABLE 106. SOUTH AMERICA MARKET SIZE ESTIMATES & FORECAST, BY REGIONAL, 2019-2035 (USD BILLIONS)

TABLE 107. BRAZIL MARKET SIZE ESTIMATES & FORECAST, BY SERVICE TYPE, 2019-2035 (USD BILLIONS)

TABLE 108. BRAZIL MARKET SIZE ESTIMATES & FORECAST, BY APPLICATION, 2019-2035 (USD BILLIONS)

TABLE 109. BRAZIL MARKET SIZE ESTIMATES & FORECAST, BY TECHNOLOGY, 2019-2035 (USD BILLIONS)

TABLE 110. BRAZIL MARKET SIZE ESTIMATES & FORECAST, BY END USE, 2019-2035 (USD BILLIONS)

TABLE 111. BRAZIL MARKET SIZE ESTIMATES & FORECAST, BY REGIONAL, 2019-2035 (USD BILLIONS)

TABLE 112. MEXICO MARKET SIZE ESTIMATES & FORECAST, BY SERVICE TYPE, 2019-2035 (USD BILLIONS)

TABLE 113. MEXICO MARKET SIZE ESTIMATES & FORECAST, BY APPLICATION, 2019-2035 (USD BILLIONS)

TABLE 114. MEXICO MARKET SIZE ESTIMATES & FORECAST, BY TECHNOLOGY, 2019-2035 (USD BILLIONS)

TABLE 115. MEXICO MARKET SIZE ESTIMATES & FORECAST, BY END USE, 2019-2035 (USD BILLIONS)

TABLE 116. MEXICO MARKET SIZE ESTIMATES & FORECAST, BY REGIONAL, 2019-2035 (USD BILLIONS)

TABLE 117. ARGENTINA MARKET SIZE ESTIMATES & FORECAST, BY SERVICE TYPE, 2019-2035 (USD BILLIONS)

TABLE 118. ARGENTINA MARKET SIZE ESTIMATES & FORECAST, BY APPLICATION, 2019-2035 (USD BILLIONS)

TABLE 119. ARGENTINA MARKET SIZE ESTIMATES & FORECAST, BY TECHNOLOGY, 2019-2035 (USD BILLIONS)

TABLE 120. ARGENTINA MARKET SIZE ESTIMATES & FORECAST, BY END USE, 2019-2035 (USD BILLIONS)

TABLE 121. ARGENTINA MARKET SIZE ESTIMATES & FORECAST, BY REGIONAL, 2019-2035 (USD BILLIONS)

TABLE 122. REST OF SOUTH AMERICA MARKET SIZE ESTIMATES & FORECAST, BY SERVICE TYPE, 2019-2035 (USD BILLIONS)

TABLE 123. REST OF SOUTH AMERICA MARKET SIZE ESTIMATES & FORECAST, BY APPLICATION, 2019-2035 (USD BILLIONS)

TABLE 124. REST OF SOUTH AMERICA MARKET SIZE ESTIMATES & FORECAST, BY TECHNOLOGY, 2019-2035 (USD BILLIONS)

TABLE 125. REST OF SOUTH AMERICA MARKET SIZE ESTIMATES & FORECAST, BY END USE, 2019-2035 (USD BILLIONS)

TABLE 126. REST OF SOUTH AMERICA MARKET SIZE ESTIMATES & FORECAST, BY REGIONAL, 2019-2035 (USD BILLIONS)

TABLE 127. MEA MARKET SIZE ESTIMATES & FORECAST, BY SERVICE TYPE, 2019-2035 (USD BILLIONS)

TABLE 128. MEA MARKET SIZE ESTIMATES & FORECAST, BY APPLICATION, 2019-2035 (USD BILLIONS)

TABLE 129. MEA MARKET SIZE ESTIMATES & FORECAST, BY TECHNOLOGY, 2019-2035 (USD BILLIONS)

TABLE 130. MEA MARKET SIZE ESTIMATES & FORECAST, BY END USE, 2019-2035 (USD BILLIONS)

TABLE 131. MEA MARKET SIZE ESTIMATES & FORECAST, BY REGIONAL, 2019-2035 (USD BILLIONS)

TABLE 132. GCC COUNTRIES PRESSURE PUMPING MARKET SIZE ESTIMATES & FORECAST, BY SERVICE TYPE, 2019-2035 (USD BILLIONS)

TABLE 133. GCC COUNTRIES PRESSURE PUMPING MARKET SIZE ESTIMATES & FORECAST, BY APPLICATION, 2019-2035 (USD BILLIONS)

TABLE 134. GCC COUNTRIES PRESSURE PUMPING MARKET SIZE ESTIMATES & FORECAST, BY TECHNOLOGY, 2019-2035 (USD BILLIONS)

TABLE 135. GCC COUNTRIES PRESSURE PUMPING MARKET SIZE ESTIMATES & FORECAST, BY END USE, 2019-2035 (USD BILLIONS)

TABLE 136. GCC COUNTRIES PRESSURE PUMPING MARKET SIZE ESTIMATES & FORECAST, BY REGIONAL, 2019-2035 (USD BILLIONS)

TABLE 137. SOUTH AFRICA PRESSURE PUMPING MARKET SIZE ESTIMATES & FORECAST, BY SERVICE TYPE, 2019-2035 (USD BILLIONS)

TABLE 138. SOUTH AFRICA PRESSURE PUMPING MARKET SIZE ESTIMATES & FORECAST, BY APPLICATION, 2019-2035 (USD BILLIONS)

TABLE 139. SOUTH AFRICA PRESSURE PUMPING MARKET SIZE ESTIMATES & FORECAST, BY TECHNOLOGY, 2019-2035 (USD BILLIONS)

TABLE 140. SOUTH AFRICA PRESSURE PUMPING MARKET SIZE ESTIMATES & FORECAST, BY END USE, 2019-2035 (USD BILLIONS)

TABLE 141. SOUTH AFRICA PRESSURE PUMPING MARKET SIZE ESTIMATES & FORECAST, BY REGIONAL, 2019-2035 (USD BILLIONS)

TABLE 142. REST OF MEA MARKET SIZE ESTIMATES & FORECAST, BY SERVICE TYPE, 2019-2035 (USD BILLIONS)

TABLE 143. REST OF MEA MARKET SIZE ESTIMATES & FORECAST, BY APPLICATION, 2019-2035 (USD BILLIONS)

TABLE 144. REST OF MEA MARKET SIZE ESTIMATES & FORECAST, BY TECHNOLOGY, 2019-2035 (USD BILLIONS)

TABLE 145. REST OF MEA MARKET SIZE ESTIMATES & FORECAST, BY END USE, 2019-2035 (USD BILLIONS)

TABLE 146. REST OF MEA MARKET SIZE ESTIMATES & FORECAST, BY REGIONAL, 2019-2035 (USD BILLIONS)

TABLE 147. PRODUCT LAUNCH/PRODUCT DEVELOPMENT/APPROVAL

TABLE 148. ACQUISITION/PARTNERSHIP

LIST OF FIGURES

FIGURE 1. MARKET SYNOPSIS

FIGURE 2. NORTH AMERICA MARKET ANALYSIS

FIGURE 3. US MARKET ANALYSIS BY SERVICE TYPE

FIGURE 4. US MARKET ANALYSIS BY APPLICATION

FIGURE 5. US MARKET ANALYSIS BY TECHNOLOGY

FIGURE 6. US MARKET ANALYSIS BY END USE

FIGURE 7. US MARKET ANALYSIS BY REGIONAL

FIGURE 8. CANADA MARKET ANALYSIS BY SERVICE TYPE

FIGURE 9. CANADA MARKET ANALYSIS BY APPLICATION

FIGURE 10. CANADA MARKET ANALYSIS BY TECHNOLOGY

FIGURE 11. CANADA MARKET ANALYSIS BY END USE

FIGURE 12. CANADA MARKET ANALYSIS BY REGIONAL

FIGURE 13. EUROPE MARKET ANALYSIS

FIGURE 14. GERMANY MARKET ANALYSIS BY SERVICE TYPE

FIGURE 15. GERMANY MARKET ANALYSIS BY APPLICATION

FIGURE 16. GERMANY MARKET ANALYSIS BY TECHNOLOGY

FIGURE 17. GERMANY MARKET ANALYSIS BY END USE

FIGURE 18. GERMANY MARKET ANALYSIS BY REGIONAL

FIGURE 19. UK MARKET ANALYSIS BY SERVICE TYPE

FIGURE 20. UK MARKET ANALYSIS BY APPLICATION

FIGURE 21. UK MARKET ANALYSIS BY TECHNOLOGY

FIGURE 22. UK MARKET ANALYSIS BY END USE

FIGURE 23. UK MARKET ANALYSIS BY REGIONAL

FIGURE 24. FRANCE MARKET ANALYSIS BY SERVICE TYPE

FIGURE 25. FRANCE MARKET ANALYSIS BY APPLICATION

FIGURE 26. FRANCE MARKET ANALYSIS BY TECHNOLOGY

FIGURE 27. FRANCE MARKET ANALYSIS BY END USE

FIGURE 28. FRANCE MARKET ANALYSIS BY REGIONAL

FIGURE 29. RUSSIA MARKET ANALYSIS BY SERVICE TYPE

FIGURE 30. RUSSIA MARKET ANALYSIS BY APPLICATION

FIGURE 31. RUSSIA MARKET ANALYSIS BY TECHNOLOGY

FIGURE 32. RUSSIA MARKET ANALYSIS BY END USE

FIGURE 33. RUSSIA MARKET ANALYSIS BY REGIONAL

FIGURE 34. ITALY PRESSURE PUMPING MARKET ANALYSIS BY SERVICE TYPE

FIGURE 35. ITALY PRESSURE PUMPING MARKET ANALYSIS BY APPLICATION

FIGURE 36. ITALY PRESSURE PUMPING MARKET ANALYSIS BY TECHNOLOGY

FIGURE 37. ITALY PRESSURE PUMPING MARKET ANALYSIS BY END USE

FIGURE 38. ITALY PRESSURE PUMPING MARKET ANALYSIS BY REGIONAL

FIGURE 39. SPAIN PRESSURE PUMPING MARKET ANALYSIS BY SERVICE TYPE

FIGURE 40. SPAIN PRESSURE PUMPING MARKET ANALYSIS BY APPLICATION

FIGURE 41. SPAIN PRESSURE PUMPING MARKET ANALYSIS BY TECHNOLOGY

FIGURE 42. SPAIN PRESSURE PUMPING MARKET ANALYSIS BY END USE

FIGURE 43. SPAIN PRESSURE PUMPING MARKET ANALYSIS BY REGIONAL

FIGURE 44. REST OF EUROPE MARKET ANALYSIS BY SERVICE TYPE

FIGURE 45. REST OF EUROPE MARKET ANALYSIS BY APPLICATION

FIGURE 46. REST OF EUROPE MARKET ANALYSIS BY TECHNOLOGY

FIGURE 47. REST OF EUROPE MARKET ANALYSIS BY END USE

FIGURE 48. REST OF EUROPE MARKET ANALYSIS BY REGIONAL

FIGURE 49. APAC MARKET ANALYSIS

FIGURE 50. CHINA MARKET ANALYSIS BY SERVICE TYPE

FIGURE 51. CHINA MARKET ANALYSIS BY APPLICATION

FIGURE 52. CHINA MARKET ANALYSIS BY TECHNOLOGY

FIGURE 53. CHINA MARKET ANALYSIS BY END USE

FIGURE 54. CHINA MARKET ANALYSIS BY REGIONAL

FIGURE 55. INDIA MARKET ANALYSIS BY SERVICE TYPE

FIGURE 56. INDIA MARKET ANALYSIS BY APPLICATION

FIGURE 57. INDIA MARKET ANALYSIS BY TECHNOLOGY

FIGURE 58. INDIA MARKET ANALYSIS BY END USE

FIGURE 59. INDIA MARKET ANALYSIS BY REGIONAL

FIGURE 60. JAPAN MARKET ANALYSIS BY SERVICE TYPE

FIGURE 61. JAPAN MARKET ANALYSIS BY APPLICATION

FIGURE 62. JAPAN MARKET ANALYSIS BY TECHNOLOGY

FIGURE 63. JAPAN MARKET ANALYSIS BY END USE

FIGURE 64. JAPAN MARKET ANALYSIS BY REGIONAL

FIGURE 65. SOUTH KOREA MARKET ANALYSIS BY SERVICE TYPE

FIGURE 66. SOUTH KOREA MARKET ANALYSIS BY APPLICATION

FIGURE 67. SOUTH KOREA MARKET ANALYSIS BY TECHNOLOGY

FIGURE 68. SOUTH KOREA MARKET ANALYSIS BY END USE

FIGURE 69. SOUTH KOREA MARKET ANALYSIS BY REGIONAL

FIGURE 70. MALAYSIA MARKET ANALYSIS BY SERVICE TYPE

FIGURE 71. MALAYSIA MARKET ANALYSIS BY APPLICATION

FIGURE 72. MALAYSIA MARKET ANALYSIS BY TECHNOLOGY

FIGURE 73. MALAYSIA MARKET ANALYSIS BY END USE

FIGURE 74. MALAYSIA MARKET ANALYSIS BY REGIONAL

FIGURE 75. THAILAND MARKET ANALYSIS BY SERVICE TYPE

FIGURE 76. THAILAND MARKET ANALYSIS BY APPLICATION

FIGURE 77. THAILAND MARKET ANALYSIS BY TECHNOLOGY

FIGURE 78. THAILAND MARKET ANALYSIS BY END USE

FIGURE 79. THAILAND MARKET ANALYSIS BY REGIONAL

FIGURE 80. INDONESIA MARKET ANALYSIS BY SERVICE TYPE

FIGURE 81. INDONESIA MARKET ANALYSIS BY APPLICATION

FIGURE 82. INDONESIA MARKET ANALYSIS BY TECHNOLOGY

FIGURE 83. INDONESIA MARKET ANALYSIS BY END USE

FIGURE 84. INDONESIA MARKET ANALYSIS BY REGIONAL

FIGURE 85. REST OF APAC MARKET ANALYSIS BY SERVICE TYPE

FIGURE 86. REST OF APAC MARKET ANALYSIS BY APPLICATION

FIGURE 87. REST OF APAC MARKET ANALYSIS BY TECHNOLOGY

FIGURE 88. REST OF APAC MARKET ANALYSIS BY END USE

FIGURE 89. REST OF APAC MARKET ANALYSIS BY REGIONAL

FIGURE 90. SOUTH AMERICA MARKET ANALYSIS

FIGURE 91. BRAZIL MARKET ANALYSIS BY SERVICE TYPE

FIGURE 92. BRAZIL MARKET ANALYSIS BY APPLICATION

FIGURE 93. BRAZIL MARKET ANALYSIS BY TECHNOLOGY

FIGURE 94. BRAZIL MARKET ANALYSIS BY END USE

FIGURE 95. BRAZIL MARKET ANALYSIS BY REGIONAL

FIGURE 96. MEXICO MARKET ANALYSIS BY SERVICE TYPE

FIGURE 97. MEXICO MARKET ANALYSIS BY APPLICATION

FIGURE 98. MEXICO MARKET ANALYSIS BY TECHNOLOGY

FIGURE 99. MEXICO MARKET ANALYSIS BY END USE

FIGURE 100. MEXICO MARKET ANALYSIS BY REGIONAL

FIGURE 101. ARGENTINA MARKET ANALYSIS BY SERVICE TYPE

FIGURE 102. ARGENTINA MARKET ANALYSIS BY APPLICATION

FIGURE 103. ARGENTINA MARKET ANALYSIS BY TECHNOLOGY

FIGURE 104. ARGENTINA MARKET ANALYSIS BY END USE

FIGURE 105. ARGENTINA MARKET ANALYSIS BY REGIONAL

FIGURE 106. REST OF SOUTH AMERICA MARKET ANALYSIS BY SERVICE TYPE

FIGURE 107. REST OF SOUTH AMERICA MARKET ANALYSIS BY APPLICATION

FIGURE 108. REST OF SOUTH AMERICA MARKET ANALYSIS BY TECHNOLOGY

FIGURE 109. REST OF SOUTH AMERICA MARKET ANALYSIS BY END USE

FIGURE 110. REST OF SOUTH AMERICA MARKET ANALYSIS BY REGIONAL

FIGURE 111. MEA MARKET ANALYSIS

FIGURE 112. GCC COUNTRIES PRESSURE PUMPING MARKET ANALYSIS BY SERVICE TYPE

FIGURE 113. GCC COUNTRIES PRESSURE PUMPING MARKET ANALYSIS BY APPLICATION

FIGURE 114. GCC COUNTRIES PRESSURE PUMPING MARKET ANALYSIS BY TECHNOLOGY

FIGURE 115. GCC COUNTRIES PRESSURE PUMPING MARKET ANALYSIS BY END USE

FIGURE 116. GCC COUNTRIES PRESSURE PUMPING MARKET ANALYSIS BY REGIONAL

FIGURE 117. SOUTH AFRICA PRESSURE PUMPING MARKET ANALYSIS BY SERVICE TYPE

FIGURE 118. SOUTH AFRICA PRESSURE PUMPING MARKET ANALYSIS BY APPLICATION

FIGURE 119. SOUTH AFRICA PRESSURE PUMPING MARKET ANALYSIS BY TECHNOLOGY

FIGURE 120. SOUTH AFRICA PRESSURE PUMPING MARKET ANALYSIS BY END USE

FIGURE 121. SOUTH AFRICA PRESSURE PUMPING MARKET ANALYSIS BY REGIONAL

FIGURE 122. REST OF MEA MARKET ANALYSIS BY SERVICE TYPE

FIGURE 123. REST OF MEA MARKET ANALYSIS BY APPLICATION

FIGURE 124. REST OF MEA MARKET ANALYSIS BY TECHNOLOGY

FIGURE 125. REST OF MEA MARKET ANALYSIS BY END USE

FIGURE 126. REST OF MEA MARKET ANALYSIS BY REGIONAL

FIGURE 127. KEY BUYING CRITERIA OF PRESSURE PUMPING MARKET

FIGURE 128. RESEARCH PROCESS OF MRFR

FIGURE 129. DRO ANALYSIS OF PRESSURE PUMPING MARKET

FIGURE 130. DRIVERS IMPACT ANALYSIS: PRESSURE PUMPING MARKET

FIGURE 131. RESTRAINTS IMPACT ANALYSIS: PRESSURE PUMPING MARKET

FIGURE 132. SUPPLY / VALUE CHAIN: PRESSURE PUMPING MARKET

FIGURE 133. PRESSURE PUMPING MARKET, BY SERVICE TYPE, 2025 (% SHARE)

FIGURE 134. PRESSURE PUMPING MARKET, BY SERVICE TYPE, 2019 TO 2035 (USD Billions)

FIGURE 135. PRESSURE PUMPING MARKET, BY APPLICATION, 2025 (% SHARE)

FIGURE 136. PRESSURE PUMPING MARKET, BY APPLICATION, 2019 TO 2035 (USD Billions)

FIGURE 137. PRESSURE PUMPING MARKET, BY TECHNOLOGY, 2025 (% SHARE)

FIGURE 138. PRESSURE PUMPING MARKET, BY TECHNOLOGY, 2019 TO 2035 (USD Billions)

FIGURE 139. PRESSURE PUMPING MARKET, BY END USE, 2025 (% SHARE)

FIGURE 140. PRESSURE PUMPING MARKET, BY END USE, 2019 TO 2035 (USD Billions)

FIGURE 141. PRESSURE PUMPING MARKET, BY REGIONAL, 2025 (% SHARE)

FIGURE 142. PRESSURE PUMPING MARKET, BY REGIONAL, 2019 TO 2035 (USD Billions)

FIGURE 143. BENCHMARKING OF MAJOR COMPETITORS

Leading companies partner with us for data-driven Insights.

clients

Kindly complete the form below to receive a free sample of this Report

We do not share your information with anyone. However, we may send you emails based on your report interest from time to time. You may contact us at any time to opt-out.

Tailored for You
  • Dedicated Research on any specifics segment or region.
  • Focused Research on specific players in the market.
  • Custom Report based only on your requirements.
  • Flexibility to add or subtract any chapter in the study.
  • Historic data from 2014 and forecasts outlook till 2040.
  • Flexibility of providing data/insights in formats (PDF, PPT, Excel).
  • Provide cross segmentation in applicable scenario/markets.
report-img