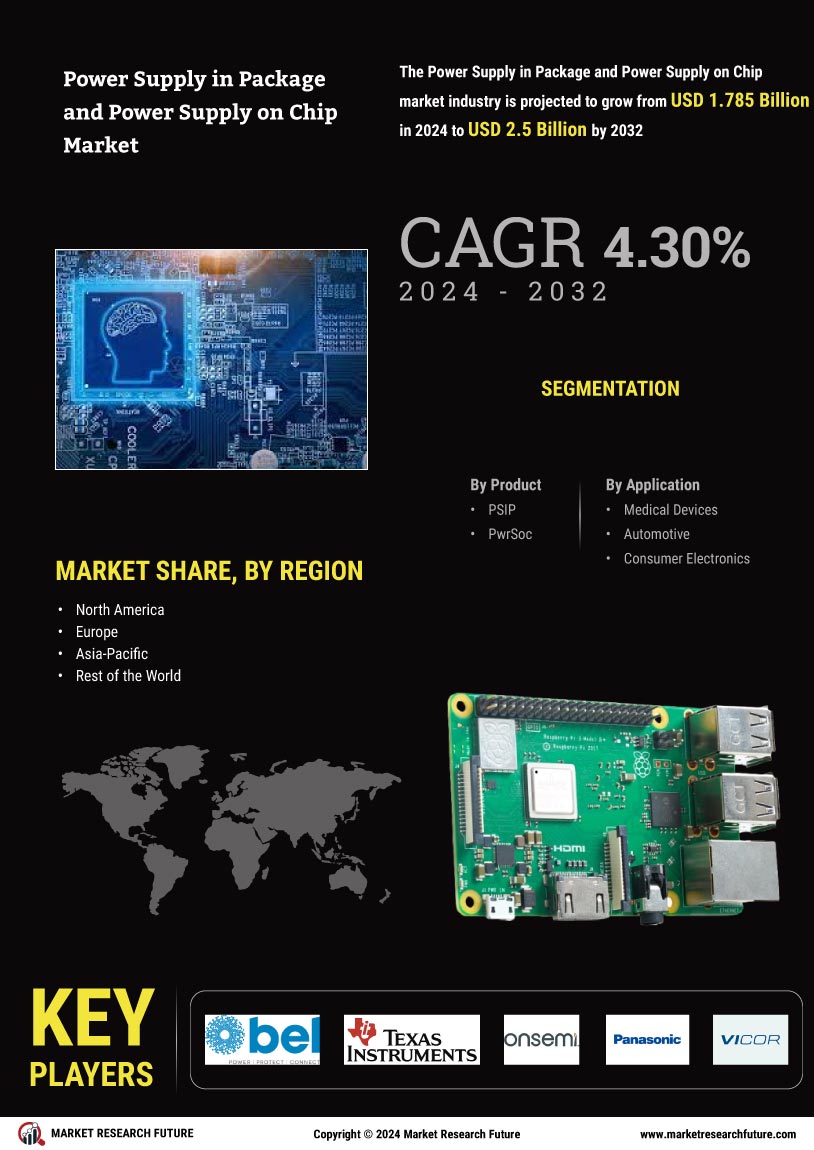
Certified Global Research Member
Isomar fd.webp Wcrc 57.webp
Key Questions Answered
  • Global Market Outlook
  • In-depth analysis of global and regional trends
  • Analyze and identify the major players in the market, their market share, key developments, etc.
  • To understand the capability of the major players based on products offered, financials, and strategies.
  • Identify disrupting products, companies, and trends.
  • To identify opportunities in the market.
  • Analyze the key challenges in the market.
  • Analyze the regional penetration of players, products, and services in the market.
  • Comparison of major playersโ€™ financial performance.
  • Evaluate strategies adopted by major players.
  • Recommendations
Why Choose Market Research Future?
  • Vigorous research methodologies for specific market.
  • Knowledge partners across the globe
  • Large network of partner consultants.
  • Ever-increasing/ Escalating data base with quarterly monitoring of various markets
  • Trusted by fortune 500 companies/startups/ universities/organizations
  • Large database of 5000+ markets reports.
  • Effective and prompt pre- and post-sales support.

Power Supply in Package and Power Supply on Chip Market Research Report Information By Product (PSIP and PwrSoc), By Application (Medical Devices, Automotive, Consumer Electronics, Military and Defense, and Telecom and IT), and By Region (North America, Europe, Asia-Pacific, and Rest Of The World) โ€“ Market Forecast Till 2032


ID: MRFR/SEM/6295-CR | 101 Pages | Author: Aarti Dhapte| May 2019

Power Supply in Package and Power Supply on Chip Market Segmentation


Power Supply in Package and Power Supply on Chip Market Product Outlook (USD Billion, 2018-2032)


  • PSIP


  • PwrSoc


Power Supply in Package and Power Supply on Chip Market Application Outlook (USD Billion, 2018-2032)


  • Medical Devices


  • Automotive


  • Consumer Electronics


  • Military and Defense


  • Telecom and IT


Power Supply in Package and Power Supply on Chip Market Regional Outlook (USD Billion, 2018-2032)


  • North America Outlook (USD Billion, 2018-2032)


    • Power Supply in Package and Power Supply on Chip Market by Product


      • PSIP


      • PwrSoc


    • Power Supply in Package and Power Supply on Chip Market by Application


      • Medical Devices


      • Automotive


      • Consumer Electronics


      • Military and Defense


      • Telecom and IT


    • US Outlook (USD Billion, 2018-2032)


    • Power Supply in Package and Power Supply on Chip Market by Product


      • PSIP


      • PwrSoc


    • Power Supply in Package and Power Supply on Chip Market by Application


      • Medical Devices


      • Automotive


      • Consumer Electronics


      • Military and Defense


      • Telecom and IT


    • Canada Outlook (USD Billion, 2018-2032)


    • Power Supply in Package and Power Supply on Chip Market by Product


      • PSIP


      • PwrSoc


    • Power Supply in Package and Power Supply on Chip Market by Application


      • Medical Devices


      • Automotive


      • Consumer Electronics


      • Military and Defense


      • Telecom and IT


  • Europe Outlook (USD Billion, 2018-2032)


    • Power Supply in Package and Power Supply on Chip Market by Product


      • PSIP


      • PwrSoc


    • Power Supply in Package and Power Supply on Chip Market by Application


      • Medical Devices


      • Automotive


      • Consumer Electronics


      • Military and Defense


      • Telecom and IT


    • Germany Outlook (USD Billion, 2018-2032)


    • Power Supply in Package and Power Supply on Chip Market by Product


      • PSIP


      • PwrSoc


    • Power Supply in Package and Power Supply on Chip Market by Application


      • Medical Devices


      • Automotive


      • Consumer Electronics


      • Military and Defense


      • Telecom and IT


    • France Outlook (USD Billion, 2018-2032)


    • Power Supply in Package and Power Supply on Chip Market by Product


      • PSIP


      • PwrSoc


    • Power Supply in Package and Power Supply on Chip Market by Application


      • Medical Devices


      • Automotive


      • Consumer Electronics


      • Military and Defense


      • Telecom and IT


    • UK Outlook (USD Billion, 2018-2032)


    • Power Supply in Package and Power Supply on Chip Market by Product


      • PSIP


      • PwrSoc


    • Power Supply in Package and Power Supply on Chip Market by Application


      • Medical Devices


      • Automotive


      • Consumer Electronics


      • Military and Defense


      • Telecom and IT


    • Italy Outlook (USD Billion, 2018-2032)


    • Power Supply in Package and Power Supply on Chip Market by Product


      • PSIP


      • PwrSoc


    • Power Supply in Package and Power Supply on Chip Market by Application


      • Medical Devices


      • Automotive


      • Consumer Electronics


      • Military and Defense


      • Telecom and IT


    • Spain Outlook (USD Billion, 2018-2032)


    • Power Supply in Package and Power Supply on Chip Market by Product


      • PSIP


      • PwrSoc


    • Power Supply in Package and Power Supply on Chip Market by Application


      • Medical Devices


      • Automotive


      • Consumer Electronics


      • Military and Defense


      • Telecom and IT


    • Rest Of Europe Outlook (USD Billion, 2018-2032)


    • Power Supply in Package and Power Supply on Chip Market by Product


      • PSIP


      • PwrSoc


    • Power Supply in Package and Power Supply on Chip Market by Application


      • Medical Devices


      • Automotive


      • Consumer Electronics


      • Military and Defense


      • Telecom and IT


  • Asia-Pacific Outlook (USD Billion, 2018-2032)


    • Power Supply in Package and Power Supply on Chip Market by Product


      • PSIP


      • PwrSoc


    • Power Supply in Package and Power Supply on Chip Market by Application


      • Medical Devices


      • Automotive


      • Consumer Electronics


      • Military and Defense


      • Telecom and IT


    • China Outlook (USD Billion, 2018-2032)


    • Power Supply in Package and Power Supply on Chip Market by Product


      • PSIP


      • PwrSoc


    • Power Supply in Package and Power Supply on Chip Market by Application


      • Medical Devices


      • Automotive


      • Consumer Electronics


      • Military and Defense


      • Telecom and IT


    • Japan Outlook (USD Billion, 2018-2032)


    • Power Supply in Package and Power Supply on Chip Market by Product


      • PSIP


      • PwrSoc


    • Power Supply in Package and Power Supply on Chip Market by Application


      • Medical Devices


      • Automotive


      • Consumer Electronics


      • Military and Defense


      • Telecom and IT


    • India Outlook (USD Billion, 2018-2032)


    • Power Supply in Package and Power Supply on Chip Market by Product


      • PSIP


      • PwrSoc


    • Power Supply in Package and Power Supply on Chip Market by Application


      • Medical Devices


      • Automotive


      • Consumer Electronics


      • Military and Defense


      • Telecom and IT


    • Australia Outlook (USD Billion, 2018-2032)


    • Power Supply in Package and Power Supply on Chip Market by Product


      • PSIP


      • PwrSoc


    • Power Supply in Package and Power Supply on Chip Market by Application


      • Medical Devices


      • Automotive


      • Consumer Electronics


      • Military and Defense


      • Telecom and IT


    • Rest of Asia-Pacific Outlook (USD Billion, 2018-2032)


    • Power Supply in Package and Power Supply on Chip Market by Product


      • PSIP


      • PwrSoc


    • Power Supply in Package and Power Supply on Chip Market by Application


      • Medical Devices


      • Automotive


      • Consumer Electronics


      • Military and Defense


      • Telecom and IT


  • Rest of the World Outlook (USD Billion, 2018-2032)


    • Power Supply in Package and Power Supply on Chip Market by Product


      • PSIP


      • PwrSoc


    • Power Supply in Package and Power Supply on Chip Market by Application


      • Medical Devices


      • Automotive


      • Consumer Electronics


      • Military and Defense


      • Telecom and IT


    • Middle East Outlook (USD Billion, 2018-2032)


    • Power Supply in Package and Power Supply on Chip Market by Product


      • PSIP


      • PwrSoc


    • Power Supply in Package and Power Supply on Chip Market by Application


      • Medical Devices


      • Automotive


      • Consumer Electronics


      • Military and Defense


      • Telecom and IT


    • Africa Outlook (USD Billion, 2018-2032)


    • Power Supply in Package and Power Supply on Chip Market by Product


      • PSIP


      • PwrSoc


    • Power Supply in Package and Power Supply on Chip Market by Application


      • Medical Devices


      • Automotive


      • Consumer Electronics


      • Military and Defense


      • Telecom and IT


    • Latin America Outlook (USD Billion, 2018-2032)


    • Power Supply in Package and Power Supply on Chip Market by Product


      • PSIP


      • PwrSoc


    • Power Supply in Package and Power Supply on Chip Market by Application


      • Medical Devices


      • Automotive


      • Consumer Electronics


      • Military and Defense


      • Telecom and IT


Leading companies partner with us for data-driven Insights
client_1 client_2 client_3 client_4 client_5 client_6 client_7 client_8 client_9 client_10
Please fill in Business Email for Quick Response

1 Executive Summary

2 Market Introduction

2.1 Definition 15

2.2 Scope of the Study 15

2.3 List of Assumptions 16

2.4 Market Structure 16

3 Market Insights

4 Research Methodology

4.1 Research Process 22

4.2 Forecast Model 26

5 Market Dynamics

5.1 Overview 28

5.2 Drivers 29

5.2.1 Manufacturing Simplicity Compared to Conventional DC-DC Converters ICs 29

5.2.2 Integrating Mixed-Signal Technology with PSiP and PwrSoC ICs 31

5.3 Opportunity 32

5.3.1 Growth of Silicon Carbide (SiC) and Gallium Nitride (GaN) materials 32

5.4 Restraints 33

5.4.1 Lack of Available Solutions 33

5.4.2 Lack of Technical Expertise 33

5.5 Key Trends 34

6 Market Factor Analysis

6.1 Supply Chain Analysis 36

6.1.1 Manufacturing Phase 37

6.1.2 System Integration Phase 37

6.1.3 End Product Phase 37

6.2 Porterโ€™s Five Force Model 37

6.2.1 Threat of New Entrants 38

6.2.2 Bargaining Power of Suppliers 39

6.2.3 Threat of Substitutes 39

6.2.4 Bargaining Power of Buyers 39

6.2.5 Competitive Rivalry 39

7 Global PSiP and PwrSoC Market, By Product

7.1 Overview 41

7.1.1 Power Supply in Package (PSiP) 41

7.1.2 Power Supply on Chip (PwrSoC) 41

8 Global PSiP and PwrSoC Market, By Application Area

8.1 Overview 44

8.1.1 Consumer Electronics 44

8.1.2 Telecom & IT 44

8.1.3 Automotive 44

8.1.4 Medical Devices 45

8.1.5 Military & Defense 45

9 Power Supply in Package (PSiP) and Power Supply on Chip (PwrSoC) Market, By Region

9.1 Overview 48

9.2 Asia-Pacific 49

9.2.1 China 52

9.2.2 Japan 53

9.2.3 India 54

9.2.4 Rest of Asia-Pacific 55

9.3 North America 57

9.3.1 US 60

9.3.2 Canada 61

9.3.3 Mexico 62

9.4 Europe 63

9.4.1 UK 66

9.4.2 Germany 67

9.4.3 France 68

9.4.4 Rest of Europe 69

9.5 Rest of the World 71

9.5.1 Middle East & Africa 74

9.5.2 South America 75

10 Competitive Landscape

10.1 Competitive Scenario 77

11 Company Profiles

11.1 Intel Corporation 80

11.1.1 Company Overview 80

11.1.2 Financial Overview 80

11.1.3 Products/Services/Solutions/ Application Areas Offered 81

11.1.4 Key Developments 81

11.1.5 SWOT Analysis 81

11.1.6 Key Strategies 81

11.2 ASE Group 82

11.2.1 Company Overview 82

11.2.2 Financial Overview 82

11.2.3 Products/Services/Solutions/Applications Areas Offered 83

11.2.4 Key Developments 83

11.2.5 SWOT Analysis 83

11.2.6 Key Strategies 83

11.3 Amkor Technology 84

11.3.1 Company Overview 84

11.3.2 Financial Overview 84

11.3.3 Products/Services/Solutions/Applications Areas Offered 85

11.3.4 Key Developments 85

11.3.5 SWOT Analysis 85

11.3.6 Key Strategies 85

11.4 TDK Corporation 86

11.4.1 Company Overview 86

11.4.2 Financial Overview 86

11.4.3 Products/Services/Solutions/Application Areas Offered 87

11.4.4 Key Developments 87

11.4.5 SWOT Analysis 87

11.4.6 Key Strategies 87

11.5 Panasonic Corporation 88

11.5.1 Company Overview 88

11.5.2 Financial Revenue 88

11.5.3 Products/Services/Solutions Offered 89

11.5.4 SWOT Analysis 89

11.5.5 Key Strategies 89

11.6 Bel Fuse Inc. 90

11.6.1 Company Overview 90

11.6.2 Financial Revenue 90

11.6.3 Products/Services/Solutions Offered 91

11.6.4 Key Developments 91

11.6.5 SWOT Analysis 91

11.6.6 Key Strategies 91

11.7 Jiangsu Changjiang Electronics Technology Co. Ltd (mySTATSChipPAC) 92

11.7.1 Company Overview 92

11.7.2 Financial Revenue 92

11.7.3 Products/Services/Solutions Offered 93

11.7.4 SWOT Analysis 93

11.7.5 Key Strategies 93

11.8 Texas Instruments Incorporated 94

11.8.1 Company Overview 94

11.8.2 Financial Revenue 94

11.8.3 Products/Services/Solutions Offered 95

11.8.4 SWOT Analysis 95

11.8.5 Key Strategies 95

11.9 ON Semiconductor 96

11.9.1 Company Overview 96

11.9.2 Financial Overview 96

11.9.3 Products/Services/Solutions Offered 97

11.9.4 Key Developments 97

11.9.5 SWOT Analysis 97

11.9.6 Key Strategies 98

11.10 Vicor Corporation 99

11.10.1 Company Overview 99

11.10.2 Financial Overview 99

11.10.3 Products/Services/Solutions Offered 100

11.10.4 Key Developments 100

11.10.5 SWOT Analysis 100

11.10.6 Key Strategies 100

12 List of Tables

TABLE 1 MARKET SYNOPSIS 13

TABLE 2 LIST OF ASSUMPTIONS 16

TABLE 3 DESIGN PROCESS COMPARISON: CONVENTIONAL DC-DC REGULATOR IC AND PSIP/MICROMODULE/PWRSOC IC 29

TABLE 4 MAN-HOURS COMPARISON FOR CONVENTIONAL DC-DC REGULATOR IC AND PSIP/MICROMODULE/PWRSOC IC 30

TABLE 5 GLOBAL: POWER SUPPLY IN PACKAGE (PSIP) AND POWER SUPPLY ON CHIP (PWRSOC) MARKET, BY PRODUCT, 2023-2032 (USD MILLION) 42

TABLE 6 GLOBAL: POWER SUPPLY IN PACKAGE (PSIP) AND POWER SUPPLY ON CHIP (PWRSOC) MARKET, BY APPLICATION AREA, 2023-2032 (USD MILLION) 46

TABLE 7 GLOBAL POWER SUPPLY IN PACKAGE (PSIP) AND POWER SUPPLY ON CHIP (PWRSOC) MARKET, BY REGION, 2023-2032 (USD MILLION) 48

TABLE 8 ASIA-PACIFIC: POWER SUPPLY IN PACKAGE (PSIP) AND POWER SUPPLY ON CHIP (PWRSOC) MARKET, BY COUNTRY, 2023-2032 (USD MILLION) 50

TABLE 9 ASIA-PACIFIC: POWER SUPPLY IN PACKAGE (PSIP) AND POWER SUPPLY ON CHIP (PWRSOC) MARKET, BY PRODUCT, 2023-2032 (USD MILLION) 51

TABLE 10 ASIA-PACIFIC: POWER SUPPLY IN PACKAGE (PSIP) AND POWER SUPPLY ON CHIP (PWRSOC) MARKET, BY APPLICATION AREA, 2023-2032 (USD MILLION) 52

TABLE 11 CHINA: POWER SUPPLY IN PACKAGE (PSIP) AND POWER SUPPLY ON CHIP (PWRSOC) MARKET, BY PRODUCT, 2023-2032 (USD MILLION) 52

TABLE 12 CHINA: POWER SUPPLY IN PACKAGE (PSIP) AND POWER SUPPLY ON CHIP (PWRSOC) MARKET, BY APPLICATION AREA, 2023-2032 (USD MILLION) 53

TABLE 13 JAPAN: POWER SUPPLY IN PACKAGE (PSIP) AND POWER SUPPLY ON CHIP (PWRSOC) MARKET, BY PRODUCT, 2023-2032 (USD MILLION) 53

TABLE 14 JAPAN: POWER SUPPLY IN PACKAGE (PSIP) AND POWER SUPPLY ON CHIP (PWRSOC) MARKET, BY APPLICATION AREA, 2023-2032 (USD MILLION) 54

TABLE 15 INDIA: POWER SUPPLY IN PACKAGE (PSIP) AND POWER SUPPLY ON CHIP (PWRSOC) MARKET, BY PRODUCT, 2023-2032 (USD MILLION) 54

TABLE 16 INDIA: POWER SUPPLY IN PACKAGE (PSIP) AND POWER SUPPLY ON CHIP (PWRSOC) MARKET, BY APPLICATION AREA, 2023-2032 (USD MILLION) 55

TABLE 17 REST OF ASIA-PACIFIC: POWER SUPPLY IN PACKAGE (PSIP) AND POWER SUPPLY ON CHIP (PWRSOC) MARKET, BY PRODUCT, 2023-2032 (USD MILLION) 55

TABLE 18 REST OF ASIA-PACIFIC: POWER SUPPLY IN PACKAGE (PSIP) AND POWER SUPPLY ON CHIP (PWRSOC) MARKET, BY APPLICATION AREA, 2023-2032 (USD MILLION) 56

TABLE 19 NORTH AMERICA: POWER SUPPLY IN PACKAGE (PSIP) AND POWER SUPPLY ON CHIP (PWRSOC) MARKET, BY REGION, 2023-2032 (USD MILLION) 58

TABLE 20 NORTH AMERICA POWER SUPPLY IN PACKAGE (PSIP) AND POWER SUPPLY ON CHIP (PWRSOC) MARKET, BY PRODUCT, 2023-2032 (USD MILLION) 58

TABLE 21 NORTH AMERICA: POWER SUPPLY IN PACKAGE (PSIP) AND POWER SUPPLY ON CHIP (PWRSOC) MARKET, BY APPLICATION AREA, 2023-2032 (USD MILLION) 59

TABLE 22 US: POWER SUPPLY IN PACKAGE (PSIP) AND POWER SUPPLY ON CHIP (PWRSOC) MARKET, BY PRODUCT, 2023-2032 (USD MILLION) 60

TABLE 23 US: POWER SUPPLY IN PACKAGE (PSIP) AND POWER SUPPLY ON CHIP (PWRSOC) MARKET, BY APPLICATION AREA, 2023-2032 (USD MILLION) 60

TABLE 24 CANADA POWER SUPPLY IN PACKAGE (PSIP) AND POWER SUPPLY ON CHIP (PWRSOC) MARKET, BY PRODUCT, 2023-2032 (USD MILLION) 61

TABLE 25 CANADA POWER SUPPLY IN PACKAGE (PSIP) AND POWER SUPPLY ON CHIP (PWRSOC) MARKET, BY APPLICATION AREA, 2023-2032 (USD MILLION) 61

TABLE 26 MEXICO: POWER SUPPLY IN PACKAGE (PSIP) AND POWER SUPPLY ON CHIP (PWRSOC) MARKET, BY PRODUCT, 2023-2032 (USD MILLION) 62

TABLE 27 MEXICO POWER SUPPLY IN PACKAGE (PSIP) AND POWER SUPPLY ON CHIP (PWRSOC) MARKET, BY APPLICATION AREA, 2023-2032 (USD MILLION) 62

TABLE 28 EUROPE POWER SUPPLY IN PACKAGE (PSIP) AND POWER SUPPLY ON CHIP (PWRSOC) MARKET, BY REGION, 2023-2032 (USD MILLION) 64

TABLE 29 EUROPE: POWER SUPPLY IN PACKAGE (PSIP) AND POWER SUPPLY ON CHIP (PWRSOC) MARKET, BY PRODUCT, 2023-2032 (USD MILLION) 65

TABLE 30 EUROPE POWER SUPPLY IN PACKAGE (PSIP) AND POWER SUPPLY ON CHIP (PWRSOC) MARKET, BY APPLICATION AREA, 2023-2032 (USD MILLION) 66

TABLE 31 UK: POWER SUPPLY IN PACKAGE (PSIP) AND POWER SUPPLY ON CHIP (PWRSOC) MARKET, BY PRODUCT, 2023-2032 (USD MILLION) 66

TABLE 32 UK: POWER SUPPLY IN PACKAGE (PSIP) AND POWER SUPPLY ON CHIP (PWRSOC) MARKET, BY APPLICATION AREA, 2023-2032 (USD MILLION) 67

TABLE 33 GERMANY POWER SUPPLY IN PACKAGE (PSIP) AND POWER SUPPLY ON CHIP (PWRSOC) MARKET, BY PRODUCT, 2023-2032 (USD MILLION) 67

TABLE 34 GERMANY POWER SUPPLY IN PACKAGE (PSIP) AND POWER SUPPLY ON CHIP (PWRSOC) MARKET, BY APPLICATION AREA, 2023-2032 (USD MILLION) 68

TABLE 35 FRANCE: POWER SUPPLY IN PACKAGE (PSIP) AND POWER SUPPLY ON CHIP (PWRSOC) MARKET, BY PRODUCT, 2023-2032 (USD MILLION) 68

TABLE 36 FRANCE POWER SUPPLY IN PACKAGE (PSIP) AND POWER SUPPLY ON CHIP (PWRSOC) MARKET, BY APPLICATION AREA, 2023-2032 (USD MILLION) 69

TABLE 37 REST OF EUROPE: POWER SUPPLY IN PACKAGE (PSIP) AND POWER SUPPLY ON CHIP (PWRSOC) MARKET, BY PRODUCT, 2023-2032 (USD MILLION) 69

TABLE 38 REST OF EUROPE: POWER SUPPLY IN PACKAGE (PSIP) AND POWER SUPPLY ON CHIP (PWRSOC) MARKET, BY APPLICATION AREA, 2023-2032 (USD MILLION) 70

TABLE 39 REST OF THE WORLD: POWER SUPPLY IN PACKAGE (PSIP) AND POWER SUPPLY ON CHIP (PWRSOC) MARKET, BY REGION, 2023-2032 (USD MILLION) 71

TABLE 40 REST OF THE WORLD POWER SUPPLY IN PACKAGE (PSIP) AND POWER SUPPLY ON CHIP (PWRSOC) MARKET, BY PRODUCT, 2023-2032 (USD MILLION) 72

TABLE 41 REST OF THE WORLD POWER SUPPLY IN PACKAGE (PSIP) AND POWER SUPPLY ON CHIP (PWRSOC) MARKET, BY APPLICATION AREA, 2023-2032 (USD MILLION) 73

TABLE 42 MIDDLE EAST & AFRICA: POWER SUPPLY IN PACKAGE (PSIP) AND POWER SUPPLY ON CHIP (PWRSOC) MARKET, BY PRODUCT, 2023-2032 (USD MILLION) 74

TABLE 43 MIDDLE EAST & AFRICA: POWER SUPPLY IN PACKAGE (PSIP) AND POWER SUPPLY ON CHIP (PWRSOC) MARKET, BY APPLICATION AREA, 2023-2032 (USD MILLION) 74

TABLE 44 SOUTH AMERICA: POWER SUPPLY IN PACKAGE (PSIP) AND POWER SUPPLY ON CHIP (PWRSOC) MARKET, BY PRODUCT, 2023-2032 (USD MILLION) 75

TABLE 45 SOUTH AMERICA: POWER SUPPLY IN PACKAGE (PSIP) AND POWER SUPPLY ON CHIP (PWRSOC) MARKET, BY APPLICATION AREA, 2023-2032 (USD MILLION) 75

13 List of Figures

FIGURE 1 GLOBAL PSIP AND PWRSOC MARKET: MARKET STRUCTURE 16

FIGURE 2 GLOBAL MARKET SIZE & MARKET SHARE BY REGION/COUNTRY (2023 VS 2032) 18

FIGURE 3 ASIA-PACIFIC MARKET SIZE & MARKET SHARE BY COUNTRY (2023 VS 2032) 18

FIGURE 4 NORTH AMERICA MARKET SIZE & MARKET SHARE BY COUNTRY (2023 VS 2032) 19

FIGURE 5 EUROPE MARKET SIZE & MARKET SHARE BY COUNTRY (2023 VS 2032) 19

FIGURE 6 REST OF THE WORLD MARKET SIZE & MARKET SHARE BY COUNTRY (2023 VS 2032) 20

FIGURE 7 TOP DOWN & BOTTOM UP APPROACH 25

FIGURE 8 DRO FOR GLOBAL POWER SUPPLY IN PACKAGE (PSIP) AND POWER SUPPLY ON CHIP (PWRSOC) MARKET 28

FIGURE 9 MAN HOURS PER STEP COMPARISON 30

FIGURE 10 DRIVER IMPACT ANALYSIS 31

FIGURE 11 POWER TECHNOLOGY AND OPERATING FREQUENCY OF MATERIALS 32

FIGURE 12 RESTRAINTS IMPACT ANALYSIS 33

FIGURE 13 KEY HIGHLIGHTS ASSOCAITED WITH GLOBAL POWER SUPPLY IN PACKAGE (PSIP) AND POWER SUPPLY ON CHIP (PWRSOC) MARKET 34

FIGURE 14 VALUE CHAIN: GLOBAL POWER SUPPLY IN PACKAGE (PSIP) AND POWER SUPPLY ON CHIP (PWRSOC) MARKET 36

FIGURE 15 PORTER'S FIVE FORCES ANALYSIS OF THE GLOBAL PSIP AND PWRSOC MARKET 38

FIGURE 16 GLOBAL: POWER SUPPLY IN PACKAGE (PSIP) AND POWER SUPPLY ON CHIP (PWRSOC) MARKET, BY PRODUCT, 2023-2032 (USD MILLION) 41

FIGURE 17 GLOBAL: POWER SUPPLY IN PACKAGE (PSIP) AND POWER SUPPLY ON CHIP (PWRSOC) MARKET, BY APPLICATION AREA, 2023-2032 (USD MILLION) 45

FIGURE 18 GLOBAL POWER SUPPLY IN PACKAGE (PSIP) AND POWER SUPPLY ON CHIP (PWRSOC) MARKET, BY REGION, 2023-2032 (USD MILLION) 48

FIGURE 19 ASIA-PACIFIC: POWER SUPPLY IN PACKAGE (PSIP) AND POWER SUPPLY ON CHIP (PWRSOC) MARKET, BY COUNTRY, 2023-2032 (USD MILLION) 49

FIGURE 20 ASIA-PACIFIC: POWER SUPPLY IN PACKAGE (PSIP) AND POWER SUPPLY ON CHIP (PWRSOC) MARKET, BY PRODUCT, 2023-2032 (USD MILLION) 50

FIGURE 21 ASIA-PACIFIC: POWER SUPPLY IN PACKAGE (PSIP) AND POWER SUPPLY ON CHIP (PWRSOC) MARKET, BY APPLICATION AREA, 2023-2032 (USD MILLION) 51

FIGURE 22 NORTH AMERICA: POWER SUPPLY IN PACKAGE (PSIP) AND POWER SUPPLY ON CHIP (PWRSOC) MARKET, BY REGION, 2023-2032 (USD MILLION) 57

FIGURE 23 NORTH AMERICA POWER SUPPLY IN PACKAGE (PSIP) AND POWER SUPPLY ON CHIP (PWRSOC) MARKET, BY PRODUCT, 2023-2032 (USD MILLION) 58

FIGURE 24 NORTH AMERICA: POWER SUPPLY IN PACKAGE (PSIP) AND POWER SUPPLY ON CHIP (PWRSOC) MARKET, BY APPLICATION AREA, 2023-2032 (USD MILLION) 59

FIGURE 25 EUROPE: POWER SUPPLY IN PACKAGE (PSIP) AND POWER SUPPLY ON CHIP (PWRSOC) MARKET, BY REGION, 2023-2032 (USD MILLION) 63

FIGURE 26 EUROPE: POWER SUPPLY IN PACKAGE (PSIP) AND POWER SUPPLY ON CHIP (PWRSOC) MARKET, BY PRODUCT, 2023-2032 (USD MILLION) 64

FIGURE 27 EUROPE: POWER SUPPLY IN PACKAGE (PSIP) AND POWER SUPPLY ON CHIP (PWRSOC) MARKET, BY APPLICATION AREA, 2023-2032 (USD MILLION) 65

FIGURE 28 REST OF THE WORLD: POWER SUPPLY IN PACKAGE (PSIP) AND POWER SUPPLY ON CHIP (PWRSOC) MARKET, BY REGION, 2023-2032 (USD MILLION) 71

FIGURE 29 REST OF THE WORLD: POWER SUPPLY IN PACKAGE (PSIP) AND POWER SUPPLY ON CHIP (PWRSOC) MARKET, BY PRODUCT, 2023-2032 (USD MILLION) 72

FIGURE 30 REST OF THE WORLD: POWER SUPPLY IN PACKAGE (PSIP) AND POWER SUPPLY ON CHIP (PWRSOC) MARKET, BY APPLICATION AREA, 2023-2032 (USD MILLION) 73

FIGURE 31 COMPETITIVE BENCHMARKING OF KEY PLAYERS 78

Purchase Option
Single User $ 4,950
Multiuser License $ 5,950
Enterprise User $ 7,250
Compare Licenses
Tailored for You
  • Dedicated Research on any specifics segment or region.
  • Focused Research on specific players in the market.
  • Custom Report based only on your requirements.
  • Flexibility to add or subtract any chapter in the study.
  • Historic data from 2014 and forecasts outlook till 2040.
  • Flexibility of providing data/insights in formats (PDF, PPT, Excel).
  • Provide cross segmentation in applicable scenario/markets.