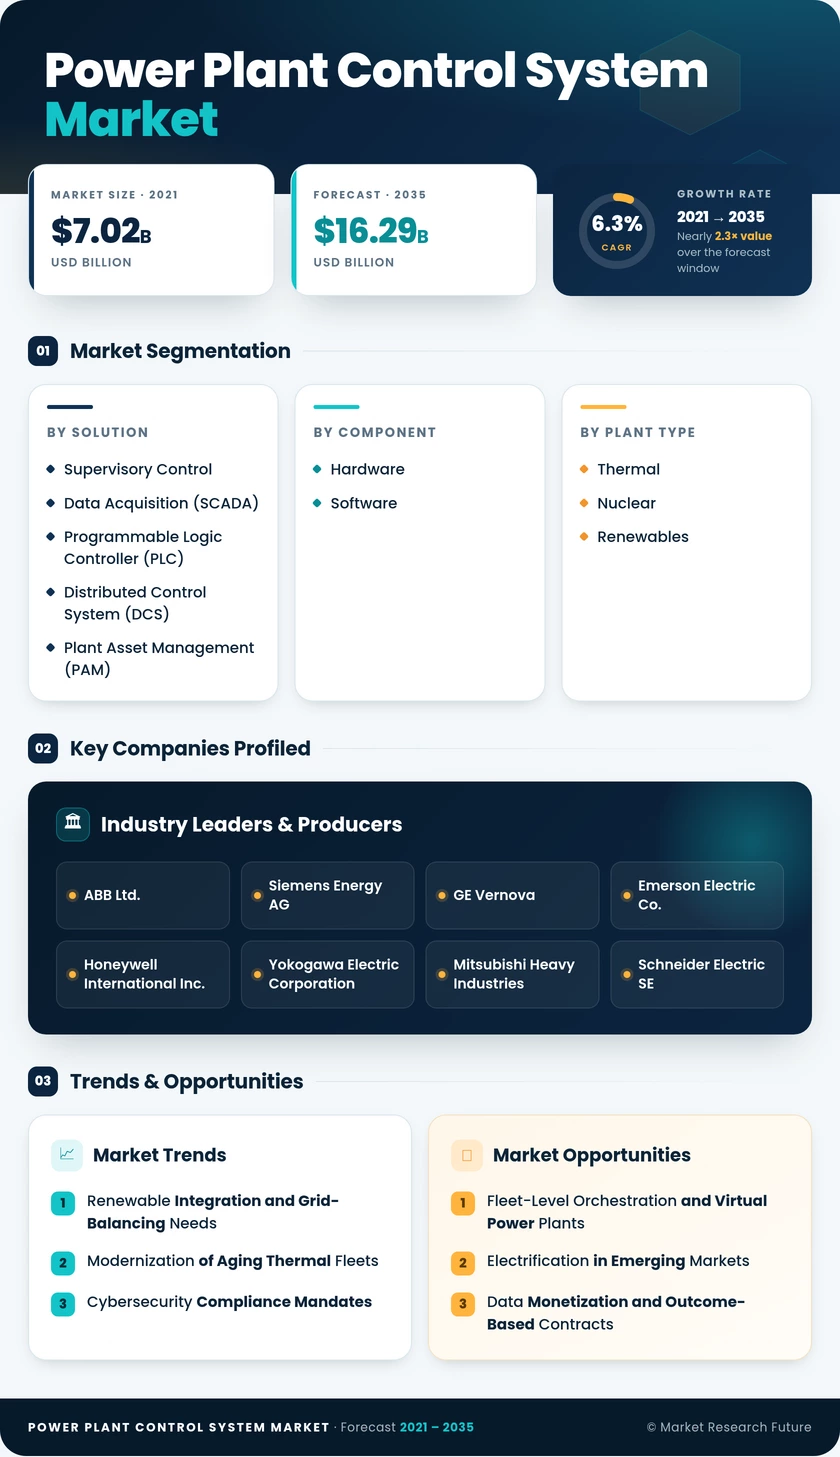
Power Plant Control System Market (2026 - 2035)

ID: MRFR/EnP/6878-HCR 111 Pages Priya Nagrale Last Updated: October 31, 2026
Power Plant Control System Market Research Report By Solution (Supervisory Control and Data Acquisition (SCADA), Programmable Logic Controller (PLC), Distributed Control System (DCS), Plant Asset Management (PAM), Plant Lifecycle Management (PLM)), By Component (Hardware, Software), By Plant Type (Thermal, Nuclear, Renewables) - Forecast to 2035
Power Plant Control System Market
Market Size
Forecast Period2026-2035
CAGR (2026-2035)6.3%
2025 Market SizeUSD 8.86 Billion
2035 Market SizeUSD 16.29 Billion
Key Players
ABB Ltd.
Siemens Energy AG
GE Vernova
Emerson Electric Co.
Honeywell International Inc.
Yokogawa Electric Corporation
Opportunities
  • Fleet-Level Orchestration and Virtual Power Plants
  • Electrification in Emerging Markets
  • Data Monetization and Outcome-Based Contracts
  1. 1 Market Summary | |
  2. 2 Key Report Takeaways | |
    1. 2.1 By Solution | |
    2. 2.2 By Component | |
    3. 2.3 By Plant Type | |
    4. 2.4 By Region | |
  3. 3 Market Size and Forecast (2021–2035) | |
  4. 4 Driver Impact Analysis | |
    1. 4.1 Renewable Integration and Grid-Balancing Needs | |
    2. 4.2 Modernization of Aging Thermal Fleets | |
    3. 4.3 Cybersecurity Compliance Mandates | |
    4. 4.4 Nuclear Life Extension and New Build | |
    5. 4.5 Data-Center Driven Electricity Demand | |
    6. 4.6 Shift to Software and Analytics Subscriptions | |
    7. 4.7 Public Grid and Generation Investment Programs | |
  5. 5 Restraints Impact Analysis | |
    1. 5.1 High Capital Cost of Control Migration | |
    2. 5.2 Cyberattack Exposure of Connected Plants | |
    3. 5.3 Shortage of Automation Engineers | |
    4. 5.4 Legacy Interoperability and Vendor Lock-In | |
    5. 5.5 Coal Phase-Out Curbing Thermal New Build | |
  6. 6 Opportunities | |
    1. 6.1 Fleet-Level Orchestration and Virtual Power Plants | |
    2. 6.2 Electrification in Emerging Markets | |
    3. 6.3 Data Monetization and Outcome-Based Contracts | |
    4. 6.4 Digital Instrumentation for Small Modular Reactors | |
    5. 6.5 Control Platforms for Hybrid and Storage Plants | |
  7. 7 Regional Market Share and Country-Level Analysis | |
    1. 7.1 North America | | |
      1. 7.1.1 United States | | |
      2. 7.1.2 Canada | | |
      3. 7.1.3 Mexico | |
    2. 7.2 Europe | | |
      1. 7.2.1 Germany | | |
      2. 7.2.2 United Kingdom | | |
      3. 7.2.3 France | | |
      4. 7.2.4 Italy | | |
      5. 7.2.5 Spain | | |
      6. 7.2.6 NORDIC Countries | | |
      7. 7.2.7 Russia | | |
      8. 7.2.8 Rest of Europe | |
    3. 7.3 Asia-Pacific | | |
      1. 7.3.1 China | | |
      2. 7.3.2 India | | |
      3. 7.3.3 Japan | | |
      4. 7.3.4 South Korea | | |
      5. 7.3.5 ASEAN Countries | | |
      6. 7.3.6 Australia and New Zealand | | |
      7. 7.3.7 Rest of Asia-Pacific | |
    4. 7.4 South America | | |
      1. 7.4.1 Brazil | | |
      2. 7.4.2 Argentina | | |
      3. 7.4.3 Colombia | | |
      4. 7.4.4 Rest of South America | |
    5. 7.5 Middle East and Africa | | |
      1. 7.5.1 Saudi Arabia | | |
      2. 7.5.2 United Arab Emirates | | |
      3. 7.5.3 South Africa | | |
      4. 7.5.4 Egypt | | |
      5. 7.5.5 Rest of Middle East and Africa | |
  8. 8 Future Outlook (2026–2035) | |
    1. 8.1 AI-Assisted Autonomous Operations | |
    2. 8.2 Open, Software-Defined Control Architectures | |
    3. 8.3 Electricity Demand Supercycle | |
    4. 8.4 Emissions Accounting and Decarbonization Compliance | |
  9. 9 Segmentation Analysis | |
    1. 9.1 By Solution | | |
      1. 9.1.1 Supervisory Control and Data Acquisition (SCADA) | | |
      2. 9.1.2 Programmable Logic Controller (PLC) | | |
      3. 9.1.3 Distributed Control System (DCS) | | |
      4. 9.1.4 Plant Asset Management (PAM) | | |
      5. 9.1.5 Plant Lifecycle Management (PLM) | |
    2. 9.2 By Component | | |
      1. 9.2.1 Hardware | | |
      2. 9.2.2 Software | |
    3. 9.3 By Plant Type | | |
      1. 9.3.1 Thermal | | |
      2. 9.3.2 Nuclear | | |
      3. 9.3.3 Renewables | |
  10. 10 Competitive Landscape | |
    1. 10.1 Market Concentration Analysis | |
    2. 10.2 Competitive Benchmarking Matrix | |
    3. 10.3 Company Profiles | | |
      1. 10.3.1 ABB Ltd. | | |
      2. 10.3.2 Siemens Energy AG | | |
      3. 10.3.3 GE Vernova | | |
      4. 10.3.4 Emerson Electric Co. | | |
      5. 10.3.5 Honeywell International Inc. | | |
      6. 10.3.6 Yokogawa Electric Corporation | | |
      7. 10.3.7 Mitsubishi Heavy Industries | | |
      8. 10.3.8 Schneider Electric SE | | |
      9. 10.3.9 Rockwell Automation Inc. | | |
      10. 10.3.10 Hitachi Energy | |
  11. 11 Recent News & Developments | |
  12. 12 Report Scope and Methodology | |
  13. 13 Detailed Sources and Citations | |
  14. 14 Frequently Asked Questions (FAQs) | | LIST OF TABLES | |
  15. TABLE 1 Global Market Snapshot, 2025–2035 | |
  16. TABLE 2 Global Market Size and Forecast, by Revenue (USD Billion), 2021–2035 | |
  17. TABLE 3 Driver Impact Analysis, 2026–2035 | |
  18. TABLE 4 Restraints Impact Analysis, 2026–2035 | |
  19. TABLE 5 Regional Summary, 2025 | |
  20. TABLE 6 North America Market, by Country, 2025 | |
  21. TABLE 7 Europe Market, by Country, 2025 | |
  22. TABLE 8 Asia-Pacific Market, by Country, 2025 | |
  23. TABLE 9 South America Market, by Country, 2025 | |
  24. TABLE 10 Middle East and Africa Market, by Country, 2025 | |
  25. TABLE 11 Global Market, by Solution, 2025 | |
  26. TABLE 12 Global Market, by Component, 2025 | |
  27. TABLE 13 Global Market, by Plant Type, 2025 | |
  28. TABLE 14 Competitive Benchmarking Matrix, 2025 | |
  29. TABLE 15 Report Scope and Methodology | |
  30. TABLE 16 Detailed Sources and Citations | |
  31. TABLE 17 Segmentation Quick Reference | |
  32. TABLE 18 Market Segmentation Overview, by Solution | |
  33. TABLE 19 Market Segmentation Overview, by Component | |
  34. TABLE 20 Market Segmentation Overview, by Plant Type | | LIST OF FIGURES | |
  35. FIGURE 1 Market Dynamics Overview (Drivers, Restraints, Opportunities) | |
  36. FIGURE 2 Industry Value Chain Analysis | |
  37. FIGURE 3 Porter's Five Forces Analysis | |
  38. FIGURE 4 Global Market Size Trend, 2021–2035 (USD Billion) | |
  39. FIGURE 5 Year-over-Year Growth Trend, 2022–2035 | |
  40. FIGURE 6 Market Share, by Solution, 2025 | |
  41. FIGURE 7 Market Share, by Component, 2025 | |
  42. FIGURE 8 Market Share, by Plant Type, 2025 | |
  43. FIGURE 9 Regional Market Share, 2025 | |
  44. FIGURE 10 North America Country Share, 2025 | |
  45. FIGURE 11 Europe Country Share, 2025 | |
  46. FIGURE 12 Asia-Pacific Country Share, 2025 | |
  47. FIGURE 13 South America Country Share, 2025 | |
  48. FIGURE 14 Middle East and Africa Country Share, 2025 | |
  49. FIGURE 15 Competitive Landscape, Estimated Vendor Share Ranges, 2025

Segmentation Quick Reference

DimensionSub-SegmentsDominant SegmentFastest Growing Segment
By SolutionSupervisory Control and Data Acquisition (SCADA); Programmable Logic Controller (PLC); Distributed Control System (DCS); Plant Asset Management (PAM); Plant Lifecycle Management (PLM)Distributed Control System (DCS) (39.6% share)Supervisory Control and Data Acquisition (SCADA) (7.5% CAGR)
By ComponentHardware; SoftwareHardware (62.4% share)Software (7.9% CAGR)
By Plant TypeThermal; Nuclear; RenewablesThermal (45.1% share)Renewables (9.6% CAGR)
By RegionNorth America; Europe; Asia-Pacific; South America; Middle East and AfricaAsia-Pacific (41.2% share)Asia-Pacific (41.2% share)

Market Segmentation Overview

By Solution

Sub-SegmentKey Trend
Supervisory Control and Data Acquisition (SCADA)Portfolio-level supervision of renewable and hybrid fleets
Programmable Logic Controller (PLC)Auxiliary, tracker and balance-of-plant automation
Distributed Control System (DCS)Migration of 1990s-era platforms to networked controllers
Plant Asset Management (PAM)Predictive maintenance for daily-cycling units
Plant Lifecycle Management (PLM)Digital engineering records supporting license extension

Distributed Control System (DCS) leads because thermal and nuclear units depend on deterministic, tightly integrated loop control that no other solution replaces. Supervisory Control and Data Acquisition (SCADA) grows fastest as operators supervise dispersed solar and wind assets from central control rooms. Plant Asset Management (PAM) benefits from the equipment stress that frequent cycling places on boilers and turbines.

By Component

Sub-SegmentKey Trend
HardwareRedundant controllers and cyber-hardened network components
SoftwareSubscription historians, analytics and optimization modules

Hardware dominates because every new unit and migration requires controllers, I/O, networks and operator stations. Software grows fastest since analytics and optimization modules can be layered onto installed controllers without replacing them, and cybersecurity patching is easier to deliver through software updates than through hardware refreshes.

By Plant Type

Sub-SegmentKey Trend
ThermalFlexible-operation retrofits and life extension
NuclearAnalog-to-digital instrumentation upgrades and SMR new build
RenewablesCentralized plant controllers for inverter-dense sites

Thermal plants lead as coal and gas units are retrofitted to cycle daily and remain online to meet rising demand. Renewables grow fastest because each new solar, wind or hybrid site requires a controller meeting tightening grid codes. Nuclear stays a stable, high-value niche anchored by license extensions and early SMR projects.


Download PDF ×

We do not share your information with anyone. However, we may send you emails based on your report interest from time to time. You may contact us at any time to opt-out.