Request Free Sample ×

Kindly complete the form below to receive a free sample of this Report

* Please use a valid business email

Leading companies partner with us for data-driven Insights

clients tt-cursor
Hero Background

Power Metering Market

ID: MRFR/EnP/1930-HCR
188 Pages
Chitranshi Jaiswal
Last Updated: May 02, 2026

Power Metering Market Research Report By Technology (Analog Meters, Digital Meters, Smart Meters, Multi-Function Meters), By End Use (Residential, Commercial, Industrial), By Application (Energy Monitoring, Demand Response Management, Revenue Protection), By Component (Metering Devices, Communication Modules, Software Applications) and By Regional (North America, Europe, South America, Asia Pacific, Middle East and Africa) - Forecast to 2035

Share:
Download PDF ×

We do not share your information with anyone. However, we may send you emails based on your report interest from time to time. You may contact us at any time to opt-out.

Power Metering Market Infographic
Purchase Options
  1. SECTION I: EXECUTIVE SUMMARY AND KEY HIGHLIGHTS
    1. 1.1 EXECUTIVE SUMMARY
      1. 1.1.1 Market Overview
      2. 1.1.2 Key Findings
      3. 1.1.3 Market Segmentation
      4. 1.1.4 Competitive Landscape
      5. 1.1.5 Challenges and Opportunities
      6. 1.1.6 Future Outlook 2
  2. SECTION II: SCOPING, METHODOLOGY AND MARKET STRUCTURE
    1. 2.1 MARKET INTRODUCTION
      1. 2.1.1 Definition
      2. 2.1.2 Scope of the study
        1. 2.1.2.1 Research Objective
        2. 2.1.2.2 Assumption
        3. 2.1.2.3 Limitations
    2. 2.2 RESEARCH METHODOLOGY
      1. 2.2.1 Overview
      2. 2.2.2 Data Mining
      3. 2.2.3 Secondary Research
      4. 2.2.4 Primary Research
        1. 2.2.4.1 Primary Interviews and Information Gathering Process
        2. 2.2.4.2 Breakdown of Primary Respondents
      5. 2.2.5 Forecasting Model
      6. 2.2.6 Market Size Estimation
        1. 2.2.6.1 Bottom-Up Approach
        2. 2.2.6.2 Top-Down Approach
      7. 2.2.7 Data Triangulation
      8. 2.2.8 Validation 3
  3. SECTION III: QUALITATIVE ANALYSIS
    1. 3.1 MARKET DYNAMICS
      1. 3.1.1 Overview
      2. 3.1.2 Drivers
      3. 3.1.3 Restraints
      4. 3.1.4 Opportunities
    2. 3.2 MARKET FACTOR ANALYSIS
      1. 3.2.1 Value chain Analysis
      2. 3.2.2 Porter's Five Forces Analysis
        1. 3.2.2.1 Bargaining Power of Suppliers
        2. 3.2.2.2 Bargaining Power of Buyers
        3. 3.2.2.3 Threat of New Entrants
        4. 3.2.2.4 Threat of Substitutes
        5. 3.2.2.5 Intensity of Rivalry
      3. 3.2.3 COVID-19 Impact Analysis
        1. 3.2.3.1 Market Impact Analysis
        2. 3.2.3.2 Regional Impact
        3. 3.2.3.3 Opportunity and Threat Analysis 4
  4. SECTION IV: QUANTITATIVE ANALYSIS
    1. 4.1 Energy & Power Metering Market, BY Application (USD Billion)
      1. 4.1.1 Residential
      2. 4.1.2 Commercial
      3. 4.1.3 Industrial
      4. 4.1.4 Utility
      5. 4.1.5 Renewable Energy
    2. 4.2 Energy & Power Metering Market, BY End Use (USD Billion)
      1. 4.2.1 Energy Management
      2. 4.2.2 Billing and Revenue Assurance
      3. 4.2.3 Load Monitoring
      4. 4.2.4 Demand Response
      5. 4.2.5 Grid Management
    3. 4.3 Energy & Power Metering Market, BY Technology (USD Billion)
      1. 4.3.1 Smart Meters
      2. 4.3.2 Analog Meters
      3. 4.3.3 Digital Meters
      4. 4.3.4 Prepaid Meters
      5. 4.3.5 Advanced Metering Infrastructure
    4. 4.4 Energy & Power Metering Market, BY Component (USD Billion)
      1. 4.4.1 Current Transformers
      2. 4.4.2 Voltage Transformers
      3. 4.4.3 Data Loggers
      4. 4.4.4 Communication Modules
      5. 4.4.5 Software Solutions
    5. 4.5 Energy & Power Metering Market, BY Type (USD Billion)
      1. 4.5.1 Single Phase
      2. 4.5.2 Three Phase
      3. 4.5.3 Smart Metering
    6. 4.6 Energy & Power Metering Market, BY Region (USD Billion)
      1. 4.6.1 North America
        1. 4.6.1.1 US
        2. 4.6.1.2 Canada
      2. 4.6.2 Europe
        1. 4.6.2.1 Germany
        2. 4.6.2.2 UK
        3. 4.6.2.3 France
        4. 4.6.2.4 Russia
        5. 4.6.2.5 Italy
        6. 4.6.2.6 Spain
        7. 4.6.2.7 Rest of Europe
      3. 4.6.3 APAC
        1. 4.6.3.1 China
        2. 4.6.3.2 India
        3. 4.6.3.3 Japan
        4. 4.6.3.4 South Korea
        5. 4.6.3.5 Malaysia
        6. 4.6.3.6 Thailand
        7. 4.6.3.7 Indonesia
        8. 4.6.3.8 Rest of APAC
      4. 4.6.4 South America
        1. 4.6.4.1 Brazil
        2. 4.6.4.2 Mexico
        3. 4.6.4.3 Argentina
        4. 4.6.4.4 Rest of South America
      5. 4.6.5 MEA
        1. 4.6.5.1 GCC Countries
        2. 4.6.5.2 South Africa
        3. 4.6.5.3 Rest of MEA 5
  5. SECTION V: COMPETITIVE ANALYSIS
    1. 5.1 Competitive Landscape
      1. 5.1.1 Overview
      2. 5.1.2 Competitive Analysis
      3. 5.1.3 Market share Analysis
      4. 5.1.4 Major Growth Strategy in the Energy & Power
      5. 5.1.5 Competitive Benchmarking
      6. 5.1.6 Leading Players in Terms of Number of Developments in the Energy & Power
      7. 5.1.7 Key developments and growth strategies
        1. 5.1.7.1 New Product Launch/Service Deployment
        2. 5.1.7.2 Merger & Acquisitions
        3. 5.1.7.3 Joint Ventures
      8. 5.1.8 Major Players Financial Matrix
        1. 5.1.8.1 Sales and Operating Income
        2. 5.1.8.2 Major Players R&D Expenditure. 2023
    2. 5.2 Company Profiles
      1. 5.2.1 Siemens (DE)
        1. 5.2.1.1 Financial Overview
        2. 5.2.1.2 Products Offered
        3. 5.2.1.3 Key Developments
        4. 5.2.1.4 SWOT Analysis
        5. 5.2.1.5 Key Strategies
      2. 5.2.2 Schneider Electric (FR)
        1. 5.2.2.1 Financial Overview
        2. 5.2.2.2 Products Offered
        3. 5.2.2.3 Key Developments
        4. 5.2.2.4 SWOT Analysis
        5. 5.2.2.5 Key Strategies
      3. 5.2.3 General Electric (US)
        1. 5.2.3.1 Financial Overview
        2. 5.2.3.2 Products Offered
        3. 5.2.3.3 Key Developments
        4. 5.2.3.4 SWOT Analysis
        5. 5.2.3.5 Key Strategies
      4. 5.2.4 Itron (US)
        1. 5.2.4.1 Financial Overview
        2. 5.2.4.2 Products Offered
        3. 5.2.4.3 Key Developments
        4. 5.2.4.4 SWOT Analysis
        5. 5.2.4.5 Key Strategies
      5. 5.2.5 Landis+Gyr (CH)
        1. 5.2.5.1 Financial Overview
        2. 5.2.5.2 Products Offered
        3. 5.2.5.3 Key Developments
        4. 5.2.5.4 SWOT Analysis
        5. 5.2.5.5 Key Strategies
      6. 5.2.6 Honeywell (US)
        1. 5.2.6.1 Financial Overview
        2. 5.2.6.2 Products Offered
        3. 5.2.6.3 Key Developments
        4. 5.2.6.4 SWOT Analysis
        5. 5.2.6.5 Key Strategies
      7. 5.2.7 Eaton (US)
        1. 5.2.7.1 Financial Overview
        2. 5.2.7.2 Products Offered
        3. 5.2.7.3 Key Developments
        4. 5.2.7.4 SWOT Analysis
        5. 5.2.7.5 Key Strategies
      8. 5.2.8 Kamstrup (DK)
        1. 5.2.8.1 Financial Overview
        2. 5.2.8.2 Products Offered
        3. 5.2.8.3 Key Developments
        4. 5.2.8.4 SWOT Analysis
        5. 5.2.8.5 Key Strategies
      9. 5.2.9 Sensus (US)
        1. 5.2.9.1 Financial Overview
        2. 5.2.9.2 Products Offered
        3. 5.2.9.3 Key Developments
        4. 5.2.9.4 SWOT Analysis
        5. 5.2.9.5 Key Strategies
    3. 5.3 Appendix
      1. 5.3.1 References
      2. 5.3.2 Related Reports

Energy & Power Metering Market Segmentation

Energy & Power Metering Market By Application (USD Billion, 2025-2035)
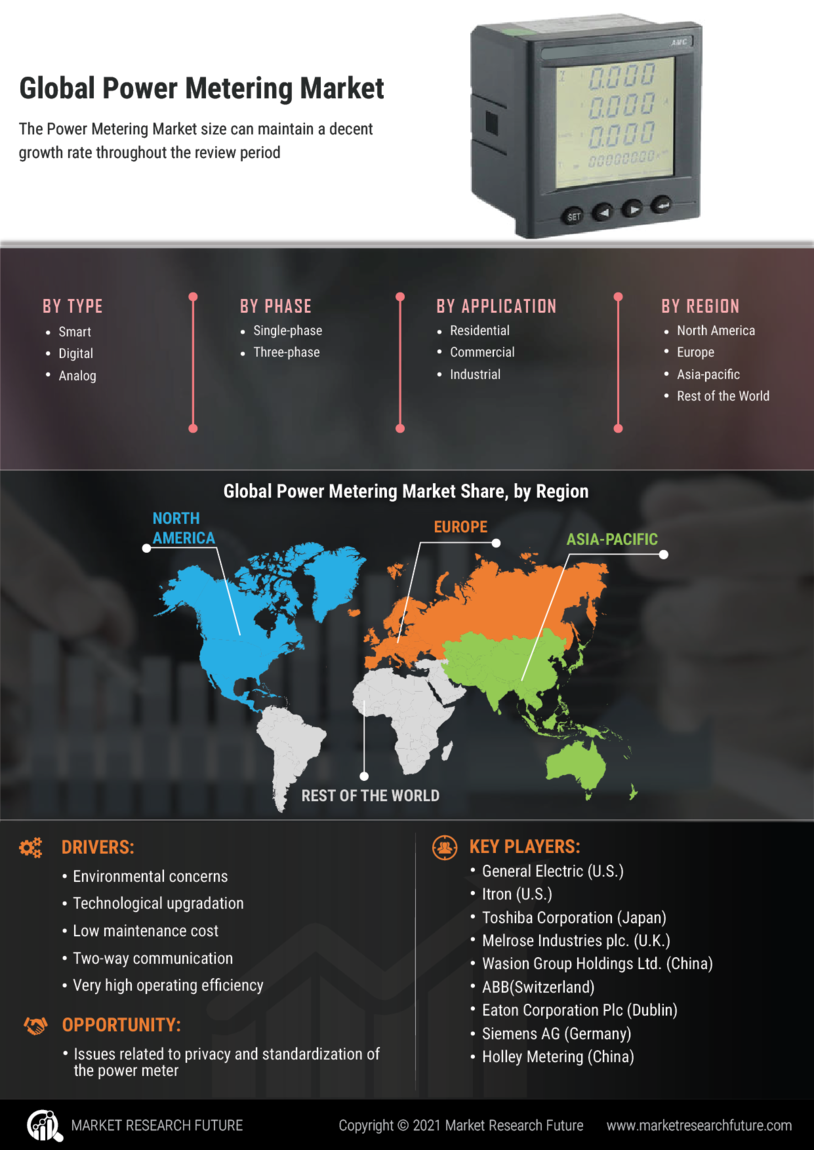
  • Residential
  • Commercial
  • Industrial
  • Utility
  • Renewable Energy

Energy & Power Metering Market By End Use (USD Billion, 2025-2035)

  • Energy Management
  • Billing and Revenue Assurance
  • Load Monitoring
  • Demand Response
  • Grid Management

Energy & Power Metering Market By Technology (USD Billion, 2025-2035)

  • Smart Meters
  • Analog Meters
  • Digital Meters
  • Prepaid Meters
  • Advanced Metering Infrastructure

Energy & Power Metering Market By Component (USD Billion, 2025-2035)

  • Current Transformers
  • Voltage Transformers
  • Data Loggers
  • Communication Modules
  • Software Solutions

Energy & Power Metering Market By Type (USD Billion, 2025-2035)

  • Single Phase
  • Three Phase
  • Smart Metering

Compare Licence

×
Features License Type
Single User Multiuser License Enterprise User
Price $4,950 $5,950 $7,250
Maximum User Access Limit 1 User Upto 10 Users Unrestricted Access Throughout the Organization
Free Customization
Direct Access to Analyst
Deliverable Format
Platform Access
Discount on Next Purchase 10% 15% 15%
Printable Versions