• Cat-intel
  • MedIntelliX
  • Resources
  • About Us
  • Request Free Sample ×

    Kindly complete the form below to receive a free sample of this Report

    Leading companies partner with us for data-driven Insights

    clients tt-cursor

    Power Factor Correction Units Market

    ID: MRFR/E&P/39897-HCR
    128 Pages
    Snehal Singh
    September 2025

    Power Factor Correction Units Market Research Report By Type (Capacitor Banks, Synchronous Condensers, Active Power Filters, Static Var Compensators), By Application (Industrial, Commercial, Residential, Utilities), By Component (Fixed Capacitors, Automatic Capacitor Controllers, Power Factor Monitors), By End Use (Manufacturing, Data Centers, Telecommunications, Mining) and By Regional (North America, Europe, South America, Asia Pacific, Middle East and Africa) - Forecast to 2035

    Share:
    Download PDF ×

    We do not share your information with anyone. However, we may send you emails based on your report interest from time to time. You may contact us at any time to opt-out.

    Power Factor Correction Units Market Research Report - Forecast till 2035 Infographic
    Purchase Options
    $ 4,950.0
    $ 5,950.0
    $ 7,250.0
    Table of Contents

    Power Factor Correction Units Market Summary

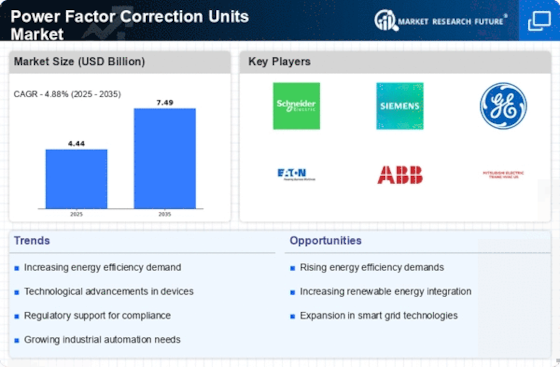
    The Global Power Factor Correction Units Market is projected to grow from 4.44 USD Billion in 2024 to 7.5 USD Billion by 2035, reflecting a robust CAGR of 4.88% from 2025 to 2035.

    Key Market Trends & Highlights

    Power Factor Correction Units Key Trends and Highlights

    • The market valuation is expected to increase from 4.44 USD Billion in 2024 to 7.5 USD Billion by 2035.
    • A compound annual growth rate (CAGR) of 4.88% is anticipated for the period between 2025 and 2035.
    • The growth trajectory indicates a rising demand for power factor correction units across various industries.
    • Growing adoption of energy-efficient technologies due to increasing regulatory standards is a major market driver.

    Market Size & Forecast

    2024 Market Size 4.44 (USD Billion)
    2035 Market Size 7.5 (USD Billion)
    CAGR (2025-2035) 4.88%

    Major Players

    General Electric, Schweitzer Engineering Laboratories, ABB, Rockwell Automation, Schneider Electric, Electro Meters, Littelfuse, Siemens, Eaton, Nitto Denko, Vishay Intertechnology, Sungrow Power Supply, Mitsubishi Electric, Green Power Solutions, Crompton Greaves

    Power Factor Correction Units Market Trends

    The Power Factor Correction Units Market is experiencing significant growth driven by the increasing demand for energy efficiency across industries. As businesses strive to reduce energy costs and improve electrical systems’ performance, the adoption of power factor correction units has surged. Regulatory frameworks and initiatives aimed at promoting energy conservation further propel this market forward.

    There is also a growing focus on providing customized solutions for different industrial sectors, which can help businesses significantly enhance their operational efficiency. Additionally, emerging markets are beginning to recognize the importance of power factor correction, creating avenues for expansion and new partnerships.  In recent times, the market has seen a trend toward more compact and efficient designs as industries seek to save space and improve energy ratios.

    The development of advanced digital controllers further enhances the functionality and ease of use of power factor correction units, making them more attractive to end users.Companies are increasingly focusing on sustainability, not only in product offerings but also in manufacturing processes.

    This move towards environmental responsibility aligns with the broader trend of clean energy adoption, influencing consumer preferences and driving market evolution. Overall, the Power Factor Correction Units Market presents a dynamic landscape for growth, innovation, and sustainability.

    The increasing emphasis on energy efficiency and sustainability is driving the adoption of power factor correction units across various sectors, as organizations seek to optimize their energy consumption and reduce operational costs.

    U.S. Department of Energy

    Power Factor Correction Units Market Drivers

    Increasing Demand for Energy Efficiency

    The Global Power Factor Correction Units Market Industry is experiencing a notable surge in demand for energy-efficient solutions. As industries and commercial establishments strive to reduce energy consumption and operational costs, power factor correction units have become essential. These units help in minimizing energy losses and improving the efficiency of electrical systems. In 2024, the market is projected to reach 4.44 USD Billion, reflecting a growing awareness of energy conservation. This trend is expected to continue, with the market potentially reaching 7.5 USD Billion by 2035, indicating a compound annual growth rate of 4.88% from 2025 to 2035.

    Market Segment Insights

    Power Factor Correction Units Market Segment Insights:

    Power Factor Correction Units Market Segment Insights:

    Power Factor Correction Units Market Type Insights   

    Power Factor Correction Units Market Type Insights    

    The Power Factor Correction Units Market shows a diverse segmentation under the Type category, with Capacitor Banks, Synchronous Condensers, Active Power Filters, and Static Var Compensators each contributing to the market's dynamics. In 2024, the market is valued at 4.44 USD Billion, with Capacitor Banks leading the charge at 1.78 USD Billion, highlighting their majority holding in the market.

    These units play a significant role in enhancing energy efficiency in industrial applications and are projected to grow to 3.0 USD Billion by 2035, indicating their continued relevance in the energy sector.Following closely, Synchronous Condensers are valued at 1.2 USD Billion in 2024 and are expected to reach 2.0 USD Billion by 2035, underlining their importance in maintaining grid stability and managing reactive power. Active Power Filters, with a 2024 valuation of 1.0 USD Billion, are crucial for improving power quality and reducing harmonics, with an expected growth to 1.5 USD Billion by 2035.

    Lastly, Static Var Compensators, starting at 0.46 USD Billion in 2024 and anticipated to rise to 1.0 USD Billion by 2035, serve as critical components for voltage stabilization and reactive power compensation, though they represent a smaller portion of the market compared to others.This segmentation showcases that while all types play crucial roles in power factor correction, Capacitor Banks dominate significantly, amplifying their contribution to the overall market growth. The increasing demand for energy efficiency, regulatory support for power quality improvement, and the rising need for grid stability collectively drive the market growth in this segment.

    As industries look for reliable solutions to improve energy consumption efficiency and reduce electricity costs, the focus on these various types of power factor correction units is anticipated to expand further in the upcoming years.

    Power Factor Correction Units Market Application Insights   

    Power Factor Correction Units Market Application Insights   

    The Power Factor Correction Units Market is projected to reach a value of 4.44 USD Billion by 2024, showcasing the ongoing demand for efficient power management solutions across various applications. This segment comprises diverse categories such as Industrial, Commercial, Residential, and Utilities, each contributing to the overall market dynamics. The Industrial sector plays a pivotal role, utilizing power factor correction units to enhance energy efficiency and decrease operational costs, thus driving a significant portion of the market.

    The Commercial sector also emphasizes efficiency, with an increasing focus on sustainable practices that favor the adoption of these correction units. In the Residential segment, growing awareness regarding energy consumption and utility bills is encouraging households to invest in power factor correction units for better savings. Utilities are also crucial as they work towards maintaining system stability and performance while managing energy demand.

    The market growth is primarily fueled by the increasing need to optimize energy consumption, reduce carbon footprints, and comply with regulatory standards, rendering power factor correction units essential across these applications in the Power Factor Correction Units Market.

    Power Factor Correction Units Market Component Insights   

    Power Factor Correction Units Market Component Insights   

    The Power Factor Correction Units Market is projected to experience notable growth, with a value of 4.44 USD Billion by 2024, primarily driven by advancements in technology and increasing demand for energy efficiency. The market segmentation identifies the essential components, including Fixed Capacitors, Automatic Capacitor Controllers, and Power Factor Monitors, each playing a pivotal role in enhancing system performance. Fixed Capacitors dominate the market due to their reliability and widespread application in various industries, enabling effective voltage regulation and reactive power compensation.

    Automatic Capacitor Controllers are significant for their ability to optimize energy use, ensuring that power factors remain within optimal limits, thereby reducing overall energy costs. Power Factor Monitors, essential for real-time data collection and analysis, empower organizations to make informed decisions regarding their power factor correction strategies. Together, these components contribute to substantial improvements in efficiency and cost savings, aligning with the industry's growing emphasis on sustainable energy practices and regulatory compliance, thereby shaping the future growth trajectory of the Power Factor Correction Units Market.

    Power Factor Correction Units Market End Use Insights   

    Power Factor Correction Units Market End Use Insights   

    The Power Factor Correction Units Market, particularly focusing on the End Use segment, is witnessing a substantial expansion, with a market value projected at 4.44 billion USD in 2024. This growth is significantly fueled by the increasing demand for energy efficiency across various industries. Manufacturing stands out as a prominent end user, leveraging power factor correction units to optimize power consumption and reduce energy costs, which is essential in a highly competitive market. Data centers are also becoming a significant component, necessitating power factor correction to maintain operational efficiency and reliability, given their high energy usage.

    Telecommunications, with the surge in mobile data and internet services, utilize power factor correction units to enhance grid stability and reduce operational costs. Mining operations, characterized by their energy-intensive processes, benefit from improved power factors, enabling them to minimize penalties associated with poor power quality.

    As the market progresses, these industries present notable opportunities and challenges, driving the demand for effective power factor correction solutions while also navigating the complexities of regulatory compliance and energy management practices.The Power Factor Correction Units Market data reflects a comprehensive understanding of these trends, highlighting the vital role of each end user in shaping the market's future landscape.

    Get more detailed insights about Power Factor Correction Units Market Research Report - Forecast till 2035

    Regional Insights

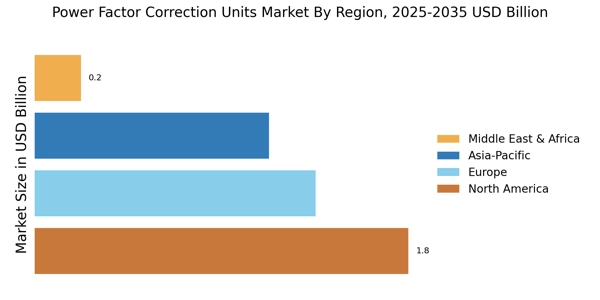
    The Power Factor Correction Units Market is poised for significant growth across various regions. In North America, the market was valued at 1.45 USD Billion in 2024 and is expected to reach 2.45 USD Billion by 2035, indicating its dominance in the sector due to the region's extensive industrial base and focus on energy efficiency. Europe follows closely with a valuation of 1.2 USD Billion in 2024, projected to grow to 1.95 USD Billion by 2035, driven by strict regulatory requirements concerning energy consumption and emissions.

    The APAC region also represents a substantial share, with a market value of 1.35 USD Billion in 2024, anticipated to increase to 2.3 USD Billion by 2035, reflecting rapid industrialization and urbanization.In South America, the market is smaller, valued at 0.25 USD Billion in 2024 and expected to grow to 0.4 USD Billion by 2035, influenced by developing infrastructure but facing economic challenges.

    Meanwhile, the MEA segment, valued at 0.19 USD Billion in 2024 and projected to rise to 0.35 USD Billion by 2035, remains the least dominant due to its limited industrial activity but shows potential for growth in renewable energy projects and industrial advancements. The market growth is driven by the increasing need for improved power efficiency, regulatory support, and technological advancements across these regions.

    Power Factor Correction Units Market by Region

    Key Players and Competitive Insights

    The Power Factor Correction Units Market is characterized by a rapidly evolving competitive landscape where various players strive to establish their dominance through innovative solutions and enhanced product offerings. This market, which has gained significant traction due to the increasing need for energy efficiency and the reduction of electrical losses, is driven by a growing demand from industries and commercial establishments aiming to improve their power quality. Competitive insights in this market reveal that key players are focusing on technological advancements, customer-centric product designs, and strategic collaborations to gain a competitive edge.

    Factors such as regional market dynamics, regulatory frameworks, and the ever-increasing emphasis on sustainability are further influencing the competitive strategies of organizations operating in this space.

    General Electric has a robust presence in the Power Factor Correction Units Market, leveraging its extensive portfolio of electrical products and solutions. The company's strengths lie in its advanced engineering capabilities and innovative technologies, which allow it to deliver high-performance power factor correction units that cater to diverse industrial applications. General Electric's commitment to research and development also sets it apart, enabling the company to introduce cutting-edge solutions that enhance energy efficiency and reduce operational costs for its customers.

    Furthermore, the company's global reach and strong brand reputation enable it to build long-lasting relationships with clients, thereby facilitating market penetration and expansion opportunities. GE's strategic initiatives, including partnerships and joint ventures, enhance its competitive positioning in the power factor correction market, making it a formidable player.

    On the other hand, Schweitzer Engineering Laboratories has carved out a niche for itself within the Power Factor Correction Units Market thanks to its specialized focus on providing high-quality engineering products tailored for power management. The company’s strengths are rooted in its commitment to innovation and reliability, which have earned it a strong reputation among industry professionals. Schweitzer Engineering Laboratories prioritizes customer satisfaction by offering personalized solutions that meet specific power quality needs. The company's comprehensive approach includes providing technical support and training to its customers, thus reinforcing its market presence.

    With a strong emphasis on research and development, Schweitzer Engineering Laboratories continues to advance its technology, ensuring that its power factor correction units effectively address the challenges faced by modern industries, further solidifying its position in the competitive landscape.

    Key Companies in the Power Factor Correction Units Market market include

    Industry Developments

    • Q2 2024: Schneider Electric launches new AccuSine+ Power Correction Solution for industrial facilities Schneider Electric announced the launch of its AccuSine+ Power Correction Solution, designed to improve power quality and energy efficiency in industrial environments by providing advanced power factor correction and harmonic mitigation capabilities.
    • Q1 2024: Eaton introduces next-generation Power Xpert Power Factor Correction (PFC) systems Eaton unveiled its new Power Xpert PFC systems, which offer modular design and enhanced digital monitoring for commercial and industrial customers seeking to optimize power quality and reduce energy costs.
    • Q2 2024: Siemens expands Sentron portfolio with new automatic power factor correction devices Siemens announced the addition of new automatic power factor correction devices to its Sentron portfolio, targeting improved energy efficiency and compliance with grid regulations for commercial and industrial users.
    • Q2 2024: ABB launches new PQF Active power factor correction filters for global markets ABB introduced its PQF Active power factor correction filters, designed to address harmonics and improve power quality in manufacturing and data center applications.
    • Q1 2024: GE announces partnership with Enel X to deploy advanced power factor correction solutions in North America GE and Enel X entered a partnership to deliver advanced power factor correction and energy optimization solutions for industrial and utility customers across North America.
    • Q2 2024: Schneider Electric opens new manufacturing facility for power factor correction units in Texas Schneider Electric inaugurated a new manufacturing facility in Texas dedicated to producing power factor correction units, aiming to meet growing demand in the North American market.
    • Q1 2024: Eaton secures major contract to supply power factor correction systems for Middle East oil & gas project Eaton announced it has been awarded a contract to supply power factor correction systems for a large-scale oil & gas infrastructure project in the Middle East.
    • Q2 2024: Siemens partners with Tata Power to deploy smart power factor correction solutions in India Siemens and Tata Power formed a partnership to implement smart power factor correction solutions across Tata Power's distribution network, aiming to enhance grid stability and efficiency.
    • Q1 2024: ABB wins contract to supply power factor correction equipment for European data center ABB secured a contract to provide power factor correction equipment for a new hyperscale data center in Europe, supporting the facility's energy efficiency goals.
    • Q2 2024: GE launches digital power factor correction platform for industrial automation GE introduced a digital platform for power factor correction, integrating real-time monitoring and analytics to help industrial customers optimize power usage and reduce costs.

    Future Outlook

    Power Factor Correction Units Market Future Outlook

    The Power Factor Correction Units Market is projected to grow at a 4.88% CAGR from 2024 to 2035, driven by increasing energy efficiency regulations and industrial automation.

    New opportunities lie in:

    • Develop smart power factor correction solutions integrating IoT technology for real-time monitoring.
    • Expand into emerging markets with tailored solutions for local energy challenges.
    • Invest in R&D for advanced capacitor technologies to enhance performance and reliability.

    By 2035, the market is expected to exhibit robust growth, reflecting evolving energy demands and technological advancements.

    Market Segmentation

    Power Factor Correction Units Market Type Outlook

    • Capacitor Banks
    • Synchronous Condensers
    • Active Power Filters
    • Static Var Compensators

    Power Factor Correction Units Market End Use Outlook

    • Manufacturing
    • Data Centers
    • Telecommunications
    • Mining

    Power Factor Correction Units Market Regional Outlook

    • North America
    • Europe
    • South America
    • Asia Pacific
    • Middle East and Africa

    Power Factor Correction Units Market Component Outlook

    • Fixed Capacitors
    • Automatic Capacitor Controllers
    • Power Factor Monitors

    Power Factor Correction Units Market Application Outlook

    • Industrial
    • Commercial
    • Residential
    • Utilities

    Report Scope

    Report Attribute/Metric Details
    Market Size 2023 4.23 (USD Billion)
    Market Size 2024 4.44 (USD Billion)
    Market Size 2035 7.5 (USD Billion)
    Compound Annual Growth Rate (CAGR) 4.88% (2025 - 2035)
    Report Coverage Revenue Forecast, Competitive Landscape, Growth Factors, and Trends
    Base Year 2024
    Market Forecast Period 2025 - 2035
    Historical Data 2019 - 2024
    Market Forecast Units USD Billion
    Key Companies Profiled General Electric, Schweitzer Engineering Laboratories, ABB, Rockwell Automation, Schneider Electric, Electro Meters, Littelfuse, Siemens, Eaton, Nitto Denko, Vishay Intertechnology, Sungrow Power Supply, Mitsubishi Electric, Green Power Solutions, Crompton Greaves
    Segments Covered Type, Application, Component, End Use, Regional
    Key Market Opportunities Rising demand for energy efficiency, Growing industrial automation adoption, Increasing renewable energy integration, Regulatory compliance for power quality, Expansion in emerging markets
    Key Market Dynamics Increasing electricity demand, Energy efficiency regulations, Rising industrial automation, Growing renewable energy installations, Cost reduction strategies
    Countries Covered North America, Europe, APAC, South America, MEA

    Market Highlights

    Author
    Snehal Singh
    Assistant Manager - Research

    High acumen in analyzing complex macro & micro markets with more than 6 years of work experience in the field of market research. By implementing her analytical skills in forecasting and estimation into market research reports, she has expertise in Packaging, Construction, and Equipment domains. She handles a team size of 20-25 resources and ensures smooth running of the projects, associated marketing activities, and client servicing.

    Leave a Comment

    FAQs

    What is the expected market size of the Power Factor Correction Units Market in 2024?

    The Power Factor Correction Units Market is expected to be valued at 4.44 USD Billion in 2024.

    What is the projected market size of the Power Factor Correction Units Market by 2035?

    By 2035, the market is projected to reach 7.5 USD Billion.

    What is the expected CAGR for the Power Factor Correction Units Market from 2025 to 2035?

    The expected CAGR for the market from 2025 to 2035 is 4.88%.

    Which region holds the largest market share in the Power Factor Correction Units Market in 2024?

    In 2024, North America holds the largest market share, valued at 1.45 USD Billion.

    What will be the market value of North America in the Power Factor Correction Units Market by 2035?

    North America's market value is expected to increase to 2.45 USD Billion by 2035.

    Who are the key players in the Power Factor Correction Units Market?

    Key players include General Electric, ABB, Siemens, and Schneider Electric, among others.

    What is the estimated market size for Capacitor Banks in 2035?

    The market size for Capacitor Banks is estimated to be 3.0 USD Billion by 2035.

    What is the market size for Active Power Filters in 2024?

    The market size for Active Power Filters is valued at 1.0 USD Billion in 2024.

    What growth opportunities exist in the Power Factor Correction Units Market?

    Emerging trends in energy efficiency and renewable energy integration offer significant growth opportunities.

    What is the market value of the Static Var Compensators segment in 2035?

    The market value of Static Var Compensators is expected to reach 1.0 USD Billion by 2035.

    1. 'TABLE OF CONTENTS
    2. EXECUTIVE SUMMARY
    3. Market Overview
      1. Key Findings
      2. Market Segmentation
    4. Competitive Landscape
      1. Challenges and Opportunities
      2. Future Outlook
    5. MARKET INTRODUCTION
      1. Definition
      2. Scope of the study
        1. Research Objective
        2. Assumption
        3. Limitations
    6. RESEARCH METHODOLOGY
      1. Overview
    7. Data Mining
      1. Secondary Research
      2. Primary Research
    8. Primary Interviews and Information Gathering Process
      1. Breakdown of Primary
    9. Respondents
      1. Forecasting Model
      2. Market Size Estimation
    10. Bottom-Up Approach
      1. Top-Down Approach
      2. Data Triangulation
      3. Validation
    11. MARKET DYNAMICS
      1. Overview
      2. Drivers
      3. Restraints
      4. Opportunities
    12. MARKET FACTOR ANALYSIS
      1. Value chain Analysis
      2. Porter''s Five Forces
    13. Analysis
      1. Bargaining Power of Suppliers
        1. Bargaining Power
    14. of Buyers
      1. Threat of New Entrants
        1. Threat of Substitutes
        2. Intensity of Rivalry
      2. COVID-19 Impact Analysis
    15. Market Impact Analysis
      1. Regional Impact
        1. Opportunity and
    16. Threat Analysis
    17. POWER FACTOR CORRECTION UNITS MARKET,
    18. BY TYPE (USD BILLION)
      1. Capacitor Banks
      2. Synchronous Condensers
      3. Active Power Filters
      4. Static Var Compensators
    19. POWER
    20. FACTOR CORRECTION UNITS MARKET, BY APPLICATION (USD BILLION)
      1. Industrial
      2. Commercial
      3. Residential
      4. Utilities
    21. POWER
    22. FACTOR CORRECTION UNITS MARKET, BY COMPONENT (USD BILLION)
      1. Fixed Capacitors
      2. Automatic Capacitor Controllers
      3. Power Factor Monitors
    23. POWER FACTOR CORRECTION UNITS MARKET, BY END USE (USD BILLION)
      1. Manufacturing
      2. Data Centers
      3. Telecommunications
      4. Mining
    24. POWER FACTOR CORRECTION UNITS MARKET, BY REGIONAL (USD BILLION)
      1. North
    25. America
      1. US
        1. Canada
      2. Europe
        1. Germany
        2. UK
        3. France
        4. Russia
        5. Italy
        6. Spain
        7. Rest of Europe
      3. APAC
        1. China
        2. India
        3. Japan
        4. South Korea
    26. Malaysia
      1. Thailand
        1. Indonesia
        2. Rest of APAC
      2. South America
        1. Brazil
        2. Mexico
    27. Argentina
      1. Rest of South America
      2. MEA
        1. GCC
    28. Countries
      1. South Africa
        1. Rest of MEA
    29. COMPETITIVE LANDSCAPE
      1. Overview
      2. Competitive Analysis
      3. Market share Analysis
      4. Major Growth Strategy in the Power
    30. Factor Correction Units Market
      1. Competitive Benchmarking
    31. Leading Players in Terms of Number of Developments in the Power Factor Correction
    32. Units Market
      1. Key developments and growth strategies
        1. New
    33. Product Launch/Service Deployment
      1. Merger & Acquisitions
    34. Joint Ventures
      1. Major Players Financial Matrix
        1. Sales and
    35. Operating Income
      1. Major Players R&D Expenditure. 2023
    36. COMPANY PROFILES
      1. General Electric
        1. Financial Overview
        2. Products Offered
        3. Key Developments
        4. SWOT Analysis
        5. Key Strategies
      2. Schweitzer Engineering Laboratories
        1. Financial Overview
        2. Products Offered
        3. Key Developments
        4. SWOT Analysis
        5. Key Strategies
      3. ABB
    37. Financial Overview
      1. Products Offered
        1. Key Developments
        2. SWOT Analysis
        3. Key Strategies
      2. Rockwell Automation
        1. Financial Overview
        2. Products Offered
        3. Key
    38. Developments
      1. SWOT Analysis
        1. Key Strategies
    39. Schneider Electric
      1. Financial Overview
        1. Products Offered
        2. Key Developments
        3. SWOT Analysis
        4. Key Strategies
      2. Electro Meters
        1. Financial Overview
        2. Products
    40. Offered
      1. Key Developments
        1. SWOT Analysis
    41. Key Strategies
      1. Littelfuse
        1. Financial Overview
    42. Products Offered
      1. Key Developments
        1. SWOT Analysis
        2. Key Strategies
      2. Siemens
        1. Financial Overview
        2. Products Offered
        3. Key Developments
        4. SWOT Analysis
        5. Key Strategies
      3. Eaton
        1. Financial Overview
        2. Products Offered
        3. Key Developments
        4. SWOT
    43. Analysis
      1. Key Strategies
      2. Nitto Denko
        1. Financial
    44. Overview
      1. Products Offered
        1. Key Developments
    45. SWOT Analysis
      1. Key Strategies
      2. Vishay Intertechnology
        1. Financial Overview
        2. Products Offered
    46. Key Developments
      1. SWOT Analysis
        1. Key Strategies
      2. Sungrow Power Supply
        1. Financial Overview
        2. Products
    47. Offered
      1. Key Developments
        1. SWOT Analysis
    48. Key Strategies
      1. Mitsubishi Electric
        1. Financial Overview
        2. Products Offered
        3. Key Developments
        4. SWOT
    49. Analysis
      1. Key Strategies
      2. Green Power Solutions
    50. Financial Overview
      1. Products Offered
        1. Key Developments
        2. SWOT Analysis
        3. Key Strategies
      2. Crompton
    51. Greaves
      1. Financial Overview
        1. Products Offered
    52. Key Developments
      1. SWOT Analysis
        1. Key Strategies
    53. APPENDIX
      1. References
      2. Related Reports
    54. FACTOR CORRECTION UNITS MARKET SIZE ESTIMATES & FORECAST, BY TYPE, 2019-2035
    55. (USD BILLIONS)
    56. SIZE ESTIMATES & FORECAST, BY APPLICATION, 2019-2035 (USD BILLIONS)
    57. NORTH AMERICA POWER FACTOR CORRECTION UNITS MARKET SIZE ESTIMATES & FORECAST,
    58. BY COMPONENT, 2019-2035 (USD BILLIONS)
    59. CORRECTION UNITS MARKET SIZE ESTIMATES & FORECAST, BY END USE, 2019-2035 (USD
    60. BILLIONS)
    61. ESTIMATES & FORECAST, BY REGIONAL, 2019-2035 (USD BILLIONS)
    62. POWER FACTOR CORRECTION UNITS MARKET SIZE ESTIMATES & FORECAST, BY TYPE, 2019-2035
    63. (USD BILLIONS)
    64. & FORECAST, BY APPLICATION, 2019-2035 (USD BILLIONS)
    65. FACTOR CORRECTION UNITS MARKET SIZE ESTIMATES & FORECAST, BY COMPONENT, 2019-2035
    66. (USD BILLIONS)
    67. & FORECAST, BY END USE, 2019-2035 (USD BILLIONS)
    68. CORRECTION UNITS MARKET SIZE ESTIMATES & FORECAST, BY REGIONAL, 2019-2035 (USD
    69. BILLIONS)
    70. & FORECAST, BY TYPE, 2019-2035 (USD BILLIONS)
    71. CORRECTION UNITS MARKET SIZE ESTIMATES & FORECAST, BY APPLICATION, 2019-2035
    72. (USD BILLIONS)
    73. ESTIMATES & FORECAST, BY COMPONENT, 2019-2035 (USD BILLIONS)
    74. CANADA POWER FACTOR CORRECTION UNITS MARKET SIZE ESTIMATES & FORECAST, BY END
    75. USE, 2019-2035 (USD BILLIONS)
    76. MARKET SIZE ESTIMATES & FORECAST, BY REGIONAL, 2019-2035 (USD BILLIONS)
    77. BY TYPE, 2019-2035 (USD BILLIONS)
    78. UNITS MARKET SIZE ESTIMATES & FORECAST, BY APPLICATION, 2019-2035 (USD BILLIONS)
    79. FORECAST, BY COMPONENT, 2019-2035 (USD BILLIONS)
    80. CORRECTION UNITS MARKET SIZE ESTIMATES & FORECAST, BY END USE, 2019-2035 (USD
    81. BILLIONS)
    82. & FORECAST, BY REGIONAL, 2019-2035 (USD BILLIONS)
    83. FACTOR CORRECTION UNITS MARKET SIZE ESTIMATES & FORECAST, BY TYPE, 2019-2035
    84. (USD BILLIONS)
    85. ESTIMATES & FORECAST, BY APPLICATION, 2019-2035 (USD BILLIONS)
    86. GERMANY POWER FACTOR CORRECTION UNITS MARKET SIZE ESTIMATES & FORECAST, BY COMPONENT,
    87. 2035 (USD BILLIONS)
    88. SIZE ESTIMATES & FORECAST, BY END USE, 2019-2035 (USD BILLIONS)
    89. GERMANY POWER FACTOR CORRECTION UNITS MARKET SIZE ESTIMATES & FORECAST,
    90. BY REGIONAL, 2019-2035 (USD BILLIONS)
    91. UNITS MARKET SIZE ESTIMATES & FORECAST, BY TYPE, 2019-2035 (USD BILLIONS)
    92. BY APPLICATION, 2019-2035 (USD BILLIONS)
    93. UNITS MARKET SIZE ESTIMATES & FORECAST, BY COMPONENT, 2019-2035 (USD BILLIONS)
    94. BY END USE, 2019-2035 (USD BILLIONS)
    95. UNITS MARKET SIZE ESTIMATES & FORECAST, BY REGIONAL, 2019-2035 (USD BILLIONS)
    96. FORECAST, BY TYPE, 2019-2035 (USD BILLIONS)
    97. CORRECTION UNITS MARKET SIZE ESTIMATES & FORECAST, BY APPLICATION, 2019-2035
    98. (USD BILLIONS)
    99. ESTIMATES & FORECAST, BY COMPONENT, 2019-2035 (USD BILLIONS)
    100. FRANCE POWER FACTOR CORRECTION UNITS MARKET SIZE ESTIMATES & FORECAST, BY END
    101. USE, 2019-2035 (USD BILLIONS)
    102. MARKET SIZE ESTIMATES & FORECAST, BY REGIONAL, 2019-2035 (USD BILLIONS)
    103. BY TYPE, 2019-2035 (USD BILLIONS)
    104. UNITS MARKET SIZE ESTIMATES & FORECAST, BY APPLICATION, 2019-2035 (USD BILLIONS)
    105. FORECAST, BY COMPONENT, 2019-2035 (USD BILLIONS)
    106. CORRECTION UNITS MARKET SIZE ESTIMATES & FORECAST, BY END USE, 2019-2035 (USD
    107. BILLIONS)
    108. & FORECAST, BY REGIONAL, 2019-2035 (USD BILLIONS)
    109. FACTOR CORRECTION UNITS MARKET SIZE ESTIMATES & FORECAST, BY TYPE, 2019-2035
    110. (USD BILLIONS)
    111. & FORECAST, BY APPLICATION, 2019-2035 (USD BILLIONS)
    112. FACTOR CORRECTION UNITS MARKET SIZE ESTIMATES & FORECAST, BY COMPONENT, 2019-2035
    113. (USD BILLIONS)
    114. & FORECAST, BY END USE, 2019-2035 (USD BILLIONS)
    115. FACTOR CORRECTION UNITS MARKET SIZE ESTIMATES & FORECAST, BY REGIONAL, 2019-2035
    116. (USD BILLIONS)
    117. & FORECAST, BY TYPE, 2019-2035 (USD BILLIONS)
    118. CORRECTION UNITS MARKET SIZE ESTIMATES & FORECAST, BY APPLICATION, 2019-2035
    119. (USD BILLIONS)
    120. & FORECAST, BY COMPONENT, 2019-2035 (USD BILLIONS)
    121. FACTOR CORRECTION UNITS MARKET SIZE ESTIMATES & FORECAST, BY END USE, 2019-2035
    122. (USD BILLIONS)
    123. & FORECAST, BY REGIONAL, 2019-2035 (USD BILLIONS)
    124. POWER FACTOR CORRECTION UNITS MARKET SIZE ESTIMATES & FORECAST, BY TYPE, 2019-2035
    125. (USD BILLIONS)
    126. SIZE ESTIMATES & FORECAST, BY APPLICATION, 2019-2035 (USD BILLIONS)
    127. REST OF EUROPE POWER FACTOR CORRECTION UNITS MARKET SIZE ESTIMATES & FORECAST,
    128. BY COMPONENT, 2019-2035 (USD BILLIONS)
    129. CORRECTION UNITS MARKET SIZE ESTIMATES & FORECAST, BY END USE, 2019-2035 (USD
    130. BILLIONS)
    131. ESTIMATES & FORECAST, BY REGIONAL, 2019-2035 (USD BILLIONS)
    132. APAC POWER FACTOR CORRECTION UNITS MARKET SIZE ESTIMATES & FORECAST, BY TYPE,
    133. 2035 (USD BILLIONS)
    134. SIZE ESTIMATES & FORECAST, BY APPLICATION, 2019-2035 (USD BILLIONS)
    135. APAC POWER FACTOR CORRECTION UNITS MARKET SIZE ESTIMATES & FORECAST, BY
    136. COMPONENT, 2019-2035 (USD BILLIONS)
    137. UNITS MARKET SIZE ESTIMATES & FORECAST, BY END USE, 2019-2035 (USD BILLIONS)
    138. BY REGIONAL, 2019-2035 (USD BILLIONS)
    139. UNITS MARKET SIZE ESTIMATES & FORECAST, BY TYPE, 2019-2035 (USD BILLIONS)
    140. BY APPLICATION, 2019-2035 (USD BILLIONS)
    141. UNITS MARKET SIZE ESTIMATES & FORECAST, BY COMPONENT, 2019-2035 (USD BILLIONS)
    142. FORECAST, BY END USE, 2019-2035 (USD BILLIONS)
    143. CORRECTION UNITS MARKET SIZE ESTIMATES & FORECAST, BY REGIONAL, 2019-2035 (USD
    144. BILLIONS)
    145. & FORECAST, BY TYPE, 2019-2035 (USD BILLIONS)
    146. CORRECTION UNITS MARKET SIZE ESTIMATES & FORECAST, BY APPLICATION, 2019-2035
    147. (USD BILLIONS)
    148. & FORECAST, BY COMPONENT, 2019-2035 (USD BILLIONS)
    149. FACTOR CORRECTION UNITS MARKET SIZE ESTIMATES & FORECAST, BY END USE, 2019-2035
    150. (USD BILLIONS)
    151. & FORECAST, BY REGIONAL, 2019-2035 (USD BILLIONS)
    152. FACTOR CORRECTION UNITS MARKET SIZE ESTIMATES & FORECAST, BY TYPE, 2019-2035
    153. (USD BILLIONS)
    154. & FORECAST, BY APPLICATION, 2019-2035 (USD BILLIONS)
    155. FACTOR CORRECTION UNITS MARKET SIZE ESTIMATES & FORECAST, BY COMPONENT, 2019-2035
    156. (USD BILLIONS)
    157. & FORECAST, BY END USE, 2019-2035 (USD BILLIONS)
    158. FACTOR CORRECTION UNITS MARKET SIZE ESTIMATES & FORECAST, BY REGIONAL, 2019-2035
    159. (USD BILLIONS)
    160. SIZE ESTIMATES & FORECAST, BY TYPE, 2019-2035 (USD BILLIONS)
    161. SOUTH KOREA POWER FACTOR CORRECTION UNITS MARKET SIZE ESTIMATES & FORECAST,
    162. BY APPLICATION, 2019-2035 (USD BILLIONS)
    163. CORRECTION UNITS MARKET SIZE ESTIMATES & FORECAST, BY COMPONENT, 2019-2035 (USD
    164. BILLIONS)
    165. ESTIMATES & FORECAST, BY END USE, 2019-2035 (USD BILLIONS)
    166. KOREA POWER FACTOR CORRECTION UNITS MARKET SIZE ESTIMATES & FORECAST, BY REGIONAL,
    167. 2035 (USD BILLIONS)
    168. MARKET SIZE ESTIMATES & FORECAST, BY TYPE, 2019-2035 (USD BILLIONS)
    169. MALAYSIA POWER FACTOR CORRECTION UNITS MARKET SIZE ESTIMATES & FORECAST,
    170. BY APPLICATION, 2019-2035 (USD BILLIONS)
    171. UNITS MARKET SIZE ESTIMATES & FORECAST, BY COMPONENT, 2019-2035 (USD BILLIONS)
    172. FORECAST, BY END USE, 2019-2035 (USD BILLIONS)
    173. CORRECTION UNITS MARKET SIZE ESTIMATES & FORECAST, BY REGIONAL, 2019-2035 (USD
    174. BILLIONS)
    175. & FORECAST, BY TYPE, 2019-2035 (USD BILLIONS)
    176. FACTOR CORRECTION UNITS MARKET SIZE ESTIMATES & FORECAST, BY APPLICATION, 2019-2035
    177. (USD BILLIONS)
    178. ESTIMATES & FORECAST, BY COMPONENT, 2019-2035 (USD BILLIONS)
    179. THAILAND POWER FACTOR CORRECTION UNITS MARKET SIZE ESTIMATES & FORECAST, BY
    180. END USE, 2019-2035 (USD BILLIONS)
    181. UNITS MARKET SIZE ESTIMATES & FORECAST, BY REGIONAL, 2019-2035 (USD BILLIONS)
    182. FORECAST, BY TYPE, 2019-2035 (USD BILLIONS)
    183. CORRECTION UNITS MARKET SIZE ESTIMATES & FORECAST, BY APPLICATION, 2019-2035
    184. (USD BILLIONS)
    185. ESTIMATES & FORECAST, BY COMPONENT, 2019-2035 (USD BILLIONS)
    186. INDONESIA POWER FACTOR CORRECTION UNITS MARKET SIZE ESTIMATES & FORECAST, BY
    187. END USE, 2019-2035 (USD BILLIONS)
    188. UNITS MARKET SIZE ESTIMATES & FORECAST, BY REGIONAL, 2019-2035 (USD BILLIONS)
    189. & FORECAST, BY TYPE, 2019-2035 (USD BILLIONS)
    190. FACTOR CORRECTION UNITS MARKET SIZE ESTIMATES & FORECAST, BY APPLICATION, 2019-2035
    191. (USD BILLIONS)
    192. SIZE ESTIMATES & FORECAST, BY COMPONENT, 2019-2035 (USD BILLIONS)
    193. REST OF APAC POWER FACTOR CORRECTION UNITS MARKET SIZE ESTIMATES & FORECAST,
    194. BY END USE, 2019-2035 (USD BILLIONS)
    195. CORRECTION UNITS MARKET SIZE ESTIMATES & FORECAST, BY REGIONAL, 2019-2035 (USD
    196. BILLIONS)
    197. ESTIMATES & FORECAST, BY TYPE, 2019-2035 (USD BILLIONS)
    198. AMERICA POWER FACTOR CORRECTION UNITS MARKET SIZE ESTIMATES & FORECAST, BY APPLICATION,
    199. 2035 (USD BILLIONS)
    200. UNITS MARKET SIZE ESTIMATES & FORECAST, BY COMPONENT, 2019-2035 (USD BILLIONS)
    201. & FORECAST, BY END USE, 2019-2035 (USD BILLIONS)
    202. POWER FACTOR CORRECTION UNITS MARKET SIZE ESTIMATES & FORECAST, BY REGIONAL,
    203. 2035 (USD BILLIONS)
    204. SIZE ESTIMATES & FORECAST, BY TYPE, 2019-2035 (USD BILLIONS)
    205. BRAZIL POWER FACTOR CORRECTION UNITS MARKET SIZE ESTIMATES & FORECAST, BY APPLICATION,
    206. 2035 (USD BILLIONS)
    207. SIZE ESTIMATES & FORECAST, BY COMPONENT, 2019-2035 (USD BILLIONS)
    208. BRAZIL POWER FACTOR CORRECTION UNITS MARKET SIZE ESTIMATES & FORECAST,
    209. BY END USE, 2019-2035 (USD BILLIONS)
    210. UNITS MARKET SIZE ESTIMATES & FORECAST, BY REGIONAL, 2019-2035 (USD BILLIONS)
    211. FORECAST, BY TYPE, 2019-2035 (USD BILLIONS)
    212. CORRECTION UNITS MARKET SIZE ESTIMATES & FORECAST, BY APPLICATION, 2019-2035
    213. (USD BILLIONS)
    214. ESTIMATES & FORECAST, BY COMPONENT, 2019-2035 (USD BILLIONS)
    215. MEXICO POWER FACTOR CORRECTION UNITS MARKET SIZE ESTIMATES & FORECAST, BY END
    216. USE, 2019-2035 (USD BILLIONS)
    217. MARKET SIZE ESTIMATES & FORECAST, BY REGIONAL, 2019-2035 (USD BILLIONS)
    218. FORECAST, BY TYPE, 2019-2035 (USD BILLIONS)
    219. CORRECTION UNITS MARKET SIZE ESTIMATES & FORECAST, BY APPLICATION, 2019-2035
    220. (USD BILLIONS)
    221. ESTIMATES & FORECAST, BY COMPONENT, 2019-2035 (USD BILLIONS)
    222. ARGENTINA POWER FACTOR CORRECTION UNITS MARKET SIZE ESTIMATES & FORECAST, BY
    223. END USE, 2019-2035 (USD BILLIONS)
    224. UNITS MARKET SIZE ESTIMATES & FORECAST, BY REGIONAL, 2019-2035 (USD BILLIONS)
    225. ESTIMATES & FORECAST, BY TYPE, 2019-2035 (USD BILLIONS)
    226. OF SOUTH AMERICA POWER FACTOR CORRECTION UNITS MARKET SIZE ESTIMATES & FORECAST,
    227. BY APPLICATION, 2019-2035 (USD BILLIONS)
    228. POWER FACTOR CORRECTION UNITS MARKET SIZE ESTIMATES & FORECAST, BY COMPONENT,
    229. 2035 (USD BILLIONS)
    230. UNITS MARKET SIZE ESTIMATES & FORECAST, BY END USE, 2019-2035 (USD BILLIONS)
    231. ESTIMATES & FORECAST, BY REGIONAL, 2019-2035 (USD BILLIONS)
    232. MEA POWER FACTOR CORRECTION UNITS MARKET SIZE ESTIMATES & FORECAST, BY TYPE,
    233. 2035 (USD BILLIONS)
    234. SIZE ESTIMATES & FORECAST, BY APPLICATION, 2019-2035 (USD BILLIONS)
    235. MEA POWER FACTOR CORRECTION UNITS MARKET SIZE ESTIMATES & FORECAST, BY
    236. COMPONENT, 2019-2035 (USD BILLIONS)
    237. UNITS MARKET SIZE ESTIMATES & FORECAST, BY END USE, 2019-2035 (USD BILLIONS)
    238. BY REGIONAL, 2019-2035 (USD BILLIONS)
    239. CORRECTION UNITS MARKET SIZE ESTIMATES & FORECAST, BY TYPE, 2019-2035 (USD BILLIONS)
    240. & FORECAST, BY APPLICATION, 2019-2035 (USD BILLIONS)
    241. POWER FACTOR CORRECTION UNITS MARKET SIZE ESTIMATES & FORECAST, BY COMPONENT,
    242. 2035 (USD BILLIONS)
    243. UNITS MARKET SIZE ESTIMATES & FORECAST, BY END USE, 2019-2035 (USD BILLIONS)
    244. & FORECAST, BY REGIONAL, 2019-2035 (USD BILLIONS)
    245. POWER FACTOR CORRECTION UNITS MARKET SIZE ESTIMATES & FORECAST, BY TYPE, 2019-2035
    246. (USD BILLIONS)
    247. SIZE ESTIMATES & FORECAST, BY APPLICATION, 2019-2035 (USD BILLIONS)
    248. SOUTH AFRICA POWER FACTOR CORRECTION UNITS MARKET SIZE ESTIMATES & FORECAST,
    249. BY COMPONENT, 2019-2035 (USD BILLIONS)
    250. CORRECTION UNITS MARKET SIZE ESTIMATES & FORECAST, BY END USE, 2019-2035 (USD
    251. BILLIONS)
    252. ESTIMATES & FORECAST, BY REGIONAL, 2019-2035 (USD BILLIONS)
    253. REST OF MEA POWER FACTOR CORRECTION UNITS MARKET SIZE ESTIMATES & FORECAST,
    254. BY TYPE, 2019-2035 (USD BILLIONS)
    255. UNITS MARKET SIZE ESTIMATES & FORECAST, BY APPLICATION, 2019-2035 (USD BILLIONS)
    256. & FORECAST, BY COMPONENT, 2019-2035 (USD BILLIONS)
    257. MEA POWER FACTOR CORRECTION UNITS MARKET SIZE ESTIMATES & FORECAST, BY END USE,
    258. 2035 (USD BILLIONS)
    259. MARKET SIZE ESTIMATES & FORECAST, BY REGIONAL, 2019-2035 (USD BILLIONS)
    260. NORTH AMERICA POWER FACTOR CORRECTION UNITS MARKET ANALYSIS
    261. POWER FACTOR CORRECTION UNITS MARKET ANALYSIS BY TYPE
    262. CORRECTION UNITS MARKET ANALYSIS BY APPLICATION
    263. CORRECTION UNITS MARKET ANALYSIS BY COMPONENT
    264. UNITS MARKET ANALYSIS BY END USE
    265. MARKET ANALYSIS BY REGIONAL
    266. MARKET ANALYSIS BY TYPE
    267. ANALYSIS BY APPLICATION
    268. ANALYSIS BY COMPONENT
    269. ANALYSIS BY END USE
    270. ANALYSIS BY REGIONAL
    271. ANALYSIS
    272. BY TYPE
    273. APPLICATION
    274. BY COMPONENT
    275. BY END USE
    276. BY REGIONAL
    277. TYPE
    278. UK POWER FACTOR CORRECTION UNITS MARKET ANALYSIS BY REGIONAL
    279. FRANCE POWER FACTOR CORRECTION UNITS MARKET ANALYSIS BY TYPE
    280. POWER FACTOR CORRECTION UNITS MARKET ANALYSIS BY APPLICATION
    281. POWER FACTOR CORRECTION UNITS MARKET ANALYSIS BY COMPONENT
    282. POWER FACTOR CORRECTION UNITS MARKET ANALYSIS BY END USE
    283. POWER FACTOR CORRECTION UNITS MARKET ANALYSIS BY REGIONAL
    284. POWER FACTOR CORRECTION UNITS MARKET ANALYSIS BY TYPE
    285. FACTOR CORRECTION UNITS MARKET ANALYSIS BY APPLICATION
    286. FACTOR CORRECTION UNITS MARKET ANALYSIS BY COMPONENT
    287. FACTOR CORRECTION UNITS MARKET ANALYSIS BY END USE
    288. FACTOR CORRECTION UNITS MARKET ANALYSIS BY REGIONAL
    289. FACTOR CORRECTION UNITS MARKET ANALYSIS BY TYPE
    290. CORRECTION UNITS MARKET ANALYSIS BY APPLICATION
    291. CORRECTION UNITS MARKET ANALYSIS BY COMPONENT
    292. CORRECTION UNITS MARKET ANALYSIS BY END USE
    293. CORRECTION UNITS MARKET ANALYSIS BY REGIONAL
    294. CORRECTION UNITS MARKET ANALYSIS BY TYPE
    295. UNITS MARKET ANALYSIS BY APPLICATION
    296. UNITS MARKET ANALYSIS BY COMPONENT
    297. UNITS MARKET ANALYSIS BY END USE
    298. UNITS MARKET ANALYSIS BY REGIONAL
    299. UNITS MARKET ANALYSIS BY TYPE
    300. UNITS MARKET ANALYSIS BY APPLICATION
    301. CORRECTION UNITS MARKET ANALYSIS BY COMPONENT
    302. FACTOR CORRECTION UNITS MARKET ANALYSIS BY END USE
    303. POWER FACTOR CORRECTION UNITS MARKET ANALYSIS BY REGIONAL
    304. POWER FACTOR CORRECTION UNITS MARKET ANALYSIS
    305. CORRECTION UNITS MARKET ANALYSIS BY TYPE
    306. UNITS MARKET ANALYSIS BY APPLICATION
    307. UNITS MARKET ANALYSIS BY COMPONENT
    308. UNITS MARKET ANALYSIS BY END USE
    309. UNITS MARKET ANALYSIS BY REGIONAL
    310. UNITS MARKET ANALYSIS BY TYPE
    311. MARKET ANALYSIS BY APPLICATION
    312. MARKET ANALYSIS BY COMPONENT
    313. MARKET ANALYSIS BY END USE
    314. MARKET ANALYSIS BY REGIONAL
    315. MARKET ANALYSIS BY TYPE
    316. ANALYSIS BY APPLICATION
    317. ANALYSIS BY COMPONENT
    318. ANALYSIS BY END USE
    319. ANALYSIS BY REGIONAL
    320. MARKET ANALYSIS BY TYPE
    321. MARKET ANALYSIS BY APPLICATION
    322. UNITS MARKET ANALYSIS BY COMPONENT
    323. UNITS MARKET ANALYSIS BY END USE
    324. UNITS MARKET ANALYSIS BY REGIONAL
    325. UNITS MARKET ANALYSIS BY TYPE
    326. UNITS MARKET ANALYSIS BY APPLICATION
    327. UNITS MARKET ANALYSIS BY COMPONENT
    328. UNITS MARKET ANALYSIS BY END USE
    329. UNITS MARKET ANALYSIS BY REGIONAL
    330. UNITS MARKET ANALYSIS BY TYPE
    331. UNITS MARKET ANALYSIS BY APPLICATION
    332. UNITS MARKET ANALYSIS BY COMPONENT
    333. UNITS MARKET ANALYSIS BY END USE
    334. UNITS MARKET ANALYSIS BY REGIONAL
    335. UNITS MARKET ANALYSIS BY TYPE
    336. UNITS MARKET ANALYSIS BY APPLICATION
    337. UNITS MARKET ANALYSIS BY COMPONENT
    338. UNITS MARKET ANALYSIS BY END USE
    339. UNITS MARKET ANALYSIS BY REGIONAL
    340. UNITS MARKET ANALYSIS BY TYPE
    341. UNITS MARKET ANALYSIS BY APPLICATION
    342. CORRECTION UNITS MARKET ANALYSIS BY COMPONENT
    343. FACTOR CORRECTION UNITS MARKET ANALYSIS BY END USE
    344. POWER FACTOR CORRECTION UNITS MARKET ANALYSIS BY REGIONAL
    345. AMERICA POWER FACTOR CORRECTION UNITS MARKET ANALYSIS
    346. FACTOR CORRECTION UNITS MARKET ANALYSIS BY TYPE
    347. CORRECTION UNITS MARKET ANALYSIS BY APPLICATION
    348. CORRECTION UNITS MARKET ANALYSIS BY COMPONENT
    349. CORRECTION UNITS MARKET ANALYSIS BY END USE
    350. CORRECTION UNITS MARKET ANALYSIS BY REGIONAL
    351. CORRECTION UNITS MARKET ANALYSIS BY TYPE
    352. UNITS MARKET ANALYSIS BY APPLICATION
    353. UNITS MARKET ANALYSIS BY COMPONENT
    354. UNITS MARKET ANALYSIS BY END USE
    355. UNITS MARKET ANALYSIS BY REGIONAL
    356. UNITS MARKET ANALYSIS BY TYPE
    357. UNITS MARKET ANALYSIS BY APPLICATION
    358. UNITS MARKET ANALYSIS BY COMPONENT
    359. UNITS MARKET ANALYSIS BY END USE
    360. UNITS MARKET ANALYSIS BY REGIONAL
    361. FACTOR CORRECTION UNITS MARKET ANALYSIS BY TYPE
    362. AMERICA POWER FACTOR CORRECTION UNITS MARKET ANALYSIS BY APPLICATION
    363. REST OF SOUTH AMERICA POWER FACTOR CORRECTION UNITS MARKET ANALYSIS BY COMPONENT
    364. BY END USE
    365. MARKET ANALYSIS BY REGIONAL
    366. MARKET ANALYSIS
    367. ANALYSIS BY TYPE
    368. ANALYSIS BY APPLICATION
    369. UNITS MARKET ANALYSIS BY COMPONENT
    370. CORRECTION UNITS MARKET ANALYSIS BY END USE
    371. FACTOR CORRECTION UNITS MARKET ANALYSIS BY REGIONAL
    372. POWER FACTOR CORRECTION UNITS MARKET ANALYSIS BY TYPE
    373. POWER FACTOR CORRECTION UNITS MARKET ANALYSIS BY APPLICATION
    374. AFRICA POWER FACTOR CORRECTION UNITS MARKET ANALYSIS BY COMPONENT
    375. SOUTH AFRICA POWER FACTOR CORRECTION UNITS MARKET ANALYSIS BY END USE
    376. SOUTH AFRICA POWER FACTOR CORRECTION UNITS MARKET ANALYSIS BY REGIONAL
    377. USE
    378. BY REGIONAL
    379. MARKET
    380. OF POWER FACTOR CORRECTION UNITS MARKET
    381. POWER FACTOR CORRECTION UNITS MARKET
    382. POWER FACTOR CORRECTION UNITS MARKET
    383. FACTOR CORRECTION UNITS MARKET
    384. BY TYPE, 2024 (% SHARE)
    385. BY TYPE, 2019 TO 2035 (USD Billions)
    386. MARKET, BY APPLICATION, 2024 (% SHARE)
    387. UNITS MARKET, BY APPLICATION, 2019 TO 2035 (USD Billions)
    388. FACTOR CORRECTION UNITS MARKET, BY COMPONENT, 2024 (% SHARE)
    389. FACTOR CORRECTION UNITS MARKET, BY COMPONENT, 2019 TO 2035 (USD Billions)
    390. POWER FACTOR CORRECTION UNITS MARKET, BY END USE, 2024 (% SHARE)
    391. POWER FACTOR CORRECTION UNITS MARKET, BY END USE, 2019 TO 2035 (USD Billions)
    392. (USD Billions)

    Power Factor Correction Units Market Segmentation


    • Power Factor Correction Units Market By Type (USD Billion, 2019-2035)

      • Capacitor Banks
      • Synchronous Condensers
      • Active Power Filters
      • Static Var Compensators

    • Power Factor Correction Units Market By Application (USD Billion, 2019-2035)

      • Industrial
      • Commercial
      • Residential
      • Utilities

    • Power Factor Correction Units Market By Component (USD Billion, 2019-2035)

      • Fixed Capacitors
      • Automatic Capacitor Controllers
      • Power Factor Monitors

    • Power Factor Correction Units Market By End Use (USD Billion, 2019-2035)

      • Manufacturing
      • Data Centers
      • Telecommunications
      • Mining

    • Power Factor Correction Units Market By Regional (USD Billion, 2019-2035)

      • North America
      • Europe
      • South America
      • Asia Pacific
      • Middle East and Africa

    Power Factor Correction Units Market Regional Outlook (USD Billion, 2019-2035)


    • North America Outlook (USD Billion, 2019-2035)

      • North America Power Factor Correction Units Market by Type

        • Capacitor Banks
        • Synchronous Condensers
        • Active Power Filters
        • Static Var Compensators
      • North America Power Factor Correction Units Market by Application Type

        • Industrial
        • Commercial
        • Residential
        • Utilities
      • North America Power Factor Correction Units Market by Component Type

        • Fixed Capacitors
        • Automatic Capacitor Controllers
        • Power Factor Monitors
      • North America Power Factor Correction Units Market by End Use Type

        • Manufacturing
        • Data Centers
        • Telecommunications
        • Mining
      • North America Power Factor Correction Units Market by Regional Type

        • US
        • Canada
      • US Outlook (USD Billion, 2019-2035)
      • US Power Factor Correction Units Market by Type

        • Capacitor Banks
        • Synchronous Condensers
        • Active Power Filters
        • Static Var Compensators
      • US Power Factor Correction Units Market by Application Type

        • Industrial
        • Commercial
        • Residential
        • Utilities
      • US Power Factor Correction Units Market by Component Type

        • Fixed Capacitors
        • Automatic Capacitor Controllers
        • Power Factor Monitors
      • US Power Factor Correction Units Market by End Use Type

        • Manufacturing
        • Data Centers
        • Telecommunications
        • Mining
      • CANADA Outlook (USD Billion, 2019-2035)
      • CANADA Power Factor Correction Units Market by Type

        • Capacitor Banks
        • Synchronous Condensers
        • Active Power Filters
        • Static Var Compensators
      • CANADA Power Factor Correction Units Market by Application Type

        • Industrial
        • Commercial
        • Residential
        • Utilities
      • CANADA Power Factor Correction Units Market by Component Type

        • Fixed Capacitors
        • Automatic Capacitor Controllers
        • Power Factor Monitors
      • CANADA Power Factor Correction Units Market by End Use Type

        • Manufacturing
        • Data Centers
        • Telecommunications
        • Mining
    • Europe Outlook (USD Billion, 2019-2035)

      • Europe Power Factor Correction Units Market by Type

        • Capacitor Banks
        • Synchronous Condensers
        • Active Power Filters
        • Static Var Compensators
      • Europe Power Factor Correction Units Market by Application Type

        • Industrial
        • Commercial
        • Residential
        • Utilities
      • Europe Power Factor Correction Units Market by Component Type

        • Fixed Capacitors
        • Automatic Capacitor Controllers
        • Power Factor Monitors
      • Europe Power Factor Correction Units Market by End Use Type

        • Manufacturing
        • Data Centers
        • Telecommunications
        • Mining
      • Europe Power Factor Correction Units Market by Regional Type

        • Germany
        • UK
        • France
        • Russia
        • Italy
        • Spain
        • Rest of Europe
      • GERMANY Outlook (USD Billion, 2019-2035)
      • GERMANY Power Factor Correction Units Market by Type

        • Capacitor Banks
        • Synchronous Condensers
        • Active Power Filters
        • Static Var Compensators
      • GERMANY Power Factor Correction Units Market by Application Type

        • Industrial
        • Commercial
        • Residential
        • Utilities
      • GERMANY Power Factor Correction Units Market by Component Type

        • Fixed Capacitors
        • Automatic Capacitor Controllers
        • Power Factor Monitors
      • GERMANY Power Factor Correction Units Market by End Use Type

        • Manufacturing
        • Data Centers
        • Telecommunications
        • Mining
      • UK Outlook (USD Billion, 2019-2035)
      • UK Power Factor Correction Units Market by Type

        • Capacitor Banks
        • Synchronous Condensers
        • Active Power Filters
        • Static Var Compensators
      • UK Power Factor Correction Units Market by Application Type

        • Industrial
        • Commercial
        • Residential
        • Utilities
      • UK Power Factor Correction Units Market by Component Type

        • Fixed Capacitors
        • Automatic Capacitor Controllers
        • Power Factor Monitors
      • UK Power Factor Correction Units Market by End Use Type

        • Manufacturing
        • Data Centers
        • Telecommunications
        • Mining
      • FRANCE Outlook (USD Billion, 2019-2035)
      • FRANCE Power Factor Correction Units Market by Type

        • Capacitor Banks
        • Synchronous Condensers
        • Active Power Filters
        • Static Var Compensators
      • FRANCE Power Factor Correction Units Market by Application Type

        • Industrial
        • Commercial
        • Residential
        • Utilities
      • FRANCE Power Factor Correction Units Market by Component Type

        • Fixed Capacitors
        • Automatic Capacitor Controllers
        • Power Factor Monitors
      • FRANCE Power Factor Correction Units Market by End Use Type

        • Manufacturing
        • Data Centers
        • Telecommunications
        • Mining
      • RUSSIA Outlook (USD Billion, 2019-2035)
      • RUSSIA Power Factor Correction Units Market by Type

        • Capacitor Banks
        • Synchronous Condensers
        • Active Power Filters
        • Static Var Compensators
      • RUSSIA Power Factor Correction Units Market by Application Type

        • Industrial
        • Commercial
        • Residential
        • Utilities
      • RUSSIA Power Factor Correction Units Market by Component Type

        • Fixed Capacitors
        • Automatic Capacitor Controllers
        • Power Factor Monitors
      • RUSSIA Power Factor Correction Units Market by End Use Type

        • Manufacturing
        • Data Centers
        • Telecommunications
        • Mining
      • ITALY Outlook (USD Billion, 2019-2035)
      • ITALY Power Factor Correction Units Market by Type

        • Capacitor Banks
        • Synchronous Condensers
        • Active Power Filters
        • Static Var Compensators
      • ITALY Power Factor Correction Units Market by Application Type

        • Industrial
        • Commercial
        • Residential
        • Utilities
      • ITALY Power Factor Correction Units Market by Component Type

        • Fixed Capacitors
        • Automatic Capacitor Controllers
        • Power Factor Monitors
      • ITALY Power Factor Correction Units Market by End Use Type

        • Manufacturing
        • Data Centers
        • Telecommunications
        • Mining
      • SPAIN Outlook (USD Billion, 2019-2035)
      • SPAIN Power Factor Correction Units Market by Type

        • Capacitor Banks
        • Synchronous Condensers
        • Active Power Filters
        • Static Var Compensators
      • SPAIN Power Factor Correction Units Market by Application Type

        • Industrial
        • Commercial
        • Residential
        • Utilities
      • SPAIN Power Factor Correction Units Market by Component Type

        • Fixed Capacitors
        • Automatic Capacitor Controllers
        • Power Factor Monitors
      • SPAIN Power Factor Correction Units Market by End Use Type

        • Manufacturing
        • Data Centers
        • Telecommunications
        • Mining
      • REST OF EUROPE Outlook (USD Billion, 2019-2035)
      • REST OF EUROPE Power Factor Correction Units Market by Type

        • Capacitor Banks
        • Synchronous Condensers
        • Active Power Filters
        • Static Var Compensators
      • REST OF EUROPE Power Factor Correction Units Market by Application Type

        • Industrial
        • Commercial
        • Residential
        • Utilities
      • REST OF EUROPE Power Factor Correction Units Market by Component Type

        • Fixed Capacitors
        • Automatic Capacitor Controllers
        • Power Factor Monitors
      • REST OF EUROPE Power Factor Correction Units Market by End Use Type

        • Manufacturing
        • Data Centers
        • Telecommunications
        • Mining
    • APAC Outlook (USD Billion, 2019-2035)

      • APAC Power Factor Correction Units Market by Type

        • Capacitor Banks
        • Synchronous Condensers
        • Active Power Filters
        • Static Var Compensators
      • APAC Power Factor Correction Units Market by Application Type

        • Industrial
        • Commercial
        • Residential
        • Utilities
      • APAC Power Factor Correction Units Market by Component Type

        • Fixed Capacitors
        • Automatic Capacitor Controllers
        • Power Factor Monitors
      • APAC Power Factor Correction Units Market by End Use Type

        • Manufacturing
        • Data Centers
        • Telecommunications
        • Mining
      • APAC Power Factor Correction Units Market by Regional Type

        • China
        • India
        • Japan
        • South Korea
        • Malaysia
        • Thailand
        • Indonesia
        • Rest of APAC
      • CHINA Outlook (USD Billion, 2019-2035)
      • CHINA Power Factor Correction Units Market by Type

        • Capacitor Banks
        • Synchronous Condensers
        • Active Power Filters
        • Static Var Compensators
      • CHINA Power Factor Correction Units Market by Application Type

        • Industrial
        • Commercial
        • Residential
        • Utilities
      • CHINA Power Factor Correction Units Market by Component Type

        • Fixed Capacitors
        • Automatic Capacitor Controllers
        • Power Factor Monitors
      • CHINA Power Factor Correction Units Market by End Use Type

        • Manufacturing
        • Data Centers
        • Telecommunications
        • Mining
      • INDIA Outlook (USD Billion, 2019-2035)
      • INDIA Power Factor Correction Units Market by Type

        • Capacitor Banks
        • Synchronous Condensers
        • Active Power Filters
        • Static Var Compensators
      • INDIA Power Factor Correction Units Market by Application Type

        • Industrial
        • Commercial
        • Residential
        • Utilities
      • INDIA Power Factor Correction Units Market by Component Type

        • Fixed Capacitors
        • Automatic Capacitor Controllers
        • Power Factor Monitors
      • INDIA Power Factor Correction Units Market by End Use Type

        • Manufacturing
        • Data Centers
        • Telecommunications
        • Mining
      • JAPAN Outlook (USD Billion, 2019-2035)
      • JAPAN Power Factor Correction Units Market by Type

        • Capacitor Banks
        • Synchronous Condensers
        • Active Power Filters
        • Static Var Compensators
      • JAPAN Power Factor Correction Units Market by Application Type

        • Industrial
        • Commercial
        • Residential
        • Utilities
      • JAPAN Power Factor Correction Units Market by Component Type

        • Fixed Capacitors
        • Automatic Capacitor Controllers
        • Power Factor Monitors
      • JAPAN Power Factor Correction Units Market by End Use Type

        • Manufacturing
        • Data Centers
        • Telecommunications
        • Mining
      • SOUTH KOREA Outlook (USD Billion, 2019-2035)
      • SOUTH KOREA Power Factor Correction Units Market by Type

        • Capacitor Banks
        • Synchronous Condensers
        • Active Power Filters
        • Static Var Compensators
      • SOUTH KOREA Power Factor Correction Units Market by Application Type

        • Industrial
        • Commercial
        • Residential
        • Utilities
      • SOUTH KOREA Power Factor Correction Units Market by Component Type

        • Fixed Capacitors
        • Automatic Capacitor Controllers
        • Power Factor Monitors
      • SOUTH KOREA Power Factor Correction Units Market by End Use Type

        • Manufacturing
        • Data Centers
        • Telecommunications
        • Mining
      • MALAYSIA Outlook (USD Billion, 2019-2035)
      • MALAYSIA Power Factor Correction Units Market by Type

        • Capacitor Banks
        • Synchronous Condensers
        • Active Power Filters
        • Static Var Compensators
      • MALAYSIA Power Factor Correction Units Market by Application Type

        • Industrial
        • Commercial
        • Residential
        • Utilities
      • MALAYSIA Power Factor Correction Units Market by Component Type

        • Fixed Capacitors
        • Automatic Capacitor Controllers
        • Power Factor Monitors
      • MALAYSIA Power Factor Correction Units Market by End Use Type

        • Manufacturing
        • Data Centers
        • Telecommunications
        • Mining
      • THAILAND Outlook (USD Billion, 2019-2035)
      • THAILAND Power Factor Correction Units Market by Type

        • Capacitor Banks
        • Synchronous Condensers
        • Active Power Filters
        • Static Var Compensators
      • THAILAND Power Factor Correction Units Market by Application Type

        • Industrial
        • Commercial
        • Residential
        • Utilities
      • THAILAND Power Factor Correction Units Market by Component Type

        • Fixed Capacitors
        • Automatic Capacitor Controllers
        • Power Factor Monitors
      • THAILAND Power Factor Correction Units Market by End Use Type

        • Manufacturing
        • Data Centers
        • Telecommunications
        • Mining
      • INDONESIA Outlook (USD Billion, 2019-2035)
      • INDONESIA Power Factor Correction Units Market by Type

        • Capacitor Banks
        • Synchronous Condensers
        • Active Power Filters
        • Static Var Compensators
      • INDONESIA Power Factor Correction Units Market by Application Type

        • Industrial
        • Commercial
        • Residential
        • Utilities
      • INDONESIA Power Factor Correction Units Market by Component Type

        • Fixed Capacitors
        • Automatic Capacitor Controllers
        • Power Factor Monitors
      • INDONESIA Power Factor Correction Units Market by End Use Type

        • Manufacturing
        • Data Centers
        • Telecommunications
        • Mining
      • REST OF APAC Outlook (USD Billion, 2019-2035)
      • REST OF APAC Power Factor Correction Units Market by Type

        • Capacitor Banks
        • Synchronous Condensers
        • Active Power Filters
        • Static Var Compensators
      • REST OF APAC Power Factor Correction Units Market by Application Type

        • Industrial
        • Commercial
        • Residential
        • Utilities
      • REST OF APAC Power Factor Correction Units Market by Component Type

        • Fixed Capacitors
        • Automatic Capacitor Controllers
        • Power Factor Monitors
      • REST OF APAC Power Factor Correction Units Market by End Use Type

        • Manufacturing
        • Data Centers
        • Telecommunications
        • Mining
    • South America Outlook (USD Billion, 2019-2035)

      • South America Power Factor Correction Units Market by Type

        • Capacitor Banks
        • Synchronous Condensers
        • Active Power Filters
        • Static Var Compensators
      • South America Power Factor Correction Units Market by Application Type

        • Industrial
        • Commercial
        • Residential
        • Utilities
      • South America Power Factor Correction Units Market by Component Type

        • Fixed Capacitors
        • Automatic Capacitor Controllers
        • Power Factor Monitors
      • South America Power Factor Correction Units Market by End Use Type

        • Manufacturing
        • Data Centers
        • Telecommunications
        • Mining
      • South America Power Factor Correction Units Market by Regional Type

        • Brazil
        • Mexico
        • Argentina
        • Rest of South America
      • BRAZIL Outlook (USD Billion, 2019-2035)
      • BRAZIL Power Factor Correction Units Market by Type

        • Capacitor Banks
        • Synchronous Condensers
        • Active Power Filters
        • Static Var Compensators
      • BRAZIL Power Factor Correction Units Market by Application Type

        • Industrial
        • Commercial
        • Residential
        • Utilities
      • BRAZIL Power Factor Correction Units Market by Component Type

        • Fixed Capacitors
        • Automatic Capacitor Controllers
        • Power Factor Monitors
      • BRAZIL Power Factor Correction Units Market by End Use Type

        • Manufacturing
        • Data Centers
        • Telecommunications
        • Mining
      • MEXICO Outlook (USD Billion, 2019-2035)
      • MEXICO Power Factor Correction Units Market by Type

        • Capacitor Banks
        • Synchronous Condensers
        • Active Power Filters
        • Static Var Compensators
      • MEXICO Power Factor Correction Units Market by Application Type

        • Industrial
        • Commercial
        • Residential
        • Utilities
      • MEXICO Power Factor Correction Units Market by Component Type

        • Fixed Capacitors
        • Automatic Capacitor Controllers
        • Power Factor Monitors
      • MEXICO Power Factor Correction Units Market by End Use Type

        • Manufacturing
        • Data Centers
        • Telecommunications
        • Mining
      • ARGENTINA Outlook (USD Billion, 2019-2035)
      • ARGENTINA Power Factor Correction Units Market by Type

        • Capacitor Banks
        • Synchronous Condensers
        • Active Power Filters
        • Static Var Compensators
      • ARGENTINA Power Factor Correction Units Market by Application Type

        • Industrial
        • Commercial
        • Residential
        • Utilities
      • ARGENTINA Power Factor Correction Units Market by Component Type

        • Fixed Capacitors
        • Automatic Capacitor Controllers
        • Power Factor Monitors
      • ARGENTINA Power Factor Correction Units Market by End Use Type

        • Manufacturing
        • Data Centers
        • Telecommunications
        • Mining
      • REST OF SOUTH AMERICA Outlook (USD Billion, 2019-2035)
      • REST OF SOUTH AMERICA Power Factor Correction Units Market by Type

        • Capacitor Banks
        • Synchronous Condensers
        • Active Power Filters
        • Static Var Compensators
      • REST OF SOUTH AMERICA Power Factor Correction Units Market by Application Type

        • Industrial
        • Commercial
        • Residential
        • Utilities
      • REST OF SOUTH AMERICA Power Factor Correction Units Market by Component Type

        • Fixed Capacitors
        • Automatic Capacitor Controllers
        • Power Factor Monitors
      • REST OF SOUTH AMERICA Power Factor Correction Units Market by End Use Type

        • Manufacturing
        • Data Centers
        • Telecommunications
        • Mining
    • MEA Outlook (USD Billion, 2019-2035)

      • MEA Power Factor Correction Units Market by Type

        • Capacitor Banks
        • Synchronous Condensers
        • Active Power Filters
        • Static Var Compensators
      • MEA Power Factor Correction Units Market by Application Type

        • Industrial
        • Commercial
        • Residential
        • Utilities
      • MEA Power Factor Correction Units Market by Component Type

        • Fixed Capacitors
        • Automatic Capacitor Controllers
        • Power Factor Monitors
      • MEA Power Factor Correction Units Market by End Use Type

        • Manufacturing
        • Data Centers
        • Telecommunications
        • Mining
      • MEA Power Factor Correction Units Market by Regional Type

        • GCC Countries
        • South Africa
        • Rest of MEA
      • GCC COUNTRIES Outlook (USD Billion, 2019-2035)
      • GCC COUNTRIES Power Factor Correction Units Market by Type

        • Capacitor Banks
        • Synchronous Condensers
        • Active Power Filters
        • Static Var Compensators
      • GCC COUNTRIES Power Factor Correction Units Market by Application Type

        • Industrial
        • Commercial
        • Residential
        • Utilities
      • GCC COUNTRIES Power Factor Correction Units Market by Component Type

        • Fixed Capacitors
        • Automatic Capacitor Controllers
        • Power Factor Monitors
      • GCC COUNTRIES Power Factor Correction Units Market by End Use Type

        • Manufacturing
        • Data Centers
        • Telecommunications
        • Mining
      • SOUTH AFRICA Outlook (USD Billion, 2019-2035)
      • SOUTH AFRICA Power Factor Correction Units Market by Type

        • Capacitor Banks
        • Synchronous Condensers
        • Active Power Filters
        • Static Var Compensators
      • SOUTH AFRICA Power Factor Correction Units Market by Application Type

        • Industrial
        • Commercial
        • Residential
        • Utilities
      • SOUTH AFRICA Power Factor Correction Units Market by Component Type

        • Fixed Capacitors
        • Automatic Capacitor Controllers
        • Power Factor Monitors
      • SOUTH AFRICA Power Factor Correction Units Market by End Use Type

        • Manufacturing
        • Data Centers
        • Telecommunications
        • Mining
      • REST OF MEA Outlook (USD Billion, 2019-2035)
      • REST OF MEA Power Factor Correction Units Market by Type

        • Capacitor Banks
        • Synchronous Condensers
        • Active Power Filters
        • Static Var Compensators
      • REST OF MEA Power Factor Correction Units Market by Application Type

        • Industrial
        • Commercial
        • Residential
        • Utilities
      • REST OF MEA Power Factor Correction Units Market by Component Type

        • Fixed Capacitors
        • Automatic Capacitor Controllers
        • Power Factor Monitors
      • REST OF MEA Power Factor Correction Units Market by End Use Type

        • Manufacturing
        • Data Centers
        • Telecommunications
        • Mining


    Report Infographic
    Free Sample Request

    Kindly complete the form below to receive a free sample of this Report

    Customer Strories

    “I am very pleased with how market segments have been defined in a relevant way for my purposes (such as "Portable Freezers & refrigerators" and "last-mile"). In general the report is well structured. Thanks very much for your efforts.”

    Victoria Milne Founder
    Case Study

    Chemicals and Materials