×
Hero Background
English
Chinese
French
Japanese
Korean
German
Spanish

Portable Filtration System Market Size

ID: MRFR/Equip/7207-HCR
111 Pages
Anshula Mandaokar
October 2025

Portable Filtration System Market Research Report By Flow rate (0-10 GPM, >10-20 GPM, >20-60 GPM, >60-100 GPM, Above 100 GPM), Technology (Pressure Filtration, Centrifugal Filtration, and Vacuum Filtration), End-User (Power Generation, Manufacturing, Oil & Gas, Paper & Pulp, Petrochemicals, and others) and Region (North America, Europe, Asia-Pacific, Middle East & Africa and South America) - Forecast till 2035

Share:
Download PDF ×

We do not share your information with anyone. However, we may send you emails based on your report interest from time to time. You may contact us at any time to opt-out.

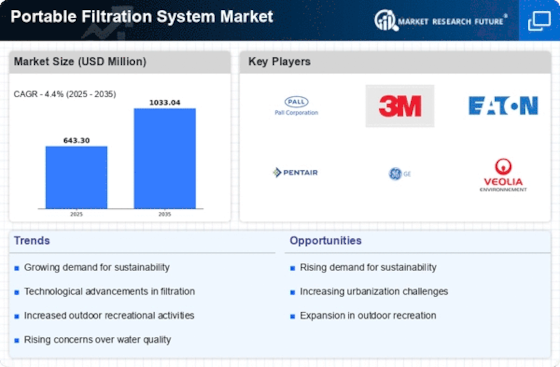
Portable Filtration System Market Infographic
Purchase Options

Portable Filtration System Size

Portable Filtration System Market Growth Projections and Opportunities

The market expanding industrial sector also influences the increasing global demand for portable filtration systems. The Portable Filtration System industry is determined by a plethora of factors, which collectively determine its growth, trends, and overall performance. One driving factor behind the expansion of this market is because of the increasing awareness and care for water quality from different sectors. Technological advances have also significantly impacted the portable filtration system market. Furthermore, strict environmental laws, as well as an increased emphasis on sustainability, have led to the adoption of portable filtration systems. The utilization of these systems has increased in industries such as camping, outdoor activities, and emergency preparedness as consumers place more importance on eco-friendly and sustainable products. Manufacturers are responding to this shift by using materials that are friendly to the environment and processes that are in sync with wider sustainability aspirations. Global economic factors also play a crucial role in shaping dynamics within the portable filtration system market. Economic stability and level of disposable income affect consumer spending patterns, hence influencing the rate at which they adopt portable filtration systems. In this case, competition dynamics among companies in the field are characterized by an increased number of players vying for market share. The presence of both established firms and budding start-ups encourages innovation and rivalry among them. Product differentiation strategies, pricing strategies, or expanding into new regions tend to be used by market players to gain a competitive advantage over their rivals. Collaborations with distributors and retailers are other common approaches adopted to increase sales volume. Consumer preferences and behaviors represent vital aspects that shape demand patterns for portable filtration systems (PFS). There is an emerging trend where people engage more in outdoor activities, traveling, or any form of recreational pursuits, leading to higher demand for portable solutions that ensure clean water access under various circumstances. However, some challenges persist, including standardization problems relating to products sold there. Counterfeit goods may also exist in this area, which creates obstacles to further development due to a lack of trust among customers themselves. Ensuring the reliability and efficiency of PFS is crucial to gaining customer loyalty. To summarize, technological advancements, environmental considerations, economic conditions, competition, and evolving consumer preferences are all part of the market dynamics that characterize the Portable Filtration System industry.
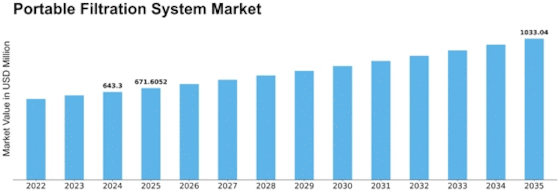
Portable Filtration System Market Size Graph
Author
Anshula Mandaokar
Team Lead - Research

Anshula Mandaokar holds an academic degree in Chemical Engineering and has been contributing to the field for more than 5 years. She has expertise in Market Research and Business Consulting and serves as a Team Lead for a reputed Market Research firm under the Chemicals and Materials domain spectrum. She has worked on multiple projects, generating explicit results in a quick turnaround time. Her understanding of data interpretation justifies her role as a leader.

Leave a Comment

FAQs

What is the projected market valuation for the Portable Filtration System Market in 2035?

The Portable Filtration System Market is projected to reach a valuation of 1,033.04 USD Million by 2035.

What was the market valuation for the Portable Filtration System Market in 2024?

In 2024, the Portable Filtration System Market was valued at 643.3 USD Million.

What is the expected CAGR for the Portable Filtration System Market from 2025 to 2035?

The expected CAGR for the Portable Filtration System Market during the forecast period 2025 - 2035 is 4.4%.

Which technology segment had the highest valuation in 2024?

In 2024, the Pressure filtration segment had the highest valuation at 257.32 USD Million.

What are the projected valuations for the 20-60 GPM flow type segment by 2035?

The 20-60 GPM flow type segment is projected to reach a valuation of 320.0 USD Million by 2035.

Market Summary

As per MRFR analysis, the Portable Filtration System Market Size was estimated at 643.3 USD Million in 2024. The Portable Filtration System industry is projected to grow from 671.61 USD Million in 2025 to 1033.04 USD Million by 2035, exhibiting a compound annual growth rate (CAGR) of 4.4 during the forecast period 2025 - 2035.

Key Market Trends & Highlights

The Portable Filtration System Market is experiencing robust growth driven by environmental awareness and technological advancements.

  • North America remains the largest market for portable filtration systems, reflecting a strong demand for clean water solutions. The Asia-Pacific region is emerging as the fastest-growing market, fueled by increasing outdoor activities and health consciousness. Centrifugal filtration systems dominate the market, while pressure filtration systems are witnessing rapid growth due to technological innovations. Key market drivers include the rising demand for clean water solutions and regulatory support for water quality standards.

Market Size & Forecast

2024 Market Size 643.3 (USD Million)
2035 Market Size 1033.04 (USD Million)
CAGR (2025 - 2035) 4.4%
Largest Regional Market Share in 2024 Asia Pacific

Major Players

<p>Pall Corporation (US), 3M Company (US), Eaton Corporation (US), Pentair plc (GB), GE Water &amp; Process Technologies (US), Veolia Environnement S.A. (FR), Xylem Inc. (US), Aquatech International LLC (US), Filtration Group Corporation (US)</p>

Market Trends

The Portable Filtration System Market is currently experiencing a notable transformation, driven by increasing awareness regarding water quality and the necessity for clean drinking water. This market encompasses a variety of filtration technologies, including activated carbon, reverse osmosis, and UV purification systems. As consumers become more conscious of health and environmental issues, the demand for portable filtration solutions is likely to rise. Furthermore, the growing trend of outdoor activities and travel is propelling the need for compact and efficient filtration systems that can be easily transported. In addition, advancements in technology are enhancing the performance and efficiency of portable filtration systems. Manufacturers are focusing on developing innovative products that are not only effective but also user-friendly. The integration of smart technology into filtration systems appears to be a growing trend, allowing users to monitor water quality in real-time. As the Portable Filtration System Market continues to evolve, it is essential for stakeholders to stay informed about emerging technologies and consumer preferences to remain competitive in this dynamic landscape.

Rising Environmental Awareness

There is a growing recognition of the importance of sustainable practices, which is influencing consumer choices in the Portable Filtration System Market. Individuals are increasingly seeking eco-friendly solutions that minimize plastic waste and promote responsible consumption.

Technological Advancements

Innovations in filtration technology are shaping the Portable Filtration System Market. Enhanced filtration methods, such as advanced membrane technologies and smart monitoring systems, are being developed to improve efficiency and user experience.

Increased Outdoor Activities

The surge in outdoor recreational activities is driving demand for portable filtration systems. As more individuals engage in camping, hiking, and travel, the need for reliable and convenient water purification solutions is becoming more pronounced.

Portable Filtration System Market Market Drivers

Increased Focus on Health and Wellness

The Portable Filtration System Market is benefiting from a heightened focus on health and wellness among consumers. As individuals become more health-conscious, the demand for clean and safe drinking water has escalated. This trend is particularly evident in urban areas where water quality may be compromised. Portable filtration systems provide a convenient solution for ensuring access to safe drinking water, aligning with the health and wellness movement. Market Research Future suggests that consumers are increasingly willing to invest in portable filtration systems as part of their lifestyle choices. This shift towards prioritizing health and wellness is likely to drive sustained growth in the Portable Filtration System Market, as more individuals seek reliable solutions for their hydration needs.

Growth in Outdoor Recreation Activities

The Portable Filtration System Market is experiencing growth fueled by the rising popularity of outdoor recreation activities. As more individuals engage in camping, hiking, and other outdoor pursuits, the need for portable water filtration solutions becomes increasingly apparent. Market data indicates that the outdoor recreation sector has seen a significant increase in participation rates, with millions of people seeking adventure in nature. Portable filtration systems offer a practical means for outdoor enthusiasts to access clean water, thereby enhancing their overall experience. This trend is likely to continue, as the desire for outdoor activities remains strong. Consequently, the Portable Filtration System Market is poised for growth, driven by the expanding outdoor recreation market.

Rising Demand for Clean Water Solutions

The Portable Filtration System Market is experiencing a notable surge in demand for clean water solutions. This trend is largely driven by increasing concerns over water quality and safety. As populations grow and urbanization accelerates, the pressure on existing water resources intensifies. According to recent data, approximately 2 billion people lack access to safe drinking water, highlighting the urgent need for effective filtration systems. Portable filtration systems offer a practical solution for individuals and communities seeking immediate access to clean water. Furthermore, the rise in natural disasters and climate change impacts has led to a greater emphasis on emergency preparedness, further propelling the demand for portable filtration systems. This growing awareness and necessity for clean water solutions are likely to sustain the momentum of the Portable Filtration System Market in the coming years.

Regulatory Support for Water Quality Standards

The Portable Filtration System Market is also influenced by regulatory support aimed at improving water quality standards. Governments and regulatory bodies are increasingly recognizing the importance of access to clean water, leading to the implementation of stricter regulations on water quality. This regulatory environment encourages the adoption of portable filtration systems as a viable solution for ensuring safe drinking water. Market data suggests that regions with stringent water quality regulations are witnessing a rise in the adoption of portable filtration technologies. As these regulations continue to evolve, the Portable Filtration System Market is likely to benefit from increased demand for compliant filtration solutions, further driving market growth.

Technological Innovations in Filtration Systems

Technological advancements are playing a pivotal role in shaping the Portable Filtration System Market. Innovations in filtration technology, such as the development of advanced membrane filters and UV purification systems, are enhancing the efficiency and effectiveness of portable filtration solutions. These innovations not only improve the quality of filtered water but also reduce the time and effort required for filtration. Market data indicates that the introduction of smart filtration systems, which can monitor water quality in real-time, is gaining traction among consumers. This integration of technology into portable filtration systems is likely to attract a broader customer base, including outdoor enthusiasts and emergency responders. As technology continues to evolve, the Portable Filtration System Market is expected to witness significant growth driven by these advancements.

Market Segment Insights

By Technology: Centrifugal Filtration (Largest) vs. Pressure Filtration (Fastest-Growing)

<p>In the Portable Filtration System Market, Centrifugal Filtration remains the largest segment, holding a substantial share due to its efficiency in separating various materials. This segment is particularly favored in industries requiring high-speed filtration processes, like chemicals and waste management. Conversely, Pressure Filtration is gaining momentum as the fastest-growing segment, attributed to increasing demands for process optimization and efficiency in different applications, including wastewater treatment and food processing. The growth trends demonstrate that businesses are leaning towards advanced filtration technologies that enhance productivity while maintaining cost efficiency. As regulations become stricter and sustainability concerns rise, both segments are likely to evolve, with Pressure Filtration expected to witness significant advancements in design and function to meet diverse industrial needs.</p>

<p>Technology: Centrifugal Filtration (Dominant) vs. Pressure Filtration (Emerging)</p>

<p>Centrifugal Filtration is the most dominant technology in the Portable Filtration System Market, recognized for its ability to deliver high-performance filtration in an array of applications. Its high efficiency in separating solids from liquids makes it ideal for heavy-duty industrial uses. On the other hand, Pressure Filtration stands out as an emerging technology, catching the attention of industries seeking to optimize their processes. This method is particularly noted for its ability to handle complex filtration requirements with improved speed and reliability. As manufacturers continue to innovate, Pressure Filtration is expected to carve out a larger market share, leveraging advancements in materials and design to enhance its competitiveness against established technologies like Centrifugal Filtration.</p>

By Flow Type: 60-100 GPM (Largest) vs. 20-60 GPM (Fastest-Growing)

<p>In the Portable Filtration System Market, the flow type segment showcases a distinct share among its categorization. The 60-100 GPM segment stands out as the largest, dominating the market landscape with its robust performance, catering to heavy-duty applications that require high filtration rates. Contrastingly, the 20-60 GPM segment is rapidly gaining traction, driven by an increasing demand for mid-range filtration solutions in various industrial sectors, indicating a significant shift towards flexibility and efficiency in filtration systems.</p>

<p>Flow Rate: 60-100 GPM (Dominant) vs. 10-20 GPM (Emerging)</p>

<p>The 60-100 GPM segment asserts itself as a dominant player within the Portable Filtration System Market, typically utilized in scenarios demanding high filtration capabilities, such as large-scale industrial operations and municipal applications. This segment is characterized by its ability to deliver rapid processing times and exceptional filtration efficiency, fulfilling the criteria for various stringent industry standards. On the other hand, the 10-20 GPM segment represents an emerging solution primarily targeted at smaller operations and niche applications, where portability and cost-effectiveness are vital. As industries evolve, the demand for compact and efficient filtration systems like this is steadily increasing, highlighting the adaptability of the market in addressing diverse operational needs.</p>

By End User: Oil and Gas (Largest) vs. Power Generation (Fastest-Growing)

<p>The Portable Filtration System Market is primarily dominated by the Oil and Gas sector, which significantly contributes to the market share. This sector’s reliance on advanced filtration technology for various applications, including process water treatment and equipment life extension, solidifies its position as the largest end-user segment. In contrast, the Power Generation sector is on an impressive growth trajectory, increasingly adopting portable filtration systems to improve operational efficiency and adhere to stringent environmental regulations, making it a vital player in this market.</p>

<p>Oil and Gas (Dominant) vs. Power Generation (Emerging)</p>

<p>The Oil and Gas sector remains a dominant force within the Portable Filtration System Market, driven by its critical need for reliable filtration in drilling, refining, and water management processes. Companies in this sector leverage portable filtration systems to enhance productivity while minimizing environmental impact. On the other hand, the Power Generation sector is emerging as a key player, as the adoption of portable filtration technology grows to meet the demand for cleaner energy production. This segment's focus on sustainability and operational resilience has fueled investments in portable filtration solutions, positioning it for rapid growth in the coming years. These two segments reflect the diverse applications and critical importance of filtration systems, ensuring their pivotal role in industrial operations.</p>

Get more detailed insights about Portable Filtration System Market Research Report - Global Forecast till 2035

Regional Insights

North America : Innovation and Demand Surge

North America is the largest market for portable filtration systems, holding approximately 40% of the global market share. The region's growth is driven by increasing awareness of water quality, stringent environmental regulations, and a rising demand for portable solutions in both industrial and residential sectors. The U.S. is the primary contributor, followed by Canada, which is experiencing a surge in demand due to its focus on sustainable water management practices. The competitive landscape in North America is robust, featuring key players such as Pall Corporation, 3M Company, and Eaton Corporation. These companies are investing heavily in R&D to innovate and enhance their product offerings. The presence of advanced manufacturing facilities and a strong distribution network further solidifies the region's leadership in the portable filtration market. The focus on regulatory compliance and sustainability is expected to drive future growth.

Europe : Regulatory-Driven Market Growth

Europe is witnessing significant growth in the portable filtration system market, accounting for approximately 30% of the global share. The region's expansion is largely fueled by stringent EU regulations on water quality and environmental protection, which mandate the use of advanced filtration technologies. Countries like Germany and France are leading the market, driven by their commitment to sustainability and innovation in water treatment solutions. The competitive landscape in Europe is characterized by the presence of major players such as Veolia Environnement and Pentair. These companies are focusing on developing eco-friendly filtration systems that comply with EU regulations. The market is also seeing increased collaboration between public and private sectors to enhance water quality standards. This regulatory framework is expected to further propel the demand for portable filtration systems across the region.

Asia-Pacific : Emerging Market Potential

Asia-Pacific is emerging as a significant player in the portable filtration system market, holding around 20% of the global market share. The region's growth is driven by rapid urbanization, industrialization, and increasing awareness of waterborne diseases. Countries like China and India are at the forefront, with substantial investments in water treatment infrastructure and portable filtration solutions to address their growing population's needs. The competitive landscape in Asia-Pacific is evolving, with both local and international players vying for market share. Companies such as Xylem Inc. and Aquatech International are expanding their operations in the region, focusing on innovative and cost-effective filtration solutions. The increasing government initiatives to improve water quality and accessibility are expected to further boost market growth in this dynamic region.

Middle East and Africa : Resource Management Challenges

The Middle East and Africa region is experiencing a growing demand for portable filtration systems, accounting for approximately 10% of the global market share. This growth is primarily driven by water scarcity issues and the need for efficient water management solutions. Countries like South Africa and the UAE are leading the charge, implementing policies to enhance water quality and accessibility in response to their unique environmental challenges. The competitive landscape in this region is characterized by a mix of local and international players, including Filtration Group Corporation. The focus is on developing affordable and efficient filtration technologies that cater to the specific needs of the region. Government initiatives aimed at improving water infrastructure and sustainability practices are expected to further stimulate market growth, making this region a key area for future investments in portable filtration systems.

Key Companies in the Portable Filtration System Market market include

Industry Developments

  • The new and durable range of portable filtration system is launched in many regions. This portable-filtration system aroused to prevent cholera. Many countries around the world suffer from cholera that is caused by dirty and unclean water. The new range of portable filters can provide clean and healthy water to individuals. 
  • The key players of the market are giving away filtration systems for charity. The key players are contributing the suite for churches and other crucial places.

Future Outlook

Portable Filtration System Market Future Outlook

<p>The Portable Filtration System Market is projected to grow at a 4.4% CAGR from 2024 to 2035, driven by increasing demand for clean water and portable solutions.</p>

New opportunities lie in:

  • <p>Expansion into emerging markets with tailored filtration solutions.</p><p>Development of smart filtration systems integrated with IoT technology.</p><p>Partnerships with outdoor and recreational brands for co-branded products.</p>

<p>By 2035, the market is expected to be robust, reflecting sustained growth and innovation.</p>

Market Segmentation

Portable Filtration System Market End User Outlook

  • Paper and pulp
  • Manufacturing
  • Power generation
  • Petrochemicals
  • Oil and gas

Portable Filtration System Market Flow Type Outlook

  • 60-100 GPM
  • 20-60 GPM
  • 10-20 GPM
  • 0-10 GPM

Portable Filtration System Market Technology Outlook

  • Centrifugal filtration
  • Pressure filtration
  • Vacuum filtration

Report Scope

MARKET SIZE 2024643.3(USD Million)
MARKET SIZE 2025671.61(USD Million)
MARKET SIZE 20351033.04(USD Million)
COMPOUND ANNUAL GROWTH RATE (CAGR)4.4% (2024 - 2035)
REPORT COVERAGERevenue Forecast, Competitive Landscape, Growth Factors, and Trends
BASE YEAR2024
Market Forecast Period2025 - 2035
Historical Data2019 - 2024
Market Forecast UnitsUSD Million
Key Companies ProfiledMarket analysis in progress
Segments CoveredMarket segmentation analysis in progress
Key Market OpportunitiesGrowing demand for sustainable water solutions drives innovation in the Portable Filtration System Market.
Key Market DynamicsRising consumer demand for portable filtration systems drives innovation and competition among manufacturers in diverse applications.
Countries CoveredNorth America, Europe, APAC, South America, MEA

FAQs

What is the projected market valuation for the Portable Filtration System Market in 2035?

The Portable Filtration System Market is projected to reach a valuation of 1,033.04 USD Million by 2035.

What was the market valuation for the Portable Filtration System Market in 2024?

In 2024, the Portable Filtration System Market was valued at 643.3 USD Million.

What is the expected CAGR for the Portable Filtration System Market from 2025 to 2035?

The expected CAGR for the Portable Filtration System Market during the forecast period 2025 - 2035 is 4.4%.

Which technology segment had the highest valuation in 2024?

In 2024, the Pressure filtration segment had the highest valuation at 257.32 USD Million.

What are the projected valuations for the 20-60 GPM flow type segment by 2035?

The 20-60 GPM flow type segment is projected to reach a valuation of 320.0 USD Million by 2035.

  1. SECTION I: EXECUTIVE SUMMARY AND KEY HIGHLIGHTS
    1. EXECUTIVE SUMMARY
      1. Market Overview
      2. Key Findings
      3. Market Segmentation
      4. Competitive Landscape
      5. Challenges and Opportunities
      6. Future Outlook 2
  2. SECTION II: SCOPING, METHODOLOGY AND MARKET STRUCTURE
    1. MARKET INTRODUCTION
      1. Definition
      2. Scope of the study
    2. RESEARCH METHODOLOGY
      1. Overview
      2. Data Mining
      3. Secondary Research
      4. Primary Research
      5. Forecasting Model
      6. Market Size Estimation
      7. Data Triangulation
      8. Validation 3
  3. SECTION III: QUALITATIVE ANALYSIS
    1. MARKET DYNAMICS
      1. Overview
      2. Drivers
      3. Restraints
      4. Opportunities
    2. MARKET FACTOR ANALYSIS
      1. Value chain Analysis
      2. Porter's Five Forces Analysis
      3. COVID-19 Impact Analysis
  4. SECTION IV: QUANTITATIVE ANALYSIS
    1. Chemicals and Materials, BY Technology (USD Million)
      1. Centrifugal filtration
      2. Pressure filtration
      3. Vacuum filtration
    2. Chemicals and Materials, BY Flow Type (USD Million)
      1. 60-100 GPM
      2. 20-60 GPM
      3. 10-20 GPM
      4. 0-10 GPM
    3. Chemicals and Materials, BY End User (USD Million)
      1. Paper and pulp
      2. Manufacturing
      3. Power generation
      4. Petrochemicals
      5. Oil and gas
    4. Chemicals and Materials, BY Region (USD Million)
      1. North America
      2. Europe
      3. APAC
      4. South America
      5. MEA
  5. SECTION V: COMPETITIVE ANALYSIS
    1. Competitive Landscape
      1. Overview
      2. Competitive Analysis
      3. Market share Analysis
      4. Major Growth Strategy in the Chemicals and Materials
      5. Competitive Benchmarking
      6. Leading Players in Terms of Number of Developments in the Chemicals and Materials
      7. Key developments and growth strategies
      8. Major Players Financial Matrix
    2. Company Profiles
      1. Pall Corporation (US)
      2. 3M Company (US)
      3. Eaton Corporation (US)
      4. Pentair plc (GB)
      5. GE Water & Process Technologies (US)
      6. Veolia Environnement S.A. (FR)
      7. Xylem Inc. (US)
      8. Aquatech International LLC (US)
      9. Filtration Group Corporation (US)
    3. Appendix
      1. References
      2. Related Reports 6 LIST OF FIGURES
    4. MARKET SYNOPSIS
    5. NORTH AMERICA MARKET ANALYSIS
    6. US MARKET ANALYSIS BY TECHNOLOGY
    7. US MARKET ANALYSIS BY FLOW TYPE
    8. US MARKET ANALYSIS BY END USER
    9. CANADA MARKET ANALYSIS BY TECHNOLOGY
    10. CANADA MARKET ANALYSIS BY FLOW TYPE
    11. CANADA MARKET ANALYSIS BY END USER
    12. EUROPE MARKET ANALYSIS
    13. GERMANY MARKET ANALYSIS BY TECHNOLOGY
    14. GERMANY MARKET ANALYSIS BY FLOW TYPE
    15. GERMANY MARKET ANALYSIS BY END USER
    16. UK MARKET ANALYSIS BY TECHNOLOGY
    17. UK MARKET ANALYSIS BY FLOW TYPE
    18. UK MARKET ANALYSIS BY END USER
    19. FRANCE MARKET ANALYSIS BY TECHNOLOGY
    20. FRANCE MARKET ANALYSIS BY FLOW TYPE
    21. FRANCE MARKET ANALYSIS BY END USER
    22. RUSSIA MARKET ANALYSIS BY TECHNOLOGY
    23. RUSSIA MARKET ANALYSIS BY FLOW TYPE
    24. RUSSIA MARKET ANALYSIS BY END USER
    25. ITALY MARKET ANALYSIS BY TECHNOLOGY
    26. ITALY MARKET ANALYSIS BY FLOW TYPE
    27. ITALY MARKET ANALYSIS BY END USER
    28. SPAIN MARKET ANALYSIS BY TECHNOLOGY
    29. SPAIN MARKET ANALYSIS BY FLOW TYPE
    30. SPAIN MARKET ANALYSIS BY END USER
    31. REST OF EUROPE MARKET ANALYSIS BY TECHNOLOGY
    32. REST OF EUROPE MARKET ANALYSIS BY FLOW TYPE
    33. REST OF EUROPE MARKET ANALYSIS BY END USER
    34. APAC MARKET ANALYSIS
    35. CHINA MARKET ANALYSIS BY TECHNOLOGY
    36. CHINA MARKET ANALYSIS BY FLOW TYPE
    37. CHINA MARKET ANALYSIS BY END USER
    38. INDIA MARKET ANALYSIS BY TECHNOLOGY
    39. INDIA MARKET ANALYSIS BY FLOW TYPE
    40. INDIA MARKET ANALYSIS BY END USER
    41. JAPAN MARKET ANALYSIS BY TECHNOLOGY
    42. JAPAN MARKET ANALYSIS BY FLOW TYPE
    43. JAPAN MARKET ANALYSIS BY END USER
    44. SOUTH KOREA MARKET ANALYSIS BY TECHNOLOGY
    45. SOUTH KOREA MARKET ANALYSIS BY FLOW TYPE
    46. SOUTH KOREA MARKET ANALYSIS BY END USER
    47. MALAYSIA MARKET ANALYSIS BY TECHNOLOGY
    48. MALAYSIA MARKET ANALYSIS BY FLOW TYPE
    49. MALAYSIA MARKET ANALYSIS BY END USER
    50. THAILAND MARKET ANALYSIS BY TECHNOLOGY
    51. THAILAND MARKET ANALYSIS BY FLOW TYPE
    52. THAILAND MARKET ANALYSIS BY END USER
    53. INDONESIA MARKET ANALYSIS BY TECHNOLOGY
    54. INDONESIA MARKET ANALYSIS BY FLOW TYPE
    55. INDONESIA MARKET ANALYSIS BY END USER
    56. REST OF APAC MARKET ANALYSIS BY TECHNOLOGY
    57. REST OF APAC MARKET ANALYSIS BY FLOW TYPE
    58. REST OF APAC MARKET ANALYSIS BY END USER
    59. SOUTH AMERICA MARKET ANALYSIS
    60. BRAZIL MARKET ANALYSIS BY TECHNOLOGY
    61. BRAZIL MARKET ANALYSIS BY FLOW TYPE
    62. BRAZIL MARKET ANALYSIS BY END USER
    63. MEXICO MARKET ANALYSIS BY TECHNOLOGY
    64. MEXICO MARKET ANALYSIS BY FLOW TYPE
    65. MEXICO MARKET ANALYSIS BY END USER
    66. ARGENTINA MARKET ANALYSIS BY TECHNOLOGY
    67. ARGENTINA MARKET ANALYSIS BY FLOW TYPE
    68. ARGENTINA MARKET ANALYSIS BY END USER
    69. REST OF SOUTH AMERICA MARKET ANALYSIS BY TECHNOLOGY
    70. REST OF SOUTH AMERICA MARKET ANALYSIS BY FLOW TYPE
    71. REST OF SOUTH AMERICA MARKET ANALYSIS BY END USER
    72. MEA MARKET ANALYSIS
    73. GCC COUNTRIES MARKET ANALYSIS BY TECHNOLOGY
    74. GCC COUNTRIES MARKET ANALYSIS BY FLOW TYPE
    75. GCC COUNTRIES MARKET ANALYSIS BY END USER
    76. SOUTH AFRICA MARKET ANALYSIS BY TECHNOLOGY
    77. SOUTH AFRICA MARKET ANALYSIS BY FLOW TYPE
    78. SOUTH AFRICA MARKET ANALYSIS BY END USER
    79. REST OF MEA MARKET ANALYSIS BY TECHNOLOGY
    80. REST OF MEA MARKET ANALYSIS BY FLOW TYPE
    81. REST OF MEA MARKET ANALYSIS BY END USER
    82. KEY BUYING CRITERIA OF CHEMICALS AND MATERIALS
    83. RESEARCH PROCESS OF MRFR
    84. DRO ANALYSIS OF CHEMICALS AND MATERIALS
    85. DRIVERS IMPACT ANALYSIS: CHEMICALS AND MATERIALS
    86. RESTRAINTS IMPACT ANALYSIS: CHEMICALS AND MATERIALS
    87. SUPPLY / VALUE CHAIN: CHEMICALS AND MATERIALS
    88. CHEMICALS AND MATERIALS, BY TECHNOLOGY, 2024 (% SHARE)
    89. CHEMICALS AND MATERIALS, BY TECHNOLOGY, 2024 TO 2035 (USD Million)
    90. CHEMICALS AND MATERIALS, BY FLOW TYPE, 2024 (% SHARE)
    91. CHEMICALS AND MATERIALS, BY FLOW TYPE, 2024 TO 2035 (USD Million)
    92. CHEMICALS AND MATERIALS, BY END USER, 2024 (% SHARE)
    93. CHEMICALS AND MATERIALS, BY END USER, 2024 TO 2035 (USD Million)
    94. BENCHMARKING OF MAJOR COMPETITORS 7 LIST OF TABLES
    95. LIST OF ASSUMPTIONS
    96. North America MARKET SIZE ESTIMATES; FORECAST
      1. BY TECHNOLOGY, 2025-2035 (USD Million)
      2. BY FLOW TYPE, 2025-2035 (USD Million)
      3. BY END USER, 2025-2035 (USD Million)
    97. US MARKET SIZE ESTIMATES; FORECAST
      1. BY TECHNOLOGY, 2025-2035 (USD Million)
      2. BY FLOW TYPE, 2025-2035 (USD Million)
      3. BY END USER, 2025-2035 (USD Million)
    98. Canada MARKET SIZE ESTIMATES; FORECAST
      1. BY TECHNOLOGY, 2025-2035 (USD Million)
      2. BY FLOW TYPE, 2025-2035 (USD Million)
      3. BY END USER, 2025-2035 (USD Million)
    99. Europe MARKET SIZE ESTIMATES; FORECAST
      1. BY TECHNOLOGY, 2025-2035 (USD Million)
      2. BY FLOW TYPE, 2025-2035 (USD Million)
      3. BY END USER, 2025-2035 (USD Million)
    100. Germany MARKET SIZE ESTIMATES; FORECAST
      1. BY TECHNOLOGY, 2025-2035 (USD Million)
      2. BY FLOW TYPE, 2025-2035 (USD Million)
      3. BY END USER, 2025-2035 (USD Million)
    101. UK MARKET SIZE ESTIMATES; FORECAST
      1. BY TECHNOLOGY, 2025-2035 (USD Million)
      2. BY FLOW TYPE, 2025-2035 (USD Million)
      3. BY END USER, 2025-2035 (USD Million)
    102. France MARKET SIZE ESTIMATES; FORECAST
      1. BY TECHNOLOGY, 2025-2035 (USD Million)
      2. BY FLOW TYPE, 2025-2035 (USD Million)
      3. BY END USER, 2025-2035 (USD Million)
    103. Russia MARKET SIZE ESTIMATES; FORECAST
      1. BY TECHNOLOGY, 2025-2035 (USD Million)
      2. BY FLOW TYPE, 2025-2035 (USD Million)
      3. BY END USER, 2025-2035 (USD Million)
    104. Italy MARKET SIZE ESTIMATES; FORECAST
      1. BY TECHNOLOGY, 2025-2035 (USD Million)
      2. BY FLOW TYPE, 2025-2035 (USD Million)
      3. BY END USER, 2025-2035 (USD Million)
    105. Spain MARKET SIZE ESTIMATES; FORECAST
      1. BY TECHNOLOGY, 2025-2035 (USD Million)
      2. BY FLOW TYPE, 2025-2035 (USD Million)
      3. BY END USER, 2025-2035 (USD Million)
    106. Rest of Europe MARKET SIZE ESTIMATES; FORECAST
      1. BY TECHNOLOGY, 2025-2035 (USD Million)
      2. BY FLOW TYPE, 2025-2035 (USD Million)
      3. BY END USER, 2025-2035 (USD Million)
    107. APAC MARKET SIZE ESTIMATES; FORECAST
      1. BY TECHNOLOGY, 2025-2035 (USD Million)
      2. BY FLOW TYPE, 2025-2035 (USD Million)
      3. BY END USER, 2025-2035 (USD Million)
    108. China MARKET SIZE ESTIMATES; FORECAST
      1. BY TECHNOLOGY, 2025-2035 (USD Million)
      2. BY FLOW TYPE, 2025-2035 (USD Million)
      3. BY END USER, 2025-2035 (USD Million)
    109. India MARKET SIZE ESTIMATES; FORECAST
      1. BY TECHNOLOGY, 2025-2035 (USD Million)
      2. BY FLOW TYPE, 2025-2035 (USD Million)
      3. BY END USER, 2025-2035 (USD Million)
    110. Japan MARKET SIZE ESTIMATES; FORECAST
      1. BY TECHNOLOGY, 2025-2035 (USD Million)
      2. BY FLOW TYPE, 2025-2035 (USD Million)
      3. BY END USER, 2025-2035 (USD Million)
    111. South Korea MARKET SIZE ESTIMATES; FORECAST
      1. BY TECHNOLOGY, 2025-2035 (USD Million)
      2. BY FLOW TYPE, 2025-2035 (USD Million)
      3. BY END USER, 2025-2035 (USD Million)
    112. Malaysia MARKET SIZE ESTIMATES; FORECAST
      1. BY TECHNOLOGY, 2025-2035 (USD Million)
      2. BY FLOW TYPE, 2025-2035 (USD Million)
      3. BY END USER, 2025-2035 (USD Million)
    113. Thailand MARKET SIZE ESTIMATES; FORECAST
      1. BY TECHNOLOGY, 2025-2035 (USD Million)
      2. BY FLOW TYPE, 2025-2035 (USD Million)
      3. BY END USER, 2025-2035 (USD Million)
    114. Indonesia MARKET SIZE ESTIMATES; FORECAST
      1. BY TECHNOLOGY, 2025-2035 (USD Million)
      2. BY FLOW TYPE, 2025-2035 (USD Million)
      3. BY END USER, 2025-2035 (USD Million)
    115. Rest of APAC MARKET SIZE ESTIMATES; FORECAST
      1. BY TECHNOLOGY, 2025-2035 (USD Million)
      2. BY FLOW TYPE, 2025-2035 (USD Million)
      3. BY END USER, 2025-2035 (USD Million)
    116. South America MARKET SIZE ESTIMATES; FORECAST
      1. BY TECHNOLOGY, 2025-2035 (USD Million)
      2. BY FLOW TYPE, 2025-2035 (USD Million)
      3. BY END USER, 2025-2035 (USD Million)
    117. Brazil MARKET SIZE ESTIMATES; FORECAST
      1. BY TECHNOLOGY, 2025-2035 (USD Million)
      2. BY FLOW TYPE, 2025-2035 (USD Million)
      3. BY END USER, 2025-2035 (USD Million)
    118. Mexico MARKET SIZE ESTIMATES; FORECAST
      1. BY TECHNOLOGY, 2025-2035 (USD Million)
      2. BY FLOW TYPE, 2025-2035 (USD Million)
      3. BY END USER, 2025-2035 (USD Million)
    119. Argentina MARKET SIZE ESTIMATES; FORECAST
      1. BY TECHNOLOGY, 2025-2035 (USD Million)
      2. BY FLOW TYPE, 2025-2035 (USD Million)
      3. BY END USER, 2025-2035 (USD Million)
    120. Rest of South America MARKET SIZE ESTIMATES; FORECAST
      1. BY TECHNOLOGY, 2025-2035 (USD Million)
      2. BY FLOW TYPE, 2025-2035 (USD Million)
      3. BY END USER, 2025-2035 (USD Million)
    121. MEA MARKET SIZE ESTIMATES; FORECAST
      1. BY TECHNOLOGY, 2025-2035 (USD Million)
      2. BY FLOW TYPE, 2025-2035 (USD Million)
      3. BY END USER, 2025-2035 (USD Million)
    122. GCC Countries MARKET SIZE ESTIMATES; FORECAST
      1. BY TECHNOLOGY, 2025-2035 (USD Million)
      2. BY FLOW TYPE, 2025-2035 (USD Million)
      3. BY END USER, 2025-2035 (USD Million)
    123. South Africa MARKET SIZE ESTIMATES; FORECAST
      1. BY TECHNOLOGY, 2025-2035 (USD Million)
      2. BY FLOW TYPE, 2025-2035 (USD Million)
      3. BY END USER, 2025-2035 (USD Million)
    124. Rest of MEA MARKET SIZE ESTIMATES; FORECAST
      1. BY TECHNOLOGY, 2025-2035 (USD Million)
      2. BY FLOW TYPE, 2025-2035 (USD Million)
      3. BY END USER, 2025-2035 (USD Million)
    125. PRODUCT LAUNCH/PRODUCT DEVELOPMENT/APPROVAL
    126. ACQUISITION/PARTNERSHIP

Portable Filtration System Market Segmentation

Market Segmentation Overview

  • Detailed segmentation data will be available in the full report
  • Comprehensive analysis by multiple parameters
  • Regional and country-level breakdowns
  • Market size forecasts by segment
Infographic

Free Sample Request

Kindly complete the form below to receive a free sample of this Report

Get Free Sample

Customer Strories

“I am very pleased with how market segments have been defined in a relevant way for my purposes (such as "Portable Freezers & refrigerators" and "last-mile"). In general the report is well structured. Thanks very much for your efforts.”

Victoria Milne

Founder

Compare Licence

×
Features License Type
Single User Multiuser License Enterprise User
Price $4,950 $5,950 $7,250
Maximum User Access Limit 1 User Upto 10 Users Unrestricted Access Throughout the Organization
Free Customization
Direct Access to Analyst
Deliverable Format
Platform Access
Discount on Next Purchase 10% 15% 15%
Printable Versions