Chemicals and Materials Market Segmentation
Chemicals and Materials By Technology (USD Million, 2025-2035)
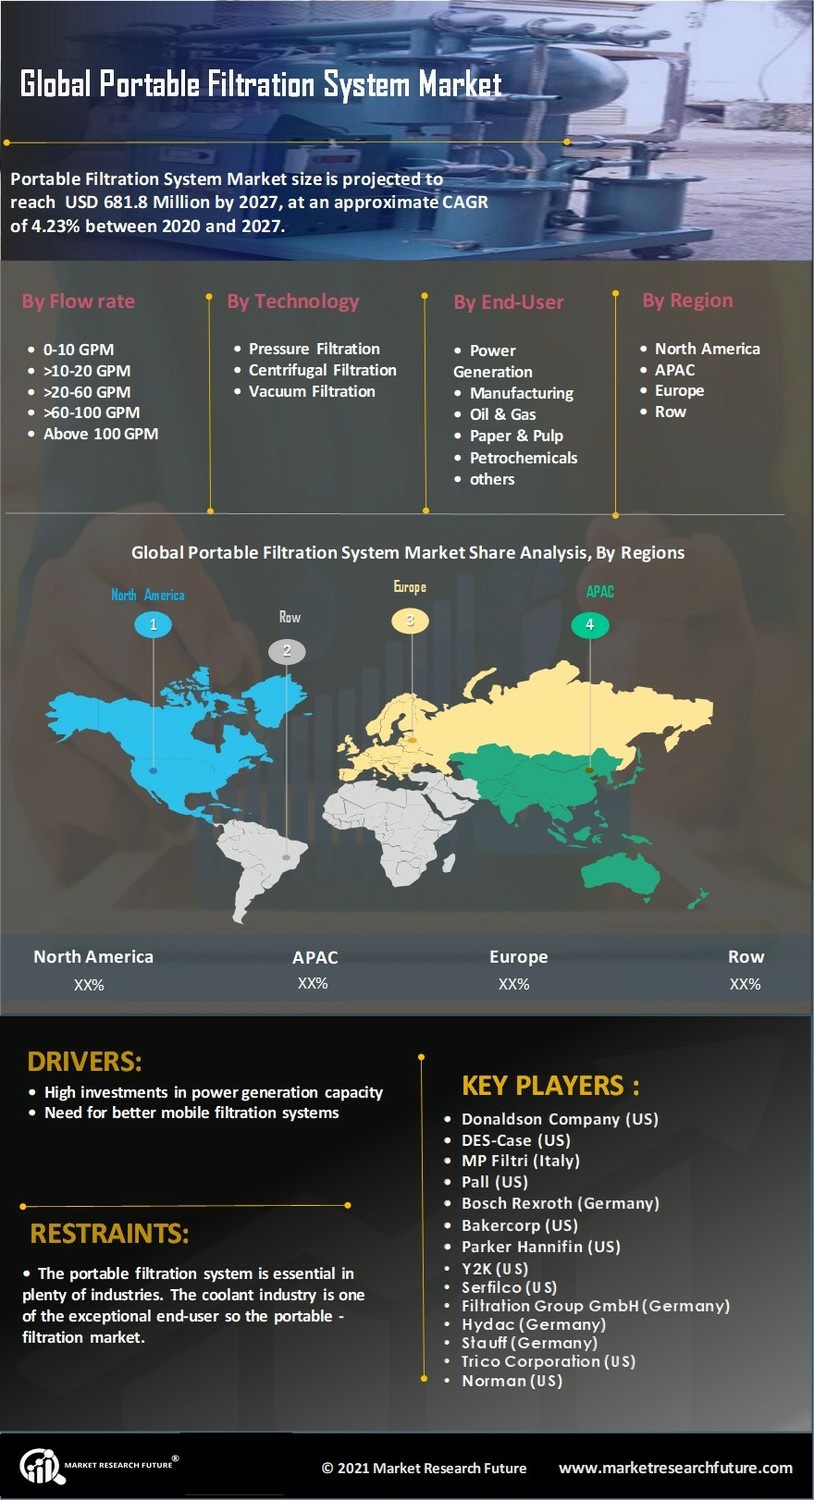
- Centrifugal filtration
- Pressure filtration
- Vacuum filtration
Chemicals and Materials By Flow Type (USD Million, 2025-2035)
- 60-100 GPM
- 20-60 GPM
- 10-20 GPM
- 0-10 GPM
Chemicals and Materials By End User (USD Million, 2025-2035)
- Paper and pulp
- Manufacturing
- Power generation
- Petrochemicals
- Oil and gas