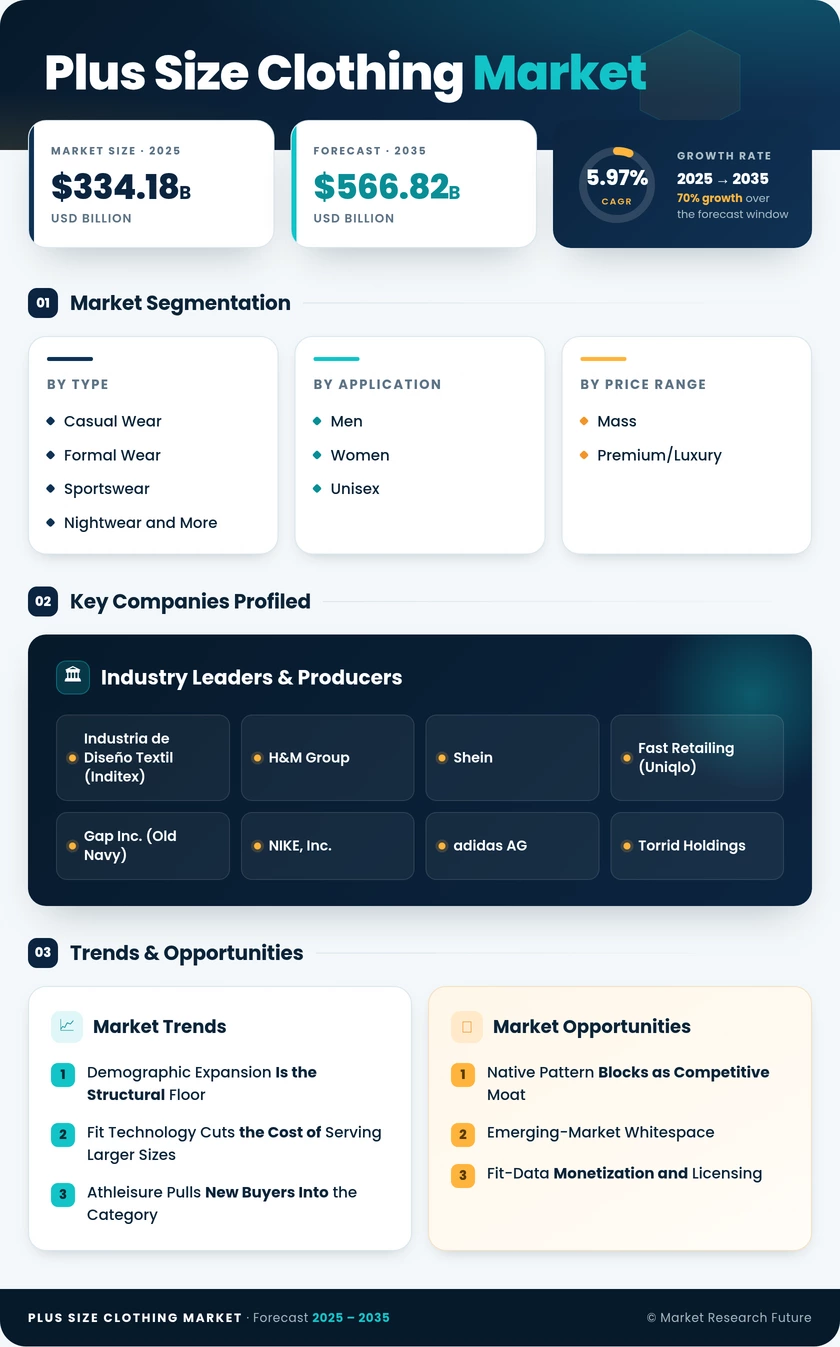
Plus Size Clothing Market (2026 - 2035)

ID: MRFR/CG/19123-HCR 128 Pages Varsha More Last Updated: September 27, 2026
Plus Size Clothing Market Size, Share, Industry Trend & Analysis Research Report Information By Product Type (Formal Wear, Casual Wear, Sportswear, Nightwear and More), By End User (Women, Men, Unisex), By Price Range (Mass, Premium/Luxury), By Distribution Channel (Online Retail Stores, Offline Retail Stores), By Geography (North America, Europe, Asia-Pacific, South America, Middle East and Africa) – Forecast Till 2035
Plus Size Clothing Market
Market Size
Forecast Period2026-2035
CAGR (2026-2035)5.97%
2025 Market SizeUSD 334.18 Billion
2035 Market SizeUSD 566.82 Billion
Key Players
Industria de Diseño Textil
H&M Group
Shein
Fast Retailing
Gap Inc.
NIKE, Inc.
Opportunities
  • Native Pattern Blocks as Competitive Moat
  • Emerging-Market Whitespace
  • Fit-Data Monetization and Licensing
  1. 1 Market Summary |
    1. 1.1 Study Assumptions & Market Definition |
    2. 1.2 Scope of the Study |
    3. 1.3 Research Methodology
  2. 2 Key Report Takeaways |
    1. 2.1 By Product Type |
    2. 2.2 By End User |
    3. 2.3 By Distribution Channel |
    4. 2.4 By Geography
  3. 3 Market Size & Forecast (2021–2035) |
    1. 3.1 Historical Market Size (2021–2024) |
    2. 3.2 Base Year Assessment (2025) |
    3. 3.3 Forecast Market Size (2026–2035) |
    4. 3.4 Year-over-Year Growth Analysis
  4. 4 Driver Impact Analysis |
    1. 4.1 Demographic Expansion Is the Structural Floor |
    2. 4.2 Fit Technology Cuts the Cost of Serving Larger Sizes |
    3. 4.3 Athleisure Pulls New Buyers Into the Category |
    4. 4.4 Mass Merchants Normalize the Assortment
  5. 5 Restraints Impact Analysis |
    1. 5.1 Fabric Economics Squeeze the Category |
    2. 5.2 Size-Curve Complexity Creates Markdown Exposure |
    3. 5.3 Physical Retail Space Remains the Bottleneck
  6. 6 Opportunities |
    1. 6.1 Native Pattern Blocks as Competitive Moat |
    2. 6.2 Emerging-Market Whitespace |
    3. 6.3 Fit-Data Monetization and Licensing |
    4. 6.4 Rental, Resale, and Subscription Models |
    5. 6.5 Adaptive and Maternity Adjacencies
  7. 7 Regional Market Share & Country-Level Analysis |
    1. 7.1 North America | |
      1. 7.1.1 US | |
      2. 7.1.2 Canada | |
      3. 7.1.3 Mexico |
    2. 7.2 Europe | |
      1. 7.2.1 Germany | |
      2. 7.2.2 UK | |
      3. 7.2.3 France | |
      4. 7.2.4 Italy | |
      5. 7.2.5 Spain | |
      6. 7.2.6 Nordic Countries | |
      7. 7.2.7 Russia | |
      8. 7.2.8 Rest of Europe |
    3. 7.3 Asia-Pacific | |
      1. 7.3.1 China | |
      2. 7.3.2 India | |
      3. 7.3.3 Japan | |
      4. 7.3.4 South Korea | |
      5. 7.3.5 ASEAN | |
      6. 7.3.6 Rest of Asia-Pacific |
    4. 7.4 South America | |
      1. 7.4.1 Brazil | |
      2. 7.4.2 Argentina | |
      3. 7.4.3 Rest of South America |
    5. 7.5 Middle East & Africa | |
      1. 7.5.1 Saudi Arabia | |
      2. 7.5.2 UAE | |
      3. 7.5.3 South Africa | |
      4. 7.5.4 Egypt | |
      5. 7.5.5 Rest of Middle East & Africa
  8. 8 Future Outlook (2026–2035) |
    1. 8.1 AI Moves From Recommendation to Design |
    2. 8.2 Platform Economics Redraw Distribution |
    3. 8.3 Circularity Rules Reshape Cost Structures |
    4. 8.4 Health Policy Introduces Genuine Uncertainty
  9. 9 Market Segmentation Analysis |
    1. 9.1 By Product Type | |
      1. 9.1.1 Formal Wear | |
      2. 9.1.2 Casual Wear | |
      3. 9.1.3 Sportswear | |
      4. 9.1.4 Nightwear and More |
    2. 9.2 By End User | |
      1. 9.2.1 Women | |
      2. 9.2.2 Men | |
      3. 9.2.3 Unisex |
    3. 9.3 By Price Range | |
      1. 9.3.1 Mass | |
      2. 9.3.2 Premium/Luxury |
    4. 9.4 By Distribution Channel | |
      1. 9.4.1 Online Retail Stores | |
      2. 9.4.2 Offline Retail Stores
  10. 10 Competitive Landscape |
    1. 10.1 Market Concentration Analysis |
    2. 10.2 Competitive Benchmarking Matrix |
    3. 10.3 Company Profiles
  11. 11 Recent News & Developments
  12. 12 Report Scope & Methodology
  13. 13 Detailed Sources & Citations
  14. 14 Frequently Asked Questions
  15. 15 LIST OF TABLES |
  16. TABLE 1 Global Plus Size Clothing Market Size & Forecast, by Revenue (USD Billion), 2021–2035 |
  17. TABLE 2 Global Plus Size Clothing Market – Year-over-Year Growth Analysis, 2021–2035 |
  18. TABLE 3 Driver Impact Analysis Matrix, 2026–2035 |
  19. TABLE 4 Restraint Impact Analysis Matrix, 2026–2035 |
  20. TABLE 5 Global Plus Size Clothing Market Size, by Region, 2021–2035 (USD Billion) |
  21. TABLE 6 North America Plus Size Clothing Market Size, by Country, 2021–2035 (USD Billion) |
  22. TABLE 7 Europe Plus Size Clothing Market Size, by Country, 2021–2035 (USD Billion) |
  23. TABLE 8 Asia-Pacific Plus Size Clothing Market Size, by Country, 2021–2035 (USD Billion) |
  24. TABLE 9 South America Plus Size Clothing Market Size, by Country, 2021–2035 (USD Billion) |
  25. TABLE 10 Middle East & Africa Plus Size Clothing Market Size, by Country, 2021–2035 (USD Billion) |
  26. TABLE 11 Global Plus Size Clothing Market Size, by Product Type, 2021–2035 (USD Billion) |
  27. TABLE 12 Global Plus Size Clothing Market Size, by End User, 2021–2035 (USD Billion) |
  28. TABLE 13 Global Plus Size Clothing Market Size, by Price Range, 2021–2035 (USD Billion) |
  29. TABLE 14 Global Plus Size Clothing Market Size, by Distribution Channel, 2021–2035 (USD Billion) |
  30. TABLE 15 North America Plus Size Clothing Market Size, by Product Type, 2021–2035 (USD Billion) |
  31. TABLE 16 Europe Plus Size Clothing Market Size, by Distribution Channel, 2021–2035 (USD Billion) |
  32. TABLE 17 Asia-Pacific Plus Size Clothing Market Size, by End User, 2021–2035 (USD Billion) |
  33. TABLE 18 South America Plus Size Clothing Market Size, by Price Range, 2021–2035 (USD Billion) |
  34. TABLE 19 Middle East & Africa Plus Size Clothing Market Size, by Product Type, 2021–2035 (USD Billion) |
  35. TABLE 20 Competitive Benchmarking Matrix – Global Plus Size Clothing Market, 2026 |
  36. TABLE 21 Company Profiles – Key Players, Global Plus Size Clothing Market |
  37. TABLE 22 Recent Developments & Strategic Announcements, 2023–2025 |
  38. TABLE 23 Report Scope & Methodology Summary |
  39. TABLE 24 Detailed Sources & Citations Index
  40. 16 LIST OF FIGURES |
  41. FIGURE 1 Global Plus Size Clothing Market Dynamics – Drivers, Restraints & Opportunities |
  42. FIGURE 2 Industry Value Chain Analysis – Fiber to Retail |
  43. FIGURE 3 Porter's Five Forces Analysis |
  44. FIGURE 4 Global Market Size Trend & Forecast, 2021–2035 (USD Billion) |
  45. FIGURE 5 Year-over-Year Growth Trajectory, 2022–2035 (%) |
  46. FIGURE 6 Market Share by Product Type, 2025 vs 2035 (%) |
  47. FIGURE 7 Market Share by End User, 2025 vs 2035 (%) |
  48. FIGURE 8 Market Share by Price Range, 2025 (%) |
  49. FIGURE 9 Market Share by Distribution Channel, 2025 vs 2035 (%) |
  50. FIGURE 10 Regional Market Share Distribution, 2025 (%) |
  51. FIGURE 11 Regional CAGR Comparison, 2026–2035 (%) |
  52. FIGURE 12 North America Country-Level Share Breakdown, 2025 (%) |
  53. FIGURE 13 Asia-Pacific Country-Level Growth Comparison, 2026–2035 (%) |
  54. FIGURE 14 Competitive Landscape – Estimated Revenue Share Ranges, 2026 |
  55. FIGURE 15 Competitive Positioning Quadrant – Fit Capability vs Assortment Breadth |
  56. FIGURE 16 Driver Impact Weighting on Headline CAGR

Segmentation Quick Reference

DimensionSub-SegmentsDominant SegmentFastest Growing Segment
By Product TypeFormal Wear, Casual Wear, Sportswear, Nightwear and MoreCasual WearSportswear
By End UserWomen, Men, UnisexMenWomen
By Price RangeMass, Premium/LuxuryMassPremium/Luxury
By Distribution ChannelOnline Retail Stores, Offline Retail StoresOffline Retail StoresOnline Retail Stores
By GeographyNorth America, Europe, Asia-Pacific, South America, Middle East and AfricaNorth AmericaAsia-Pacific


Market Segmentation Overview

By Product Type

Sub-SegmentKey Trend
Formal WearOccasion dressing and hybrid workwear revive demand for tailored extended fits
Casual WearRelaxed silhouettes absorb grading tolerance, keeping it the entry category
SportswearPerformance knits and inclusive size runs drive the fastest growth
Nightwear and MoreComfort-led repeat purchase with low fit risk sustains steady volume


Product-type dynamics hinge on how much fit precision each category demands. Categories that forgive grading error scale quickly; tailored formal wear scales only where brands have invested in purpose-built blocks.

By End User

Sub-SegmentKey Trend
WomenDesigner collaborations and creator-led discovery close a long-standing assortment gap
MenEstablished big-and-tall infrastructure sustains the largest installed base
UnisexOversized streetwear silhouettes broaden the addressable buyer pool


Structural distribution history, more than underlying demand, explains today's end-user split. As women's assortments reach parity in breadth and placement, the share gap should narrow steadily through 2035.

By Price Range

Sub-SegmentKey Trend
MassAccessibility and assortment breadth keep it the volume anchor
Premium/LuxurySuperior fabrics and precise grading justify higher price realization


Premium growth reflects a willingness to pay for fit accuracy rather than logo value. Shoppers who have experienced poor grading at mass price points trade up specifically for construction quality.

By Distribution Channel

Sub-SegmentKey Trend
Online Retail StoresAR fitting rooms and social-commerce discovery drive double-digit growth
Offline Retail StoresFit confidence and immediate availability preserve the volume base


Channel strategy is converging rather than diverging. Leading operators now treat stores as fit-validation and returns-processing nodes that feed data directly into online sizing algorithms.

By Geography

Sub-SegmentKey Trend
North AmericaSpecialty scale, big-and-tall consolidation, and AR fit deployment
EuropeCircularity regulation and private-label grading investment
Asia-PacificPlatform commerce and rapid domestic brand entry
South AmericaLocal manufacturing agility and marketplace logistics buildout
Middle East and AfricaModest-wear crossover and mall retail expansion


Regional trajectories diverge on infrastructure rather than demand. Western markets optimize existing specialty networks, while emerging regions leapfrog directly to platform-led distribution.




Download PDF ×

We do not share your information with anyone. However, we may send you emails based on your report interest from time to time. You may contact us at any time to opt-out.