Platform as a Service Market (2026 - 2035)

Platform as a Service Market Size, Share and Research Report By Type (Database PaaS, Application PaaS, Integration PaaS, Other PaaS Types), By Deployment Model (Public PaaS, Private PaaS, Hybrid PaaS), By End-User Industry (Financial Services (BFSI), Healthcare, Manufacturing, Retail & E-Commerce, Government & Public Sector, Others), By Organization Size (Large Enterprises, Small and Medium-Sized Enterprises (SMEs)) and By Regional (North America, Europe, South America, Asia Pacific, Middle East and Africa) - Industry Forecast to 2035.
ID: MRFR/ICT/1368-HCR
110 Pages
Apoorva Priyadarshi, Shubham Munde
Last Updated: June 26, 2026
Platform as a Service Market

Market Size

Forecast Period2026-2035
CAGR (2026-2035)15.1%
2025 Market SizeUSD 150.80 Billion
2035 Market SizeUSD 617.30 Billion

Key Players

Amazon Web Services
Microsoft Corporation
Google LLC
Salesforce Inc.
IBM Corporation
Oracle Corporation
Opportunities
  • Industry-Specific Vertical PaaS
  • Edge-PaaS Convergence
  • Emerging-Market Digital Transformation

Platform as a Service Market Summary

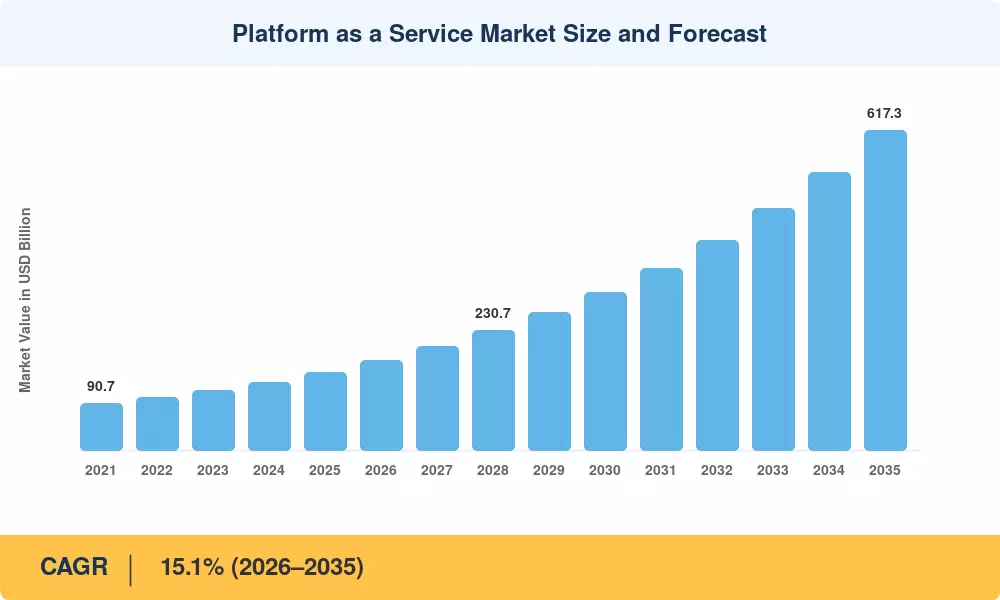
The Platform as a Service Market reached an estimated USD 150.80 Billion in 2025 and is projected to grow from USD 174.10 Billion in 2026 to USD 617.30 Billion by 2035, registering a CAGR of 15.1% during the forecast period (2026–2035). Enterprise commitments to cloud-first strategies — including the U.S. Federal Cloud Smart mandate and the EU's EUR 7.5 Billion Digital Europe Programme — have injected measurable urgency into platform adoption cycles [1]. Over 94% of enterprises now consume at least one cloud service, and roughly nine in ten pursue multi-cloud architectures to hedge against single-vendor risk [2].

The transformation underway replaces monolithic, on-premise middleware stacks with composable, API-driven platforms that compress development timelines from months to days. In 2024 alone, hyperscalers collectively allocated more than USD 160 Billion in capital expenditure toward cloud infrastructure, with a growing share directed at platform-layer services that embed AI model training, serverless compute, and event-driven integration natively [3]. Regulatory catalysts such as India's MeitY Cloud-First Policy and Japan's Digital Garden City initiative have further broadened addressable demand beyond traditional IT-heavy industries.

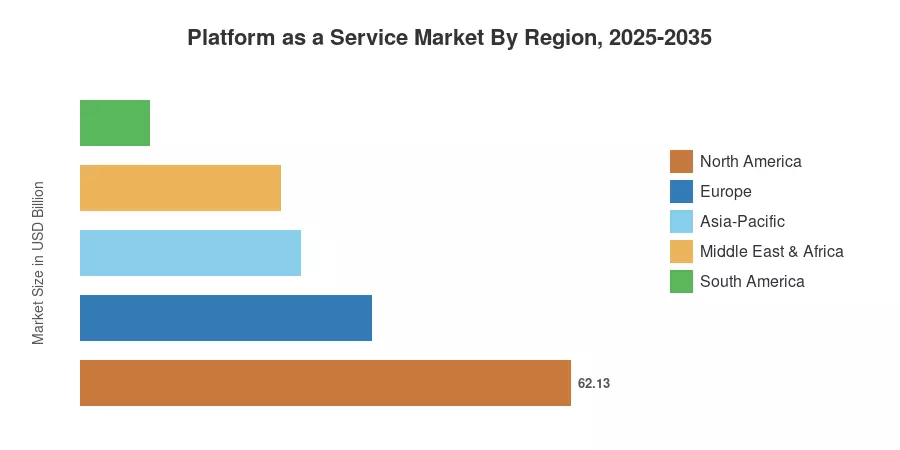
North America commanded roughly 41.2% of Platform as a Service Market revenue in 2025, buoyed by hyperscaler concentration and early enterprise maturity. Asia-Pacific is the fastest-growing geography, forecast to expand at an 18.5% CAGR through 2035 as manufacturers, banks, and government agencies across China, India, and ASEAN modernize legacy estates [4]. Europe holds the second-largest share at approximately 24.5%, driven by GDPR-compliant sovereign cloud programs and pan-European data-space initiatives. The next decade will see PaaS evolve from a developer convenience into the default operating layer for enterprise software.


Key Report Takeaways

• By Type

  • Database PaaS captured approximately 48.1% of the Platform as a Service Market in 2025, reflecting its role as the backbone for transaction-heavy and analytics workloads across financial services and e-commerce.
  • Integration PaaS is forecast to advance at a 21.0% CAGR through 2035, propelled by demand for real-time data orchestration across hybrid and multi-cloud estates.

• By Deployment

  • Public PaaS accounted for roughly 69.2% of Platform as a Service Market revenue in 2025, as organizations prioritize rapid provisioning and elastic scaling.
  • Hybrid PaaS is projected to record a 22.0% CAGR over the forecast period, reflecting regulated industries' need to balance control with agility.


• By Organization Size

  • SMEs are expanding PaaS adoption at a 19.2% CAGR, leveraging pay-as-you-go economics to compete with larger incumbents.

• By End-User Industry

  • Financial services led Platform as a Service Market end-user demand in 2025 with a 25.7% revenue share, deploying PaaS for compliance automation and real-time risk analytics.
  • Healthcare is set to grow at an 18.3% CAGR through 2035, driven by telemedicine expansion and patient-data interoperability mandates.

• By Region

  • North America held 41.2% of global revenue in 2025.
  • Asia-Pacific is forecast to register the highest regional CAGR at 18.5% through 2035.


Market Size and Forecast (2021–2035)

Market Research Future derives historical values from vendor revenue disclosures, hyperscaler earnings reports, and third-party IT spending surveys. Forecast projections apply a bottom-up build across segments, calibrated against macroeconomic indicators (GDP growth, enterprise IT budgets) and validated through primary interviews with CIOs and cloud architects.

 
Platform as a Service Market Size and Forecast
Our Impact
Enabled $4.3B Revenue Impact for Fortune 500 and Leading Multinationals
Partnering with 2000+ Global Organizations Each Year
30K+ Citations by Top-Tier Firms in the Industry

Driver Impact Analysis

Driver ~% Impact on CAGR Geographic Relevance Impact Timeline
Enterprise cloud-native transformation 25–30 Global Short-term (≤2 yr)
AI and ML platform embedding 18–22 North America, APAC Medium-term (2–4 yr)
Multi-cloud and hybrid orchestration 14–17 Europe, North America Medium-term (2–4 yr)
Low-code/no-code democratization 10–13 Global Long-term (≥4 yr)
Data sovereignty and compliance mandates 8–11 Europe, APAC Short-term (≤2 yr)
API economy and microservices proliferation 7–10 Global Long-term (≥4 yr)
SME digital-first adoption 5–8 APAC, South America Medium-term (2–4 yr)


Enterprise Cloud-Native Transformation

The industry-wide transition to cloud-native architectures is the main driver of the Platform-as-a-Service (PaaS) market. According to an industry analysis by the Cloud Native Computing Foundation (CNCF), about 39% of developers worldwide are currently using cloud-native approaches. By requiring government apps to prioritize cloud-native deployment, official mandates like India's MeitY cloud-first directives and the U.S. Federal Cloud Smart policy are hastening this shift and further stabilizing demand worldwide.


AI and ML Platform Embedding

To collect AI-driven cloud spend, hyperscalers have actively incorporated inference endpoints, vector databases, and model-training pipelines into their PaaS stacks. AI-related cloud investment has increased from 8% in 2023 to over 19% of total cloud expenditure, according to 2026 market intelligence. The close integration of these models with current PaaS environments guarantees that AI experimentation directly converts into consistent, recurring revenue for platform providers as AWS, Microsoft Azure, and Google Cloud, as they continue to reposition their infrastructure around AI-first services.


Multi-Cloud and Hybrid Orchestration

According to the 2026 Flexera State of the Cloud Report, hybrid clouds continue to be the most popular architectural option, with 73% of businesses running hybrid estates. The need for technologies that abstract provider-specific APIs has increased as businesses negotiate the challenges of multi-cloud setups. To enable task portability, Kubernetes-based control planes and service meshes are becoming commonplace. By creating frameworks for interoperable cloud federations and highlighting the necessity of PaaS-layer portability, initiatives like the European Union's Gaia-X continue to have an impact on the market.


Low-Code / No-Code Democratization

Platforms such as Salesforce Lightning, Microsoft Power Apps, and Mendix have expanded the addressable developer population from approximately 27 million professional coders to over 100 million "citizen developers" [13]. projects that the low-code segment alone will influence USD 21 Billion in platform spending by 2028, effectively widening the Platform as a Service Market beyond traditional IT departments and into operations, marketing, and finance functions.


Restraints Impact Analysis

The restraint estimates below quantify directional drag on Platform as a Service Market growth. They represent potential CAGR suppression under adverse scenarios and should not be subtracted directly from the headline growth rate.

Restraint ~% Drag on CAGR Geographic Relevance Impact Timeline
Vendor lock-in and portability friction –3 to –5 Global Long-term (≥4 yr)
Data residency and regulatory fragmentation –2 to –4 Europe, APAC Short-term (≤2 yr)
Security and compliance complexity –2 to –3 Global Medium-term (2–4 yr)
Talent shortage in cloud engineering –1 to –3 Global Medium-term (2–4 yr)
Cost unpredictability at scale –1 to 2 North America, Europe Short-term (≤2 yr)


Vendor Lock-In and Portability Friction

Proprietary runtime environments, managed database engines, and provider-specific serverless frameworks create switching costs that can reach 30–40% of a workload's total cost of ownership when migrating between clouds [15]. The Cloud Native Computing Foundation (CNCF) has flagged portability as a top concern in its 2024 survey, with 62% of respondents citing it as a barrier to multi-cloud expansion. These lock-in dynamics concentrate spending among incumbent platforms while slowing competitive entry.

Data Residency and Regulatory Fragmentation

Divergent data-localization requirements — from the EU's GDPR Article 44 transfer restrictions to China's Data Security Law and India's Digital Personal Data Protection Act — compel enterprises to operate regionally isolated PaaS instances [11]. Compliance overhead increases total platform spend by an estimated 12–18% for multinational deployments, which can delay or shrink planned cloud migrations for cost-conscious mid-market buyers.

Security and Compliance Complexity

The main breach vectors for businesses are still supply-chain vulnerabilities, shared-responsibility models, and incorrect identity and access management (IAM) configurations. The average cost of a data breach worldwide was USD 4.88 million, according to the IBM Cost of a Data Breach Report 2024. Misconfigurations, which frequently result from complicated, multi-environment setups, continue to be a common root cause for security teams, and cloud-based breaches continue to rank among the most costly events. It has been demonstrated that companies that heavily use security AI and automation for threat detection and posture management can drastically reduce these expenses in comparison to those that rely on human procedures.


Platform as a Service Market Opportunities

Industry-Specific Vertical PaaS

Generic horizontal platforms are giving way to pre-configured vertical offerings tailored for healthcare (HIPAA-native data pipelines), financial services (real-time fraud-detection frameworks), and manufacturing (digital-twin environments). Vertical PaaS can command 25–35% price premiums over horizontal equivalents by embedding domain-specific compliance controls and workflow templates, opening a USD 40+ Billion incremental opportunity within the Platform as a Service Market by 2032 [14].

Edge-PaaS Convergence

As 5G rollouts expand and IoT device counts surpass 30 Billion by 2030, enterprises need platforms that extend development, deployment, and monitoring capabilities to edge nodes [12]. AWS Wavelength, Azure Private Edge Zones, and Google Distributed Cloud signal early moves, but the edge-PaaS category remains underpenetrated — offering first-mover advantages for providers that standardize developer toolchains across cloud core and network edge.

Emerging-Market Digital Transformation

Governments across Southeast Asia, the Middle East, and Latin America are allocating billions to cloud infrastructure and e-government platforms. Saudi Arabia's Vision 2030 technology budget alone exceeds USD 6.4 Billion, with PaaS positioned as the middleware backbone for smart-city and fintech super-app ecosystems [19]. These markets represent greenfield territory where developer platform services are still largely untapped.

Data Monetization and Analytics-as-a-Service

Organizations sitting on proprietary datasets — from logistics telemetry to patient outcomes — can use PaaS-hosted analytics pipelines to package insights as subscription services. This data-as-a-product model transforms PaaS from a cost center into a revenue-generation channel, with estimates that data monetization strategies could unlock USD 1.2 Trillion in aggregate enterprise value globally by 2030 [20].

Sovereign and Confidential Cloud Platforms

PaaS-hosted analytics pipelines allow businesses with proprietary datasets—from patient outcomes to logistical telemetry—to package insights as subscription services. PaaS becomes a revenue-generating channel instead of a cost center thanks to this data-as-a-product paradigm. As businesses move more and more from collection-led to product-led data models, leading industry analysts predict that data monetization strategies might release significant aggregate corporate value globally by 2030.


Platform as a Service Market Future Outlook

AI-Native Platform Evolution

By 2030, the boundary between traditional PaaS and AI infrastructure will blur beyond recognition. Platforms will offer model lifecycle management — training, fine-tuning, evaluation, and real-time inference — as first-class primitives alongside databases and application runtimes. The Platform as a Service Market will absorb a significant portion of what is currently classified as standalone MLOps spending, estimated at USD 37 Billion globally by 2029 [8].

Platform Economics and Developer-Led Growth

Consumption-based pricing models are reshaping vendor strategies from license-centric selling to usage-centric growth loops. Platforms that reduce time-to-first-deploy — through pre-built templates, auto-scaling defaults, and embedded CI/CD — capture disproportionate developer wallet share. Platform as a Service Market leaders will compete less on feature lists and more on developer experience metrics: onboarding friction, documentation quality, and community ecosystem breadth [6].

Composable and Event-Driven Architectures

Monolithic applications will continue migrating toward composable architectures built on microservices, serverless functions, and event-driven choreography. By the early 2030s, Market Research Future expects over 60% of enterprise workloads to run on event-driven PaaS substrates, unlocking real-time responsiveness for supply-chain, fintech, and IoT use cases. This architectural shift will accelerate Platform as a Service Market growth by increasing per-workload platform consumption [12].

Sustainability and Green Cloud Operations

Cloud providers face mounting ESG scrutiny over energy consumption and carbon footprint. The Platform as a Service Market will increasingly differentiate on sustainability metrics — carbon-aware workload scheduling, renewable-energy region selection, and efficiency dashboards. The EU's Corporate Sustainability Reporting Directive (CSRD), effective from 2026, requires in-scope companies to disclose cloud-related emissions, creating a compliance-driven incentive for green PaaS adoption [21].


Platform as a Service Market Segmentation

By Type

Segment Key Metric Primary Demand Driver
Database PaaS 48.1% share (2025) Mission-critical transactional and analytics workloads
Application PaaS USD 52.30 Billion (2025) Rapid application development and deployment
Integration PaaS 21.0% CAGR (2026–2035) Multi-cloud data orchestration and API management
Other PaaS Types USD 10.80 Billion (2025) Testing, IoT, and business-process management


Database PaaS remains the dominant segment in the Platform as a Service Market, anchored by the migration of enterprise relational databases (Oracle, SQL Server, PostgreSQL) to managed cloud instances and the parallel rise of NoSQL and vector-database services for AI workloads. Financial institutions, e-commerce operators, and SaaS vendors rely on database PaaS for sub-millisecond query performance at global scale, while managed offerings eliminate patching, backup, and failover complexity.

Integration PaaS is growing fastest as enterprises grapple with application sprawl. The average large company runs over 1,000 SaaS applications, each generating data that must be synchronized, transformed, and routed to analytics and compliance systems. Integration PaaS products — from MuleSoft and Boomi to cloud-native iPaaS solutions — address this challenge by providing pre-built connectors, visual workflow designers, and event-streaming capabilities.

By Deployment Model

Segment Key Metric Primary Demand Driver
Public PaaS 69.2% share (2025) Elastic scaling, rapid provisioning, global reach
Private PaaS USD 18.40 Billion (2025) Regulatory compliance, data control
Hybrid PaaS 22.0% CAGR (2026–2035) Workload portability across cloud and on-premise


Public PaaS dominates Platform as a Service Market deployments because it removes capacity-planning burdens and offers near-instant access to managed services. AWS, Azure, and GCP collectively operate over 100 availability zones worldwide, providing developers with geographic redundancy and low-latency endpoints. Private PaaS retains relevance among defense, intelligence, and healthcare buyers who require air-gapped or on-premise control. Hybrid PaaS, the fastest-growing deployment model, bridges both worlds — enabling regulated workloads to remain on-premise while leveraging public cloud for burst compute and AI services.

By End-User Industry

Segment Key Metric Primary Demand Driver
Financial Services (BFSI) 25.7% share (2025) Real-time risk analytics, compliance automation
Healthcare 18.3% CAGR (2026–2035) Telemedicine, EHR interoperability, clinical AI
Manufacturing USD 16.20 Billion (2025) Digital twins, supply-chain orchestration
Retail & E-Commerce 16.8% CAGR (2026–2035) Personalization engines, omnichannel platforms
Government & Public Sector USD 10.90 Billion (2025) E-government, citizen-services portals
Others 14.3% CAGR (2026–2035) Education, media, logistics


Financial services lead the Platform as a Service Market by end-user revenue, driven by the sector's simultaneous need for computational intensity (algorithmic trading, fraud detection) and regulatory agility (Basel IV, PSD3). Banks deploy PaaS-hosted microservices to isolate compliance functions, enabling rapid updates without monolithic release cycles.

Healthcare is the fastest-growing end-user vertical, propelled by interoperability mandates such as the U.S. CMS Interoperability Rule and the EU's European Health Data Space regulation. Hospitals and payer organizations use PaaS to host FHIR-based APIs, clinical-decision-support tools, and patient-facing telemedicine portals [22].

By Organization Size

Segment Key Metric Primary Demand Driver
Large Enterprises 73.5% share (2025) Complex workloads, multi-region deployments
Small and Medium-Sized Enterprises (SMEs) 19.2% CAGR (2026–2035) Pay-as-you-go economics, low-code access


Large enterprises dominate the Platform as a Service Market spending because their application portfolios span thousands of microservices, each requiring managed databases, API gateways, and CI/CD pipelines. SMEs, meanwhile, are the faster-growing segment as low-code PaaS tools and consumption-based pricing remove the capital-expenditure barrier that historically limited cloud adoption for smaller organizations [9].


Regional Market Share Analysis

Region Key Metric Primary Investment Themes
North America 41.2% revenue share (2025) Hyperscaler R&D, federal cloud mandates
Europe USD 36.90 Billion (2025) Sovereign cloud, Gaia-X, GDPR compliance
Asia-Pacific 18.5% CAGR (2026–2035) Manufacturing modernization, fintech growth
South America 5.8% revenue share (2025) E-government digitization, fintech startups
Middle East & Africa 16.8% CAGR (2026–2035) Vision 2030, smart-city programs
Total USD 150.80 Billion (2025)

The Platform as a Service Market exhibits a clear three-tier regional hierarchy, with North America and Asia-Pacific contributing the largest absolute and incremental revenue pools, respectively.


North America

Country Key Metric Key Driver
United States 78.5% of regional revenue Hyperscaler headquarters, federal IT modernization
Canada 12.3% of regional revenue Financial-services digital transformation
Mexico 14.6% CAGR (2026–2035) Nearshoring boom, SME cloud adoption


The U.S. remains the gravitational center of the Platform as a Service Market, housing the global headquarters and primary compute regions of AWS, Microsoft Azure, and Google Cloud. Federal mandates such as FedRAMP authorization and the FITARA scorecard process push agencies toward PaaS-hosted applications, while the private sector — particularly banking and insurance — channels platform spending toward real-time compliance analytics and AI-embedded underwriting engines [1].

Europe

Country Key Metric Key Driver
Germany USD 4.85 Billion (2025) Industry 4.0, automotive digital twins
United Kingdom 22.1% of regional revenue Open-banking APIs, fintech clusters
France 15.7% CAGR (2026–2035) Sovereign cloud (Bleu), public-sector reform
Italy USD 2.10 Billion (2025) Manufacturing digitization, PNRR funding
Spain 14.9% CAGR (2026–2035) Tourism-tech modernization
Nordic Countries USD 3.45 Billion (2025) Green-tech software development
Russia 11.8% CAGR (2026–2035) Domestic platform substitution
Rest of Europe USD 4.20 Billion (2025) EU Structural Fund allocations


European Platform as a Service Market growth is shaped by the dual pressures of digital sovereignty and competitive urgency. The European Commission's Data Act (effective September 2025) mandates switching-facilitation features and interoperability standards that directly influence PaaS vendor roadmaps, while the EUR 7.5 Billion Digital Europe Programme funnels investment into cloud, AI, and cybersecurity platform capabilities [7].

Asia-Pacific

Country Key Metric Key Driver
China 34.6% of regional revenue Alibaba, Huawei, and Tencent PaaS ecosystems
India 19.8% CAGR (2026–2035) MeitY Cloud-First policy, UPI-scale fintech
Japan USD 5.90 Billion (2025) Digital Garden City initiative, enterprise SaaS migration
South Korea 17.2% CAGR (2026–2035) 5G edge platforms, semiconductor R&D tools
ASEAN USD 3.70 Billion (2025) Cross-border e-commerce, government digitization
Rest of Asia-Pacific 16.3% CAGR (2026–2035) Emerging digital economies


Asia-Pacific represents the highest-growth region in the Platform as a Service Market, driven by a convergence of manufacturing modernization, expanding developer communities, and government-led digital infrastructure investments. India's Unified Payments Interface handles over 12 Billion monthly transactions, all running on cloud-platform backends, while China's "East Data, West Compute" project channels USD 36 Billion into distributed cloud infrastructure that relies heavily on PaaS orchestration layers [4].

South America

Country Key Metric Key Driver
Brazil 58.3% of regional revenue Pix payments ecosystem, agritech modernization
Argentina 15.2% CAGR (2026–2035) Fintech regulatory reform
Rest of South America USD 1.55 Billion (2025) E-government digitization


Brazil anchors the Platform as a Service Market demand in South America. The Central Bank's Pix instant-payment system and Open Finance initiative have spurred a wave of fintech platforms built on PaaS stacks, while agribusiness — which accounts for roughly 25% of GDP — increasingly deploys cloud-hosted precision-agriculture analytics [19].

Middle East & Africa

Country Key Metric Key Driver
Saudi Arabia 29.4% of regional revenue Vision 2030 smart-city platforms
UAE USD 1.35 Billion (2025) DIFC fintech hub, free-zone cloud incentives
South Africa 14.5% CAGR (2026–2035) Banking modernization, mobile-first services
Egypt 17.1% CAGR (2026–2035) New Administrative Capital IT backbone
Rest of MEA USD 0.95 Billion (2025) Telecom-led cloud bundling


The Middle East & Africa region is transitioning from a net cloud consumer to an emerging development hub. Saudi Arabia's NEOM project and the UAE's Digital Government Strategy 2025 require platform layers that support developer ecosystems across smart-city, logistics, and financial-services applications [19].


Platform as a Service Market By Region, 2025-2035

Competitive Benchmarking

The Platform as a Service Market exhibits medium concentration, with the top five providers — AWS, Microsoft, Google, Salesforce, and IBM — collectively holding an estimated 55–65% of global revenue. The remaining share is fragmented across dozens of specialized players, open-source ecosystem vendors, and regional cloud providers. An approximate Herfindahl-Hirschman Index (HHI) of 1,100–1,400 signals a moderately competitive landscape where scale advantages coexist with niche differentiation opportunities.

Company Est. Revenue Share Range Key Offerings for Platform as a Service Market Strategic Positioning
Amazon Web Services ~18–22% Lambda, Elastic Beanstalk, RDS, Aurora, AppRunner Broadest service catalog; serverless and database PaaS leader
Microsoft Corporation ~16–20% Azure App Service, Azure SQL, Power Platform, Azure Functions Enterprise hybrid-cloud integration; developer platform services depth
Google LLC (Alphabet) ~8–12% App Engine, Cloud Run, BigQuery, Firebase, Vertex AI AI-native PaaS and data analytics differentiation
Salesforce Inc. ~5–8% Heroku, Lightning Platform, MuleSoft, Tableau Cloud CRM-adjacent PaaS; low-code and integration strength
IBM Corporation ~4–6% Cloud Pak suite, Red Hat OpenShift, watsonx.ai Hybrid-cloud and open-source Kubernetes leadership
Oracle Corporation ~4–6% OCI, Autonomous Database, APEX Database PaaS legacy; enterprise ERP migration path
SAP SE ~3–5% SAP BTP (Business Technology Platform), HANA Cloud ERP-centric vertical PaaS for manufacturing and logistics
Alibaba Cloud ~3–5% Alibaba Cloud Container Service, AnalyticDB, Function Compute Dominant APAC presence; e-commerce platform heritage
ServiceNow Inc. ~2–4% Now Platform, App Engine, Integration Hub IT-workflow PaaS; enterprise service-management automation
Informatica Inc. ~1–3% IDMC (Intelligent Data Management Cloud), iPaaS connectors Data-integration and governance-focused PaaS specialist


Recent News & Developments

  • June 2025: Oracle and Google Cloud announced a multicloud partnership that permits Oracle Database services to operate in Google facilities, allowing joint clients to integrate AI and analytics workflows.
  • May 2025: Microsoft reported a 33% year-over-year increase in Azure revenue, attributing 16 percentage points of that growth to AI services as businesses integrate large-language-model capabilities into their apps.
  • March 2025: According to Flexera's 2025 State of the Cloud study, 79% of participants use AWS, 77% use Azure, and one-third spend more than $12 million a year on public cloud services.

Platform as a Service Market Report Scope

Parameter Detail
Market Scope Global Platform as a Service Market — by Type, Deployment Model, End-User Industry, Organization Size, Geography
Study Period 2021–2035
CAGR 15.1% (2026–2035)
Base-Year Market Size USD 150.80 Billion (2025)
Forecast-Year Market Size USD 617.30 Billion (2035)
Fastest Growing Segment Integration PaaS (by Type); Hybrid PaaS (by Deployment); Healthcare (by End-User)
Companies Profiled AWS, Microsoft, Google, Salesforce, IBM, Oracle, SAP, Alibaba Cloud, ServiceNow, Informatica
Valuation Currency USD Billion


FAQs

How does vendor lock-in practically affect PaaS procurement decisions?

Lock-in raises migration costs to 30–40% of workload TCO, so procurement teams should mandate open APIs and container-portable runtimes in vendor contracts. Prioritizing Kubernetes-native platforms reduces future switching friction [15].

What pricing model delivers the best cost predictability for PaaS budgets?

Committed-use discounts (one- or three-year reservations) cut PaaS bills by 25–40% versus on-demand pricing. Pair them with real-time cost-monitoring tools to avoid budget overruns on variable workloads [18].

How should regulated industries approach PaaS compliance for the Platform as a Service Market?

Select platforms with built-in compliance certifications (FedRAMP, HIPAA, PCI-DSS) rather than retrofitting controls post-deployment. Pre-certified environments reduce audit timelines by up to 60% [16].

What role does Kubernetes play in the Platform as a Service Market today?

Kubernetes has become the de facto orchestration layer, underpinning managed PaaS offerings from all major hyperscalers. Over 84% of CNCF-surveyed organizations run Kubernetes in production as of 2024 [15].

How are Platform as a Service Market vendors differentiating through AI capabilities?

Leading providers embed foundation-model APIs, vector databases, and automated ML pipelines directly into their PaaS stacks. This tight integration converts AI experimentation into recurring platform consumption [8].

What integration challenges arise when linking Platform as a Service Market solutions with legacy ERP systems?

Legacy ERPs use proprietary data formats and batch-processing cycles that clash with event-driven PaaS architectures. Pre-built iPaaS connectors from vendors like MuleSoft and Boomi bridge this gap [24].

How does the Platform as a Service Market address sustainability and carbon-reporting requirements?

Major hyperscalers now offer carbon dashboards and renewable-energy region selection within their PaaS consoles. CSRD-mandated Scope 3 disclosure is accelerating enterprise demand for these features [21].    
Author
Author
Author Profile
Apoorva Priyadarshi LinkedIn
Research Analyst
With 4+ years of experience in Market Intelligence and Strategic Research, Apoorv specializes in ICT, Semiconductor, and BFSI markets. Combining strong analytical capabilities with a deep understanding of technology-driven industries, he focuses on delivering data-driven insights that support strategic decision-making. With a background in technology and business research, Apoorv has contributed to numerous global market studies, competitive landscape analyses, and opportunity assessments across sectors such as semiconductors, digital banking, cybersecurity, and telecommunications.
Co-Author
Co-Author Profile
Shubham Munde LinkedIn
Team Lead - Research
Shubham brings over 7 years of expertise in Market Intelligence and Strategic Consulting, with a strong focus on the Automotive, Aerospace, and Defense sectors. Backed by a solid foundation in semiconductors, electronics, and software, he has successfully delivered high-impact syndicated and custom research on a global scale. His core strengths include market sizing, forecasting, competitive intelligence, consumer insights, and supply chain mapping. Widely recognized for developing scalable growth strategies, Shubham empowers clients to navigate complex markets and achieve a lasting competitive edge. Trusted by start-ups and Fortune 500 companies alike, he consistently converts challenges into strategic opportunities that drive sustainable growth.

Research Approach


Secondary Research

The secondary research process encompassed a rigorous analysis of cloud computing regulatory frameworks, technology standards, peer-reviewed journals, and authoritative industry databases. Key sources included the National Institute of Standards and Technology (NIST) Cloud Computing Standards, International Telecommunication Union (ITU) sector reports, European Union Agency for Cybersecurity (ENISA) Cloud Security Publications, IEEE Cloud Computing Initiative, Cloud Native Computing Foundation (CNCF) Landscape Reports, Cloud Security Alliance (CSA) Guidance Documents, International Organization for Standardization (ISO/IEC 27017/27018) cloud security standards, US Securities and Exchange Commission (SEC) 10-K filings of public cloud vendors, Gartner Magic Quadrants for Cloud Infrastructure and Platform Services, IDC Worldwide Semiannual Public Cloud Services Spending Guides, Synergy Research Group Cloud Market Share Reports, Forrester Wave evaluations, OECD Digital Economy Outlook, World Economic Forum Digital Transformation reports, and national digital transformation strategies from key markets (US Federal Cloud Computing Strategy, EU Digital Decade Policy, China's 14th Five-Year Plan for Digital Economy). These sources were utilized to collect market sizing data, regulatory compliance requirements, technology adoption trends, security protocol standards, and competitive landscape analysis for public PaaS, private PaaS, hybrid deployment models, and industry-specific platform solutions.


Primary Research

During the original research phase, both supply-side and demand-side stakeholders were interviewed to get both qualitative and quantitative information about how platforms are adopted, how people move from one platform to another, and how they choose a vendor. On the supply side, there were Chief Technology Officers, VPs of Cloud Engineering, heads of Product Management, and business development professionals from hyperscale cloud providers, independent PaaS suppliers, and container platform firms. Chief Information Officers, Enterprise Architects, DevOps directors, and procurement leads from Fortune 500 businesses, mid-market companies, SaaS startups, and system integrators in the banking, healthcare, retail, and manufacturing sectors were all sources of demand. Primary research confirmed service segmentation, product roadmap dates, and acquired information on multi-cloud strategies, changes in pricing models (from consumption-based to subscription), and patterns in modernizing legacy systems.

Primary Respondent Breakdown:

• By Designation: C-level Executives (30%), VP/Director Level (35%), Others (35%)

• By Region: North America (40%), Europe (25%), Asia-Pacific (28%), Rest of World (7%)


Market Size Estimation

Global market valuation was derived through revenue mapping and consumption metric analysis. The methodology included:

• Identification of 60+ key platform vendors across public cloud hyperscalers, independent PaaS providers, and specialized container platform vendors

• Service mapping across application PaaS (aPaaS), integration PaaS (iPaaS), database PaaS (dbPaaS), business analytics PaaS, and mobile/backend PaaS segments

• Analysis of reported and modeled annual revenues specific to platform services portfolios, including infrastructure software allocations and developer tools revenue

• Coverage of vendors representing 75-80% of global market share in 2024

• Extrapolation using bottom-up (active developer accounts × ARPU by deployment type) and top-down (vendor revenue validation against reported cloud segments) approaches to derive segment-specific valuations across public, private, and hybrid deployment models

Download Free Sample

Kindly complete the form below to receive a free sample of this Report

Download PDF ×

We do not share your information with anyone. However, we may send you emails based on your report interest from time to time. You may contact us at any time to opt-out.