ID: MRFR/ICT/2236-CR | February 2020 | Region: Global | 87 Pages
1 EXECUTIVE SUMMARY
1.1 MARKET ATTRACTIVENESS ANALYSIS 15
2 MARKET INTRODUCTION
2.1 DEFINITION 16
2.2 SCOPE OF THE STUDY 16
2.3 RESEARCH OBJECTIVE 16
2.4 MARKET STRUCTURE 16
3 RESEARCH METHODOLOGY
3.1 RESEARCH PROCESS 17
3.2 PRIMARY RESEARCH 18
3.3 SECONDARY RESEARCH 19
3.4 MARKET SIZE ESTIMATION 19
3.5 FORECAST MODEL 21
3.6 LIST OF ASSUMPTIONS 22
4 MARKET DYNAMICS
4.1 INTRODUCTION 23
4.2 DRIVERS 24
4.2.1 RAPID URBANIZATION 24
4.2.2 HIGH-QUALITY SERVICES 24
4.2.3 DRIVERS IMPACT ANALYSIS 25
4.3 RESTRAINTS 25
4.3.1 DATA PRIVACY AND SECURITY CONCERNS 25
4.3.2 RESTRAINTS IMPACT ANALYSIS 26
4.4 OPPORTUNITIES 26
4.4.1 RAPID ADOPTION OF AUTONOMOUS VEHICLE TECHNOLOGIES 26
4.5 CHALLENGES 27
4.5.1 REGULATORY CHALLENGES 27
4.6 PRICING MODEL 27
4.6.1 PAY-AS-YOU-GO 27
4.6.2 MONTHLY SUBSCRIPTION PLANS 27
4.7 BEST PRACTICE 28
4.7.1 MOBILITY AS A SERVICE (MAAS) SOLUTION FOR PUBLIC TRANSPORTATION CONSUMERS 28
5 MARKET FACTOR ANALYSIS
5.1 VALUE CHAIN ANALYSIS 29
5.2 PORTERβS FIVE FORCES MODEL 30
5.2.1 THREAT OF NEW ENTRANTS 30
5.2.2 BARGAINING POWER OF SUPPLIERS 31
5.2.3 THREAT OF SUBSTITUTES 31
5.2.4 BARGAINING POWER OF BUYERS 31
5.2.5 INTENSITY OF RIVALRY 31
6 GLOBAL MOBILITY AS A SERVICE MARKET, BY TYPE
6.1 OVERVIEW 32
6.2 PUBLIC 32
6.3 PRIVATE 32
7 GLOBAL MOBILITY AS A SERVICE MARKET, BY SERVICE TYPE
7.1 OVERVIEW 34
7.2 CAR 34
7.3 BUS 34
7.4 BIKE 34
8 GLOBAL MOBILITY AS A SERVICE MARKET, BY BUSINESS MODEL
8.1 OVERVIEW 37
8.2 BUSINESS-TO-BUSINESS (B2B ) 37
8.3 BUSINESS-TO-CUSTOMER (B2C) 37
8.4 PEER-TO-PEER (P2P) 37
9 GLOBAL MOBILITY AS A SERVICE MARKET, BY APPLICATION PLATFORM
9.1 OVERVIEW 40
9.2 ANDROID 40
9.3 IOS 40
9.4 OTHERS 40
10 GLOBAL MOBILITY AS A SERVICE MARKET, BY REGION
10.1 OVERVIEW 43
10.2 NORTH AMERICA 45
10.2.1 US 47
10.2.2 CANADA 49
10.2.3 MEXICO 51
10.3 EUROPE 53
10.3.1 UK 56
10.3.2 GERMANY 58
10.3.3 FRANCE 60
10.3.4 REST OF EUROPE 62
10.4 ASIA-PACIFIC 64
10.4.1 CHINA 67
10.4.2 INDIA 70
10.4.3 JAPAN 73
10.4.4 REST OF ASIA-PACIFIC 76
10.5 REST OF THE WORLD 78
10.5.1 MIDDLE EAST AND AFRICA 80
10.5.2 SOUTH AMERICA 82
11 COMPETITIVE LANDSCAPE
12 COMPANY PROFILES
12.1 DAIMLER AG 86
12.1.1 COMPANY OVERVIEW 86
12.1.2 FINANCIAL OVERVIEW 87
12.1.3 PRODUCTS/SOLUTIONS/SERVICES OFFERED 87
12.1.4 KEY DEVELOPMENTS 88
12.1.5 SWOT ANALYSIS 89
12.1.6 KEY STRATEGIES 89
12.2 BAYERISCHE MOTOREN WERKE AG 90
12.2.1 COMPANY OVERVIEW 90
12.2.2 FINANCIAL OVERVIEW 91
12.2.3 PRODUCTS/SOLUTIONS/SERVICES OFFERED 91
12.2.4 KEY DEVELOPMENTS 92
12.2.5 SWOT ANALYSIS 92
12.2.6 KEY STRATEGIES 93
12.3 DEUTSCHE BAHN 94
12.3.1 COMPANY OVERVIEW 94
12.3.2 FINANCIAL OVERVIEW 95
12.3.3 PRODUCTS/ SOLUTIONS/ SERVICES OFFERED 95
12.3.4 KEY DEVELOPMENTS 96
12.3.5 SWOT ANALYSIS 96
12.3.6 KEY STRATEGIES 97
12.4 XEROX CORPORATION 98
12.4.1 COMPANY OVERVIEW 98
12.4.2 FINANCIAL OVERVIEW 99
12.4.3 PRODUCTS/ SOLUTIONS/ SERVICES OFFERED 99
12.4.4 KEY DEVELOPMENTS 100
12.4.5 SWOT ANALYSIS 100
12.4.6 KEY STRATEGIES 101
12.5 LYFT, INC 102
12.5.1 COMPANY OVERVIEW 102
12.5.2 FINANCIAL OVERVIEW 102
12.5.3 PRODUCTS/ SOLUTIONS/ SERVICES OFFERED 102
12.5.4 KEY DEVELOPMENTS 103
12.5.5 SWOT ANALYSIS 103
12.5.6 KEY STRATEGIES 104
12.6 MAAS GLOBAL OY 105
12.6.1 COMPANY OVERVIEW 105
12.6.2 FINANCIAL OVERVIEW 105
12.6.3 PRODUCTS/SOLUTIONS/SERVICES OFFERED 105
12.6.4 KEY DEVELOPMENTS 105
12.6.5 KEY STRATEGIES 105
12.7 GRABTAXI HOLDINGS PTE LTD 106
12.7.1 COMPANY OVERVIEW 106
12.7.2 FINANCIAL OVERVIEW 106
12.7.3 PRODUCTS/SOLUTIONS/SERVICES OFFERED 106
12.7.4 KEY DEVELOPMENTS 107
12.7.5 KEY STRATEGIES 107
12.8 BEIJING XIAOJU TECHNOLOGY CO., LTD (DIDI CHUXING) 108
12.8.1 COMPANY OVERVIEW 108
12.8.2 FINANCIAL OVERVIEW 108
12.8.3 PRODUCTS/SOLUTIONS/SERVICES OFFERED 108
12.8.4 KEY DEVELOPMENTS 109
12.8.5 KEY STRATEGIES 109
12.9 UBER TECHNOLOGIES INC. 110
12.9.1 COMPANY OVERVIEW 110
12.9.2 FINANCIAL OVERVIEW 110
12.9.3 PRODUCTS/SOLUTIONS/SERVICES OFFERED 110
12.9.4 KEY DEVELOPMENTS 111
12.9.5 KEY STRATEGIES 111
12.10 COMMUNAUTO 112
12.10.1 COMPANY OVERVIEW 112
12.10.2 FINANCIAL OVERVIEW 112
12.10.3 PRODUCTS/ SOLUTIONS/ SERVICES OFFERED 112
12.10.4 KEY DEVELOPMENTS 112
12.10.5 KEY STRATEGIES 112
12.11 MOOVIT INC. 113
12.11.1 COMPANY OVERVIEW 113
12.11.2 FINANCIAL OVERVIEW 113
12.11.3 PRODUCTS/SOLUTIONS/SERVICES OFFERED 113
12.11.4 KEY DEVELOPMENTS 113
12.11.5 KEY STRATEGIES 113
12.12 ANI TECHNOLOGIES PVT. LTD (OLA) 114
12.12.1 COMPANY OVERVIEW 114
12.12.2 FINANCIAL OVERVIEW 114
12.12.3 PRODUCTS/SOLUTIONS/SERVICES OFFERED 114
12.12.4 KEY DEVELOPMENTS 114
12.12.5 KEY STRATEGIES 115
12.13 BRIDJ PTY. LTD 116
12.13.1 COMPANY OVERVIEW 116
12.13.2 FINANCIAL OVERVIEW 116
12.13.3 PRODUCTS/SOLUTIONS/SERVICES OFFERED 116
12.13.4 KEY DEVELOPMENTS 116
12.13.5 KEY STRATEGIES 116
12.14 JAPANTAXI CO., LTD 117
12.14.1 COMPANY OVERVIEW 117
12.14.2 FINANCIAL OVERVIEW 117
12.14.3 PRODUCTS/SOLUTIONS/SERVICES OFFERED 117
12.14.4 KEY DEVELOPMENTS 117
12.14.5 KEY STRATEGIES 117
12.15 WIWIGO 118
12.15.1 COMPANY OVERVIEW 118
12.15.2 FINANCIAL OVERVIEW 118
12.15.3 PRODUCTS/ SOLUTIONS/ SERVICES OFFERED 118
12.15.4 KEY DEVELOPMENTS 118
12.15.5 KEY STRATEGIES 118
13 LIST OF TABLES
TABLE 1 PRIMARY INTERVIEWS 18
TABLE 2 LIST OF ASSUMPTIONS 22
TABLE 3 GLOBAL MOBILITY AS A SERVICE MARKET, BY TYPE, 2020β2027 (USD BILLION) 33
TABLE 4 GLOBAL MOBILITY AS A SERVICE MARKET, BY SERVICE TYPE, 2020β2027 (USD BILLION) 36
TABLE 5 GLOBAL MOBILITY AS A SERVICE MARKET, BY BUSINESS MODEL, 2020β2027 (USD BILLION) 39
TABLE 6 GLOBAL MOBILITY AS A SERVICE MARKET, BY APP PLATFORM, 2020β2027 (USD BILLION) 42
TABLE 7 GLOBAL MOBILITY AS A SERVICE MARKET, BY REGION, 2020β2027 (USD BILLION) 44
TABLE 8 NORTH AMERICA: MOBILITY AS A SERVICE MARKET, BY COUNTRY, 2020β2027 (USD BILLION) 45
TABLE 9 NORTH AMERICA: MOBILITY AS A SERVICE MARKET, BY TYPE, 2020β2027 (USD BILLION) 46
TABLE 10 NORTH AMERICA: MOBILITY AS A SERVICE MARKET, BY SERVICE TYPE, 2020β2027 (USD BILLION) 46
TABLE 11 NORTH AMERICA: MOBILITY AS A SERVICE MARKET, BY BUSINESS MODEL, 2020β2027 (USD BILLION) 46
TABLE 12 NORTH AMERICA: MOBILITY AS A SERVICE MARKET, BY APP PLATFORM, 2020β2027 (USD BILLION) 47
TABLE 13 US: MOBILITY AS A SERVICE MARKET, BY TYPE, 2020β2027 (USD BILLION) 47
TABLE 14 US: MOBILITY AS A SERVICE MARKET, BY SERVICE TYPE, 2020β2027 (USD BILLION) 48
TABLE 15 US: MOBILITY AS A SERVICE MARKET, BY BUSINESS MODEL, 2020β2027 (USD BILLION) 48
TABLE 16 US: MOBILITY AS A SERVICE MARKET, BY APP PLATFORM, 2020β2027 (USD BILLION) 48
TABLE 17 CANADA: MOBILITY AS A SERVICE MARKET, BY TYPE, 2020β2027 (USD BILLION) 49
TABLE 18 CANADA: MOBILITY AS A SERVICE MARKET, BY SERVICE TYPE, 2020β2027 (USD BILLION) 49
TABLE 19 CANADA: MOBILITY AS A SERVICE MARKET, BY BUSINESS MODEL, 2020β2027 (USD BILLION) 50
TABLE 20 CANADA: MOBILITY AS A SERVICE MARKET, BY APP PLATFORM, 2020β2027 (USD BILLION) 50
TABLE 21 MEXICO: MOBILITY AS A SERVICE MARKET, BY TYPE, 2020β2027 (USD BILLION) 51
TABLE 22 MEXICO: MOBILITY AS A SERVICE MARKET, BY SERVICE TYPE, 2020β2027 (USD BILLION) 51
TABLE 23 MEXICO: MOBILITY AS A SERVICE MARKET, BY BUSINESS MODEL, 2020β2027 (USD BILLION) 52
TABLE 24 MEXICO: MOBILITY AS A SERVICE MARKET, BY APP PLATFORM, 2020β2027 (USD BILLION) 52
TABLE 25 EUROPE: MOBILITY AS A SERVICE MARKET, BY REGION, 2020β2027 (USD BILLION) 53
TABLE 26 EUROPE: MOBILITY AS A SERVICE MARKET, BY TYPE, 2020β2027 (USD BILLION) 54
TABLE 27 EUROPE: MOBILITY AS A SERVICE MARKET, BY SERVICE TYPE, 2020β2027 (USD BILLION) 54
TABLE 28 EUROPE: MOBILITY AS A SERVICE MARKET, BY BUSINESS MODEL, 2020β2027 (USD BILLION) 54
TABLE 29 EUROPE: MOBILITY AS A SERVICE MARKET, BY APP PLATFORM, 2020β2027 (USD BILLION) 55
TABLE 30 UK: MOBILITY AS A SERVICE MARKET, BY TYPE, 2020β2027 (USD BILLION) 56
TABLE 31 UK: MOBILITY AS A SERVICE MARKET, BY SERVICE TYPE, 2020β2027 (USD BILLION) 57
TABLE 32 UK: MOBILITY AS A SERVICE MARKET, BY BUSINESS MODEL, 2020β2027 (USD BILLION) 57
TABLE 33 UK: MOBILITY AS A SERVICE MARKET, BY APP PLATFORM, 2020β2027 (USD BILLION) 57
TABLE 34 GERMANY: MOBILITY AS A SERVICE MARKET, BY TYPE, 2020β2027 (USD BILLION) 58
TABLE 35 GERMANY: MOBILITY AS A SERVICE MARKET, BY SERVICE TYPE, 2020β2027 (USD BILLION) 58
TABLE 36 GERMANY: MOBILITY AS A SERVICE MARKET, BY BUSINESS MODEL, 2020β2027 (USD BILLION) 59
TABLE 37 GERMANY: MOBILITY AS A SERVICE MARKET, BY APP PLATFORM, 2020β2027 (USD BILLION) 59
TABLE 38 FRANCE: MOBILITY AS A SERVICE MARKET, BY TYPE, 2020β2027 (USD BILLION) 60
TABLE 39 FRANCE: MOBILITY AS A SERVICE MARKET, BY SERVICE TYPE, 2020β2027 (USD BILLION) 60
TABLE 40 FRANCE: MOBILITY AS A SERVICE MARKET, BY BUSINESS MODEL, 2020β2027 (USD BILLION) 61
TABLE 41 FRANCE: MOBILITY AS A SERVICE MARKET, BY APP PLATFORM, 2020β2027 (USD BILLION) 61
TABLE 42 REST OF EUROPE: MOBILITY AS A SERVICE MARKET, BY TYPE, 2020β2027 (USD BILLION) 62
TABLE 43 REST OF EUROPE: MOBILITY AS A SERVICE MARKET, BY SERVICE TYPE, 2020β2027 (USD BILLION) 62
TABLE 44 REST OF EUROPE: MOBILITY AS A SERVICE MARKET, BY BUSINESS MODEL, 2020β2027 (USD BILLION) 63
TABLE 45 REST OF EUROPE: MOBILITY AS A SERVICE MARKET, BY APP PLATFORM, 2020β2027 (USD BILLION) 63
TABLE 46 VENTURE CAPITAL FUNDING IN MOBILITY AS A SERVICE MARKET (2020β2020) 64
TABLE 47 ASIA-PACIFIC: MOBILITY AS A SERVICE MARKET, BY COUNTRY, 2020β2027 (USD BILLION) 65
TABLE 48 ASIA-PACIFIC: MOBILITY AS A SERVICE MARKET, BY TYPE, 2020β2027 (USD BILLION) 65
TABLE 49 ASIA-PACIFIC: MOBILITY AS A SERVICE MARKET, BY SERVICE TYPE, 2020β2027 (USD BILLION) 65
TABLE 50 ASIA-PACIFIC: MOBILITY AS A SERVICE MARKET, BY BUSINESS MODEL, 2020β2027 (USD BILLION) 66
TABLE 51 ASIA-PACIFIC: MOBILITY AS A SERVICE MARKET, BY APP PLATFORM, 2020β2027 (USD BILLION) 66
TABLE 52 CAR-SHARING OVERVIEW IN CHINA (2020) 67
TABLE 53 CHINA: MOBILITY AS A SERVICE MARKET, BY TYPE, 2020β2027 (USD BILLION) 68
TABLE 54 CHINA: MOBILITY AS A SERVICE MARKET, BY SERVICE TYPE, 2020β2027 (USD BILLION) 68
TABLE 55 CHINA: MOBILITY AS A SERVICE MARKET, BY BUSINESS MODEL, 2020β2027 (USD BILLION) 68
TABLE 56 CHINA: MOBILITY AS A SERVICE MARKET, BY APP PLATFORM, 2020β2027 (USD BILLION) 69
TABLE 57 INDIA: MOBILITY AS A SERVICE MARKET, BY TYPE, 2020β2027 (USD BILLION) 71
TABLE 58 INDIA: MOBILITY AS A SERVICE MARKET, BY SERVICE TYPE, 2020β2027 (USD BILLION) 71
TABLE 59 INDIA: MOBILITY AS A SERVICE MARKET, BY BUSINESS MODEL, 2020β2027 (USD BILLION) 71
TABLE 60 INDIA: MOBILITY AS A SERVICE MARKET, BY APP PLATFORM, 2020β2027 (USD BILLION) 72
TABLE 61 FARE DIVISION IN TOKYO (2020) 73
TABLE 62 JAPAN: MOBILITY AS A SERVICE MARKET, BY TYPE, 2020β2027 (USD BILLION) 74
TABLE 63 JAPAN: MOBILITY AS A SERVICE MARKET, BY SERVICE TYPE, 2020β2027 (USD BILLION) 74
TABLE 64 JAPAN: MOBILITY AS A SERVICE MARKET, BY BUSINESS MODEL, 2020β2027 (USD BILLION) 75
TABLE 65 JAPAN: MOBILITY AS A SERVICE MARKET, BY APP PLATFORM, 2020β2027 (USD BILLION) 75
TABLE 66 REST OF ASIA-PACIFIC: MOBILITY AS A SERVICE MARKET, BY TYPE, 2020β2027 (USD BILLION) 76
TABLE 67 REST OF ASIA-PACIFIC: MOBILITY AS A SERVICE MARKET, BY SERVICE TYPE, 2020β2027 (USD BILLION) 76
TABLE 68 REST OF ASIA-PACIFIC: MOBILITY AS A SERVICE MARKET, BY BUSINESS MODEL, 2020β2027 (USD BILLION) 77
TABLE 69 REST OF ASIA-PACIFIC: MOBILITY AS A SERVICE MARKET, BY APP PLATFORM, 2020β2027 (USD BILLION) 77
TABLE 70 REST OF THE WORLD: MOBILITY AS A SERVICE MARKET, BY REGION, 2020β2027 (USD BILLION) 78
TABLE 71 REST OF THE WORLD: MOBILITY AS A SERVICE MARKET, BY TYPE, 2020β2027 (USD BILLION) 78
TABLE 72 REST OF THE WORLD: MOBILITY AS A SERVICE MARKET, BY SERVICE TYPE, 2020β2027 (USD BILLION) 79
TABLE 73 REST OF THE WORLD: MOBILITY AS A SERVICE MARKET, BY BUSINESS MODEL, 2020β2027 (USD BILLION) 79
TABLE 74 REST OF THE WORLD: MOBILITY AS A SERVICE MARKET, BY APP PLATFORM, 2020β2027 (USD BILLION) 79
TABLE 75 MIDDLE EAST AND AFRICA: MOBILITY AS A SERVICE MARKET, BY TYPE, 2020β2027 (USD BILLION) 80
TABLE 76 MIDDLE EAST AND AFRICA: MOBILITY AS A SERVICE MARKET, BY SERVICE TYPE, 2020β2027 (USD BILLION) 80
TABLE 77 MIDDLE EAST AND AFRICA: MOBILITY AS A SERVICE MARKET, BY BUSINESS MODEL, 2020β2027 (USD BILLION) 81
TABLE 78 MIDDLE EAST AND AFRICA: MOBILITY AS A SERVICE MARKET, BY APP PLATFORM, 2020β2027 (USD BILLION) 81
TABLE 79 SOUTH AMERICA: MOBILITY AS A SERVICE MARKET, BY TYPE, 2020β2027 (USD BILLION) 82
TABLE 80 SOUTH AMERICA: MOBILITY AS A SERVICE MARKET, BY SERVICE TYPE, 2020β2027 (USD BILLION) 82
TABLE 81 SOUTH AMERICA: MOBILITY AS A SERVICE MARKET, BY BUSINESS MODEL, 2020β2027 (USD BILLION) 83
TABLE 82 SOUTH AMERICA: MOBILITY AS A SERVICE MARKET, BY APP PLATFORM, 2020β2027 (USD BILLION) 83
TABLE 83 DAILMER AG: PRODUCTS/SOLUTIONS/SERVICES OFFERED 87
TABLE 84 DAILMER AG: KEY DEVELOPMENTS 88
TABLE 85 BAYERISCHE MOTOREN WERKE AG (BMW): PRODUCTS/SOLUTIONS/SERVICES OFFERED 91
TABLE 86 BAYERISCHE MOTOREN WERKE AG (BMW): KEY DEVELOPMENTS 92
TABLE 87 DEUTSCHE BAHN: PRODUCTS/ SERVICES OFFERED 95
TABLE 88 DEUTSCHE BAHN: KEY DEVELOPMENTS 96
TABLE 89 XEROX CORPORATION: PRODUCTS/ SOLUTIONS/ SERVICES OFFERED 99
TABLE 90 XEROX CORPORATION: KEY DEVELOPMENTS 100
TABLE 91 LYFT, INC: PRODUCTS OFFERED 102
TABLE 92 LYFT, INC: KEY DEVELOPMENTS 103
TABLE 93 MAAS GLOBAL OY: PRODUCTS/SOLUTIONS/SERVICES OFFERED 105
TABLE 94 MAAS GLOBAL OY: KEY DEVELOPMENTS 105
TABLE 95 GRABTAXI HOLDINGS PTE LTD (GRAB): PRODUCTS/SOLUTIONS/SERVICES OFFERED 106
TABLE 96 GRABTAXI HOLDINGS PTE LTD (GRAB): KEY DEVELOPMENTS 107
TABLE 97 BEIJING XIAOJU TECHNOLOGY CO., LTD: PRODUCTS/SOLUTIONS/SERVICES OFFERED 108
TABLE 98 BEIJING XIAOJU TECHNOLOGY CO., LTD : KEY DEVELOPMENTS 109
TABLE 99 UBER TECHNOLOGIES, INC.: PRODUCTS/SOLUTIONS/SERVICES OFFERED 110
TABLE 100 UBER TECHNOLOGIES, INC.: KEY DEVELOPMENTS 111
TABLE 101 COMMUNAUTO: PRODUCTS/ SERVICES OFFERED 112
TABLE 102 COMMUNAUTO: KEY DEVELOPMENTS 112
TABLE 103 MOOVIT INC: PRODUCTS/SOLUTIONS/SERVICES OFFERED 113
TABLE 104 MOOVIT INC. : KEY DEVELOPMENTS 113
TABLE 105 OLA: PRODUCTS/SOLUTIONS/SERVICES OFFERED 114
TABLE 106 OLA : KEY DEVELOPMENTS 114
TABLE 107 BRIDJ PTY LTD: PRODUCTS/SOLUTIONS/SERVICES OFFERED 116
TABLE 108 BRIDJ PTY LTD : KEY DEVELOPMENTS 116
TABLE 109 JAPANTAXI CO., LTD: PRODUCTS/SOLUTIONS/SERVICES OFFERED 117
TABLE 110 JAPANTAXI CO., LTD: KEY DEVELOPMENTS 117
TABLE 111 WIWIGO: PRODUCTS/ SERVICES OFFERED 118
TABLE 112 WIWIGO: KEY DEVELOPMENTS 118
14 LIST OF FIGURES
FIGURE 1 MARKET SYNOPSIS 14
FIGURE 2 MARKET ATTRACTIVENESS ANALYSIS: GLOBAL MOBILITY AS A SERVICE MARKET 15
FIGURE 3 GLOBAL MOBILITY AS A SERVICE MARKET: STRUCTURE 16
FIGURE 4 RESEARCH PROCESS 17
FIGURE 5 TOP-DOWN & BOTTOM-UP APPROACHES 20
FIGURE 6 MARKET DYNAMICS OVERVIEW 23
FIGURE 7 DRIVERS IMPACT ANALYSIS: MOBILITY AS A SERVICE (MAAS) MARKET 25
FIGURE 8 RESTRAINTS IMPACT ANALYSIS: MOBILITY AS A SERVICE MARKET 26
FIGURE 9 VALUE CHAIN: GLOBAL MOBILITY AS A SERVICE MARKET 29
FIGURE 10 PORTERβS FIVE FORCES MODEL: GLOBAL MOBILITY AS A SERVICE MARKET 30
FIGURE 11 GLOBAL MOBILITY AS A SERVICE MARKET, BY TYPE, 2020 (% SHARE) 32
FIGURE 12 GLOBAL MOBILITY AS A SERVICE MARKET, BY TYPE, 2020 VS 2027 (USD BILLION) 33
FIGURE 13 GLOBAL MOBILITY AS A SERVICE MARKET, BY SERVICE TYPE, 2020 (% SHARE) 35
FIGURE 14 GLOBAL MOBILITY AS A SERVICE MARKET, BY SERVICE TYPE, 2020 VS 2027 (USD BILLION) 35
FIGURE 15 GLOBAL MOBILITY AS A SERVICE MARKET, BY BUSINESS MODEL, 2020 (% SHARE) 38
FIGURE 16 GLOBAL MOBILITY AS A SERVICE MARKET, BY BUSINESS MODEL, 2020 VS 2027 (USD BILLION) 38
FIGURE 17 GLOBAL MOBILITY AS A SERVICE MARKET, BY APPLICATION PLATFORM, 2020 (% SHARE) 41
FIGURE 18 GLOBAL MOBILITY AS A SERVICE MARKET, BY APPLICATION PLATFORM, 2020 VS 2027 (USD BILLION) 41
FIGURE 19 GLOBAL MOBILITY AS A SERVICE MARKET, BY REGION, 2020 (% SHARE) 43
FIGURE 20 GLOBAL MOBILITY AS A SERVICE MARKET, BY REGION, 2020 VS 2027 (USD MILLION) 44
FIGURE 21 PERCENTAGE OF FARE DIVISION IN TOKYO (2020) 73
$510.22 Billion
27.74%
North America
2020-2030
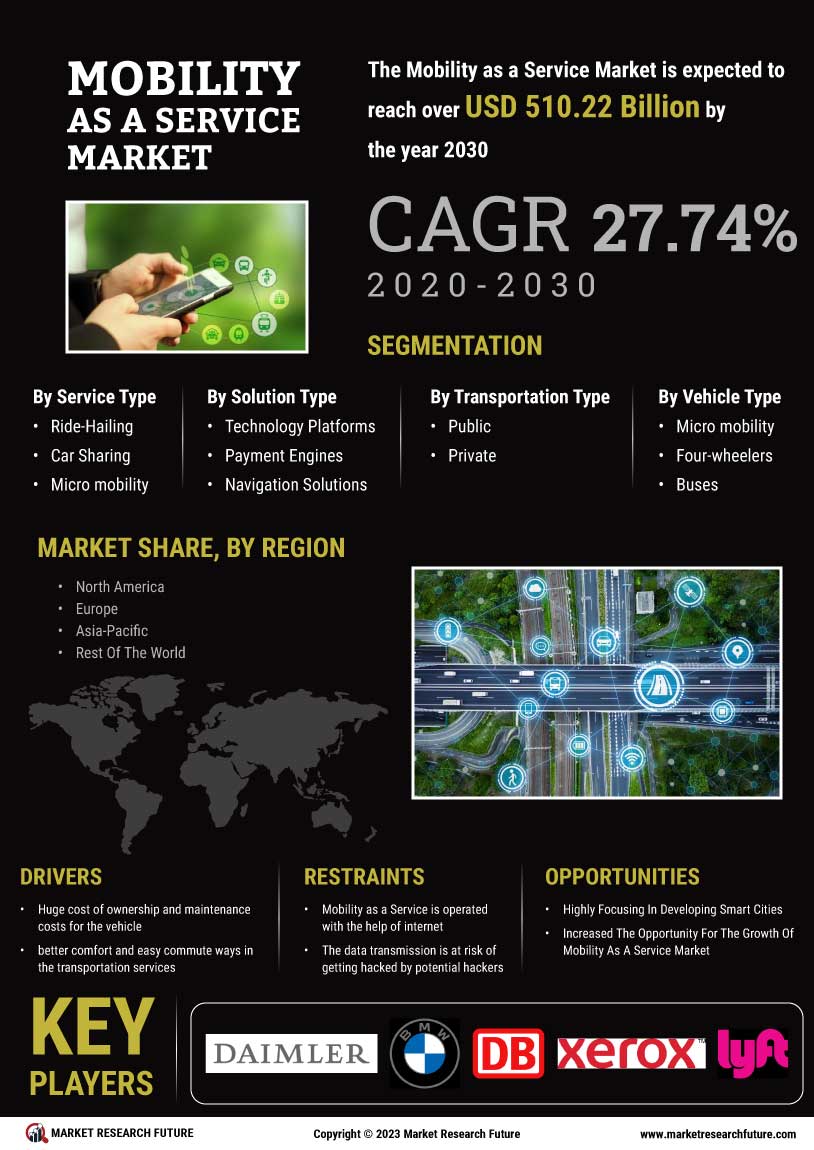
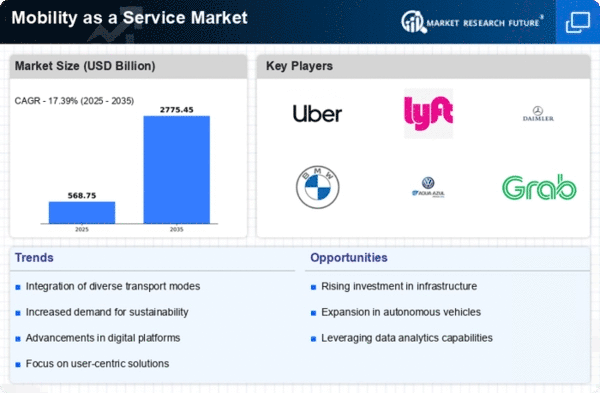
The Mobility as a Service Market is expected to reach over USD 510.22 Billion by the year 2030 registering a CAGR of 27.74%. Mobility as a Service operation is carried out by integrating various modes of transportation to a single platform with the help of mobile application. The technology helps the customer in planning the travel including the various transportation methods and payment details. The Mobility as a Service is customer centric and leads the customer to obtain energy efficient and cost efficient way of commute. Various modes of transportation can be accessed on demand. Mobility as a Service operation is carried out with the help of data service providers that acquires real-time information regarding weather and traffic. The transportation manufacturers and governmental bodies take higher responsibility for efficient functioning of MaaS.
Mobility as a Service works in collaboration with the various gateway options to help the customers pay digitally. The recent reports published by the World Health Organization shows that over 50% of world population are already living in urban areas where the roadway transportation is already congested. The percentage is likely to increase over 60% by 2025. The increasing population in the urban areas has increased the congestion in the roadways and created issues with the parking personal vehicles. The reduction of personal vehicle can slowly address the issue. Hence the Mobility as a Service market is likely to witness tremendous growth in the traffic congested areas.
COVID 19 Analysis of MaaS Market
The pandemic has prevented crowds and restricted the movement across the globe. The automotive industry like any other crucial industry has witnessed a sharp decline due to the health crisis. The rising health concerns due to the pandemic have increased the fear of spread of the disease in several countries. Hence a large number of people have reduced utilizing the services.
The public transport has stopped working in majority of countries. The work-from-home condition has reduced the overall transportation services. These factors have adversely affected the Mobility as a Service market value in the recent years. Unavailability of drivers for the infected people, fear among the public, cost of sanitation are some of the factors that impact the Mobility as a Service market.
Market dynamics
Market drivers
Instead of owing the vehicle and bearing a huge cost of ownership and maintenance costs for the vehicle, Mobility as a Service offers better comfort and easy commute ways in the transportation services. The insurance premium, fuel costs, parking expenses can be eliminated when the consumer prefers to use the MaaS technology. Additionally, the users are allowed to enjoy the perks of driving the personal vehicles without owning them. The payment is considerate and depends on the number of miles covered. Expenses like fuel, insurance, parking are covered by the service provider.
The countries who are largely focusing in reducing the carbon dioxide emission have encouraged their citizens to utilize the Mobility as a Service technology, the on growing usage of smartphones and enhanced 5G technology infrastructure have increased the Mobility as a Service market demand in the recent years.
Market opportunities
Several developed countries are highly focusing in developing smart cities and are increasingly investing in those projects. They have incorporated solutions that are eco-friendly in those smart cities. Hence there are stringent limitations involved in the usage of carbon emitting vehicles. These factors have increased the opportunity for the growth of Mobility as a Service market.
Several countries like Europe are increasingly adopting Electric vehicles and installing power stations to fuel these vehicles. Such factors are increasingly impacting the Mobility as a Service industry. Additionally the advent of autonomous taxis and vehicles has reduced transportation costs. Such factors have increased the demand of Mobility as a Service market.
Market restraints
Since the Mobility as a Service is operated with the help of internet, the data transmission is at risk of getting hacked by potential hackers. The payment details, personal details shared during the process involves risks. This factor is expected to impede the Mobility as a Service market growth.
The authority and leadership issues are the major challenge in the Mobility as a Service market. The private and public sector leaderships are essential to carry out the operations.
Market challenges
The effective functioning of Mobility as a Service market includes several sectors like telecom operators, service operators, manufacturers, automotive industry, public sector, user groups and so on. Hence the challenge might arise in any of these sectors.
Several governmental organizations will approve the project only if it imbibes with the Public-Private Partnership model. The model recommends the service provider to participate in any government initiatives. This factor is considered as the crucial restraining factor for the Mobility as a Service market.
The private transportation can function on demand, but the public transportation can’t. The supply and demand ratio plays vital role in this sector. This is also a major challenge in carrying out the project.
Cumulative growth analysis
The Mobility as a Service operators are capable of obtaining the real-time data about the weather, traffic, easy routes, costs incurred, various options and potentially all the information related to the travel with minimal hassle. The increasing utilization of smart phones and easy way of accessing using the mobile platforms has increased the overall demand for the Mobility as a Service industry. Currently, the global Mobility as a Service industry value is expected to reach over 485 billion by the year 2024 registering a CAGR of 39.40%. The integration of several platforms and sharing, leasing options have increased the popularity among the end-users.
As the countries who are highly investing in the eco-friendly products and services encourage the Mobility as a Service sector with their citizens which help in reducing the number of vehicles on the roads. The countries like Asia-pacific are increasingly suffering from road congestions which propelled the Mobility as a Service market growth in the recent years and expected to reach the mentioned value in the forecast period.
Value chain analysis
The countries that are increasingly suffering from road congestions are implementing projects like intra-city buses, metro projects, light rail, high-speed rail systems, and so on. Apart from all of those projects, the Mobility as a Service market is expected to witness tremendous growth owing to the services like traffic management, payment, self-driving unit, and autonomous vehicle driving, etc.
Consumers who are looking for a hassle-free commute prefer to choose Mobility as a Service for their regular commute to work or essential places. The proliferation of wifi, 5G, Bluetooth, IoT devices have increased the Mobility as a Service market value in recent years. The highly technological transportation, subscriptions schemes, and affordable transportation have encouraged customers to adopt the technology.
MaaS Market Segment overview
By Solution Type
MaaS Market By Vehicle Type
By Application Type
By Business Model
By Region
The Mobility as a Service market is expected to witness booming growth in the countries like North America, Europe, Asia-pacific. Among these countries, Europe is significantly focusing on developing solutions and services that are eco-friendly. They are thriving to reduce carbon emissions and introducing electric vehicles across the country. The economic conditions of these countries and the changing preference of consumers and riders have positively impacted the Mobility as a Service market in recent years.
Currently, North America is holding the second-largest revenue holder of the global Mobility as a Service market which was valued at USD 9.63 billion in the year 2018, despite the lockdown and the restrictions, the market is appearing to be booming in the forecast period.
Competitive landscape
Recent developments
To control the crowd and prevent the COVID spread, the Mobility as a Service market has incorporated technology that allows the passengers to choose quieter roads and forms of transports. The inclusion of cycles, e-scooters that encourage social distancing has helped in a great way during the lockdown. The technology was launched soon after the breakout of COVID, precisely in May 2020.
The on-demand solution helps the crucial workers and employees to commute to their workplace during the time of the pandemic. The transportation both public and private sectors have been closed during the lockdown which affected the crucial workers, health administrators to reach their workplace. The new solution deployed in such cities has helped the employees to commute without any fear of infection.
This report has covered
Segmentation Table
MaaS Market By Service Type
By Transportation Type
MaaS Market By Vehicle Type
By Application Type
By Business Model
By Region
Report Attribute/Metric | Details |
---|---|
Market Size | USD 510.22 Billion By 2030 |
CAGR | 27.74% From 2020 to 2030 |
Base Year | 2019 |
Forecast Period | 2020 to 2030 |
Historical Data | 2018 |
Forecast Units | Value (USD Billion) |
Report Coverage | Revenue Forecast, Competitive Landscape, Growth Factors, and Trends |
Segments Covered | By Type, Business Model |
Geographies Covered | North America, Europe, Asia-Pacific |
Key Vendors | Daimler AG (Germany) Bayerische Motoren Werke AG (BMW) (Germany) Deutsche Bahn (Germany) Xerox Corporation (US) Lyft Inc (US) MaaS Global Oy (Switzerland) GrabTaxi Holdings Pte Ltd (Singapore) Beijing Xiaoju Technology Co. Ltd (China) |
Key Market Opportunities | They have incorporated solutions that are eco-friendly in those smart cities. |
Key Market Drivers | The insurance premium, fuel costs, parking expenses can be eliminated when the consumer prefers to use the MaaS technology. |
Frequently Asked Questions (FAQ) :
The global MaaS market is expected to record a market value of USD 510.22 Billion in 2030.
The Mobility as a Service market is predicted to expand at a 27.74% CAGR over the review period.
The rapid expansion of public infrastructure and in regulatory policies, and the integration of telecom service providers, is expected to create opportunities for the market over the review period.
The MaaS system operates through the internet which can be susceptible to hackers which can impede the MaaS market growth over the forecast period.
The business to business (B2B) segment is expected to record the highest market share by 2024.
the European mobility as a service market is anticipated to witness highest growth at a CAGR of 37.1% over the review period.
A few market players in the global market for Mobility as a Service technology are Daimler AG (Germany), Bayerische Motoren Werke AG (BMW) (Germany), Deutsche Bahn (Germany), Xerox Corporation (US), Lyft, Inc (US), and others.