Plastic Processing Machinery Market (2026 - 2035)

Plastic Processing Machinery Market Research Report By Machine Type (Injection Molding, Blow Molding, Extrusion, Thermoforming, Others), By Automation Level (Semi-Automated, Fully-Automated), By End-User Industry (Packaging, Consumer Goods, Electrical & Electronics, Construction, Healthcare, Others) and By Regional (North America, Europe, South America, Asia Pacific, Middle East and Africa) - Forecast to 2035
ID: MRFR/Equip/8911-CR 110 Pages Snehal Singh Last Updated: October 16, 2026
Plastic Processing Machinery Market
Market Size
Forecast Period2026-2035
CAGR (2026-2035)4.85%
2025 Market SizeUSD 35.43 Billion
2035 Market SizeUSD 56.89 Billion
Key Players
Haitian International
ENGEL Austria
ARBURG
KraussMaffei Group
Milacron
Husky Technologies
Opportunities
  • Recycling and Reprocessing Equipment Lines
  • Aftermarket Services and Data Monetization
  • India and ASEAN Capacity Formalization

Plastic Processing Machinery Market Summary

The Plastic Processing Machinery Market reached USD 35.43 billion in 2025 and enters the forecast window at USD 37.15 billion in 2026, climbing to USD 56.89 billion by 2035 at a 4.85% CAGR. Growth is deliberate rather than dramatic. Two catalysts anchor it: the European Union's Packaging and Packaging Waste Regulation, which forces converters to retool for recyclable mono-material formats before 2030 deadlines [5], and India's production-linked incentive outlays for chemicals and petrochemicals, which have unlocked fresh converter capex across Gujarat and Tamil Nadu [12].

Capital budgets are shifting away from raw tonnage. Hydraulic presses and open-loop temperature control are giving way to servo-driven clamping, closed-loop process supervision, and traceability modules that log every shot. Vision-guided robotics and predictive maintenance layers now ship as standard on premium lines. European suppliers report that energy-efficiency retrofits alone can cut plant electricity draw by 30โ€“60%, a compelling case when industrial power tariffs across the EU averaged roughly EUR 0.19 per kWh [9]. The Plastic Processing Machinery Market is consequently being re-specified around precision and data, not horsepower.

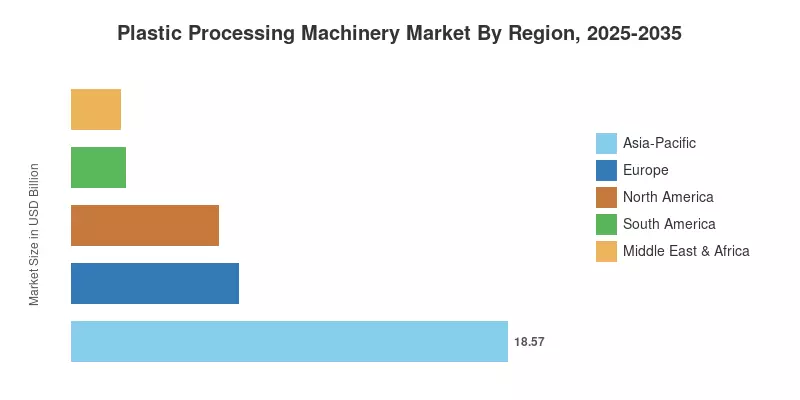
Asia-Pacific dominates with 52.4% of 2025 revenue, propelled by Chinese OEM cost leadership and Indian converter formalization. South America grows fastest at a 6.52% CAGR through 2035 as Brazilian food-packaging investment accelerates. Europe holds 20.1%, sustained by regulatory retooling rather than volume expansion. Over the next decade, the Plastic Processing Machinery Market will reward suppliers who convert one-time equipment sales into recurring service and software revenue.

ย 

Key Report Takeaways

โ€ข By Machine Type

  • Injection molding held 48.3% of the Plastic Processing Machinery Market share in 2025, anchored by packaging and automotive component volume.
  • Extrusion equipment generated USD 8.72 billion in 2025 revenue across film, pipe, and profile lines.
  • Thermoforming is advancing at a 5.6% CAGR through 2035 as fibre-and-film hybrid trays displace rigid formats.

โ€ข By Automation Level

  • Fully automated systems are projected to expand at a 6.55% CAGR between 2026 and 2035
  • Semi-automated configurations still represent 61.5% of installed value, concentrated in emerging-economy job shops.

โ€ข By End-User Industry

  • Packaging captured 44.6% of Plastic Processing Machinery Market share in 2025
  • Healthcare converters contributed USD 2.87 billion, the highest revenue-per-machine of any vertical.
  • Electrical and electronics demand is compounding at 5.4% annually on connector and enclosure volume.

โ€ข By Region

  • Asia-Pacific commanded 52.4% of global revenue in 2025
  • South America posts the fastest regional CAGR at 6.52% for 2026โ€“2035
  • North America accounted for USD 6.24 billion, lifted by nearshoring of medical and automotive tooling

ย 

Market Size and Forecast (2021โ€“2035)

Historical values are triangulated from machinery association shipment statistics, customs trade flows for HS 8477 equipment, and audited disclosures from listed equipment manufacturers, then reconciled bottom-up against converter capex surveys across 14 economies. Forecast years apply installed-base replacement cycles and announced converter investment pipelines.
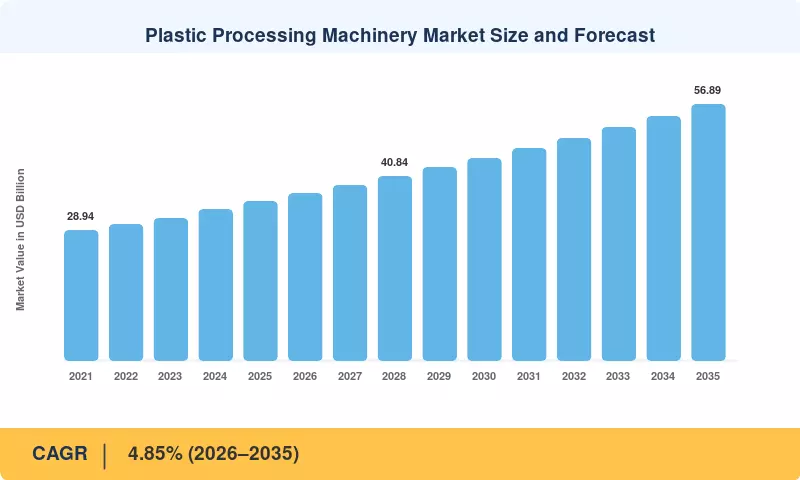
Plastic Processing Machinery Market Size and Forecast
Our Impact

Enabled $4.3B Revenue Impact for Fortune 500 and Leading Multinationals

Partnering with 2000+ Global Organizations Each Year

30K+ Citations by Top-Tier Firms in the Industry

Driver Impact Analysis

Driver ~% Impact on CAGR Geographic Relevance Impact Timeline
Packaging regulation and EPR retooling ~0.9 pp Europe, Asia-Pacific Medium-term (2โ€“4 yr)
Energy-efficiency mandates driving servo migration ~0.8 pp Global Short-term (โ‰ค2 yr)
Automotive lightweighting and EV component demand ~0.7 pp Europe, North America, Asia-Pacific Long-term (โ‰ฅ4 yr)
Recycled-content targets and mono-material redesign ~0.6 pp Global Medium-term (2โ€“4 yr)
Medical device and diagnostics output growth ~0.5 pp North America, Europe Long-term (โ‰ฅ4 yr)
Robotics integration offsetting labour scarcity ~0.5 pp Asia-Pacific, North America Short-term (โ‰ค2 yr)
Capacity localization under China-plus-one strategies ~0.4 pp India, ASEAN, Mexico Medium-term (2โ€“4 yr)

ย 

Packaging Regulation Forces a Retooling Cycle

Regulation has become the single largest order generator in the Plastic Processing Machinery Market. The EU Packaging and Packaging Waste Regulation requires all packaging placed on the European market to be recyclable by 2030, with recycled-content thresholds of 30% for contact-sensitive PET applications [5]. Converters cannot meet those thresholds on legacy tooling. Multi-layer barrier structures must be re-engineered into mono-material laminates, which changes die geometry, haul-off speed, and cooling profiles simultaneously. European packaging waste reached 84.3 million tonnes in the most recent Eurostat reporting year, and roughly 40% of it remains non-recyclable by design [24]. That gap translates directly into equipment orders through 2030.

Energy Economics Reshape Machine Specifications

Electricity is now the dominant operating cost line for most moulders. All-electric and hybrid presses cut specific energy consumption by 30โ€“60% against comparable hydraulic units, and the payback period compresses to under three years wherever industrial tariffs exceed EUR 0.15 per kWh [9]. German and Italian converters have been the earliest movers, but Japanese and Korean buyers followed once ISO 50001 certification began appearing in customer audit checklists [2]. Suppliers have responded by making servo drives standard rather than optional, quietly raising average selling prices by 12โ€“18% while improving lifetime economics for the buyer.

Automotive Lightweighting Sustains High-Tonnage Demand

Vehicle electrification rewards every kilogram removed from a body-in-white. Plastic content per light vehicle has climbed toward 200 kg on newer EV platforms, concentrated in battery enclosures, thermal-management ducting, and structural interior modules [7]. These parts demand large-tonnage clamping, precise cavity pressure control, and in-mould sensor arrays that older presses cannot host. Tier-1 suppliers in Bavaria, Michigan, and Guangdong have consequently front-loaded capex, and order books for 1,500-tonne-plus machines lengthened through 2025.

Robotics Integration Answers a Labour Problem

Skilled operator shortages are structural, not cyclical. Converter surveys across North America report unfilled technician vacancy rates above 9%, and turnover in first-year machine operator roles exceeds 30% [19]. Automated part removal, vision-based quality gating, and lights-out night shifts turn that constraint into a design requirement. Fully automated cells now command a premium of roughly 22โ€“28% over semi-automated equivalents, yet payback typically arrives inside four years for plants running three shifts.

ย 

Restraints Impact Analysis

Restraint ~% Impact on CAGR Geographic Relevance Impact Timeline
Capex deferral under elevated borrowing costs ~-0.6 pp Global Short-term (โ‰ค2 yr)
Resin price volatility and petrochemical overcapacity ~-0.5 pp Asia-Pacific, Middle East Medium-term (2โ€“4 yr)
Long machine service life and active used-equipment trade ~-0.4 pp Europe, North America Long-term (โ‰ฅ4 yr)
Shortage of qualified process technicians ~-0.3 pp North America, Europe Medium-term (2โ€“4 yr)
Tariff escalation and export licensing friction ~-0.3 pp Global Short-term (โ‰ค2 yr)

ย 

Financing Costs Delay Replacement Decisions

Purchases of equipment are purchases on credit. In most markets, policy rates remained above 4% for most of 2024, widening converter lease spreads by 180โ€“240 basis points. Therefore, small and mid-sized molders extended equipment life rather than replacing it [14]. Deferral doesnโ€™t kill demand. It moves demand. In Section 3, the spike year is explained by order intake statistics from European machinery organizations, which revealed a 7% fall in unit shipments in 2023 followed by a rapid catch-up in 2024.

ย 

Durable Assets Suppress Replacement Frequency

Well-maintained presses last twenty years. Studies on association fleets show that the average age of installed injection units in Western Europe is around 13 years, with a significant tail of over 20 years [1]. This effect is further exacerbated by a liquid secondary market in which refurbished machines are available for 30-45% of new-build prices, with rebuilt control packages that meet basic compliance. Suppliers fight back by linking software features, spare-part warranties and remote diagnostics to first-owner status, but the unit-volume drag is real.

ย 

Resin Volatility Clouds Payback Models

Feedstock volatility undermines investment cases. Polyethylene and polypropylene contract prices have changed in double-digit percentage ranges within single quarters in recent cycles, and additional Middle Eastern and Chinese cracker capacity has driven regional oversupply [7]. Unpredictable input prices make converters devalue the value of marginal efficiency gains, slowing adoption of premium equipment. The suppliers who are making the most headway against this argument are those offering terms on scrap-rate performance.

ย 

ย 

Plastic Processing Machinery Market Opportunities

Recycling and Reprocessing Equipment Lines

Europe alone needs almost to treble its mechanical recycling capability to meet the 2030 standards for recycled-content [10]. That build-out calls for washing lines, degassing systems, melt filtering, and twin-screw extruder compounding trains set up for polluted post-consumer streams. Equipment vendors with established filtration and devolatilization know-how are turning recycling capex into multi-year framework agreements.

ย 

Aftermarket Services and Data Monetization

Recurring revenue is the strategic prize inside the Plastic Processing Machinery Market. Leading European suppliers already draw 25โ€“35% of turnover from spare parts, retrofits, and subscription software covering condition monitoring and energy dashboards [17]. Because these streams carry gross margins roughly double those of new equipment, they materially change enterprise valuations and raise switching costs for installed accounts.

India and ASEAN Capacity Formalization

Converter fragmentation in South and Southeast Asia is resolving into fewer, larger, better-capitalized plants. Indian policy incentives for petrochemical downstream investment, combined with tightening food-contact standards, are pulling job shops toward certified automated lines [12]. Vendors offering mid-tier machines with genuine service coverage โ€” rather than premium platforms or bare-bones imports โ€” face the least competition in this band.

Medical and Diagnostics Cleanroom Cells

Healthcare converters pay for validation, not just throughput. Cleanroom-rated cells with documented process capability, ISO 13485 traceability, and cavity-level part serialization command 35โ€“50% price premiums over general-purpose equivalents [13]. Demand is expanding as diagnostics manufacturers reshore critical consumable production across North America and Europe.

Retrofit and Circular Equipment Programs

Not every opportunity requires a new machine. Structured retrofit programs โ€” servo drive conversion, control-system replacement, robot integration on existing frames โ€” address the durable-asset restraint identified earlier while capturing 15โ€“25% of new-machine value per installation [1]. A rotational molding machine or an ageing extrusion frame can often be modernized profitably rather than scrapped.

ย 

Plastic Processing Machinery Market Future Outlook

Autonomous Process Control Becomes Standard

Machine learning applied to cavity pressure, melt temperature, and cycle variance data will move from pilot to specification line by 2030. Suppliers already demonstrate closed-loop systems that auto-correct for resin lot variation without operator intervention, cutting startup scrap by 40โ€“60% [16]. Within the Plastic Processing Machinery Market, the competitive question shifts from who builds the best frame to who owns the best process model, because algorithmic advantage compounds with every installed machine feeding data back.

Platform Economics and Recurring Revenue

Equipment vendors are restructuring around software. Subscription tiers covering remote diagnostics, energy benchmarking, and production analytics now attach to roughly one in three new premium installations, and attach rates are climbing [17]. Analysts expect service and software to represent 35โ€“42% of leading suppliers' revenue by 2035, fundamentally altering how these businesses are valued and how they defend installed bases against low-cost entrants.

Circularity Rewrites Feedstock Assumptions

Global plastics use is projected to grow substantially while recycled content struggles to keep pace, with OECD analysis noting that secondary plastics still account for under 10% of total supply [7]. Closing that gap requires equipment tolerant of variable, contaminated feedstock โ€” better filtration, wider processing windows, more aggressive degassing. Machines specified purely for virgin resin will age badly. Buyers evaluating fifteen-year asset lives are already discounting them.

Energy Intensity Becomes a Disclosure Metric

Corporate sustainability reporting has pulled machine-level energy data into scope. Under expanding disclosure regimes, converters must report Scope 1 and 2 emissions with increasing granularity, and their customers audit those numbers [9]. Equipment that logs kWh per kilogram of throughput will hold residual value that equipment without instrumentation will not. Across the Plastic Processing Machinery Market, this transforms metering from a nice-to-have into a resale-value determinant.

ย 

Regional Market Share Analysis

Region Metric (2025) Primary Investment Themes
Asia-Pacific 52.4% share Packaging volume, domestic OEM scale-up, automation upgrade
Europe USD 7.12 Billion Regulatory retooling, energy efficiency, recycling lines
North America 17.6% share Nearshoring, medical cleanrooms, automotive lightweighting
South America 6.52% CAGR (2026โ€“2035) Food packaging, agricultural film, import substitution
Middle East & Africa 5.90% CAGR (2026โ€“2035) Resin-adjacent downstream integration, construction profiles
Total USD 35.43 Billion โ€”

Regional performance across the Plastic Processing Machinery Market diverges sharply. Asia-Pacific supplies both the largest demand pool and the most aggressive price competition. At the same time, Europe converts regulatory pressure into premium equipment orders and South America compounds from a small base.

ย 

North America

Country Metric (2025) Key Driver
US 72.4% share of region Medical device reshoring and EV component tooling
Canada USD 0.71 Billion Packaging converter consolidation
Mexico 6.10% CAGR (2026โ€“2035) Automotive tier-2 nearshoring near Bajรญo corridor

ย 

American converters are buying capability rather than capacity. Federal materials-management reporting shows container and packaging waste exceeding 82 million tons annually, and state-level extended producer responsibility statutes in Oregon, Colorado, and California now impose eco-modulated fees that reward recyclable design [13]. Mexican demand tells a different story: tier-2 automotive suppliers relocating from Asia have installed high-tonnage presses at pace, and machinery imports through Nuevo Leรณn grew faster than any other industrial category [14].

Europe

Country Metric (2025) Key Driver
Germany 26.8% share of region OEM density and automotive component demand
UK USD 0.68 Billion Plastic packaging tax compliance retooling
France 4.20% CAGR (2026โ€“2035) Single-use plastics phase-out substitution
Italy 16.4% share of region Machinery export cluster and domestic packaging
Spain USD 0.51 Billion Agricultural film and food packaging
Nordic Countries 4.00% CAGR (2026โ€“2035) Deposit-return infrastructure and recyclate quality
Russia 4.1% share of region Import-substituted domestic converter capacity
Rest of Europe USD 0.78 Billion Central European contract manufacturing

ย 

Europe's equipment cycle runs on compliance calendars. The Single-Use Plastics Directive removed entire product categories from shelves and pushed converters toward substitute formats requiring different tooling entirely [6]. Germany and Italy together account for the bulk of regional machinery production as well as consumption, giving European suppliers a home-market testbed for energy-optimized platforms before export. The UK plastic packaging tax, levied on packaging containing under 30% recycled content, has proven an unusually direct trigger for reprocessing equipment investment [24].

Asia-Pacific

Country Metric (2025) Key Driver
China 51.6% share of region Domestic OEM cost leadership and export scale
India 7.30% CAGR (2026โ€“2035) Converter formalization and downstream incentives
Japan USD 2.24 Billion Precision electronics and medical components
South Korea 7.1% share of region Battery module and connector housings
ASEAN 6.40% CAGR (2026โ€“2035) Relocated consumer goods manufacturing
Rest of Asia-Pacific USD 1.09 Billion Construction profiles and pipe extrusion

ย 

Scale defines the region's role in the Plastic Processing Machinery Market. Chinese manufacturers supply the majority of global unit volume and have systematically moved upmarket, adding servo drives and open control architectures to machines still priced 30โ€“45% below European equivalents . India presents the sharpest growth curve: policy incentives for petrochemical downstream capacity, tightening food-contact regulation, and rising domestic packaging consumption have pushed thousands of small moulders toward their first automated purchase [12]. Japanese and Korean demand concentrates in precision applications where cycle-time repeatability outweighs unit cost.

South America

Country Metric (2025) Key Driver
Brazil 58.9% share of region Food and beverage packaging expansion
Argentina USD 0.31 Billion Agricultural film and irrigation piping
Rest of South America 5.40% CAGR (2026โ€“2035) Andean consumer goods manufacturing

ย 

Brazilian converters are catching up on two decades of deferred modernization. Domestic packaging demand has grown alongside processed-food consumption, while import tariffs on finished packaging encourage local production [14]. Argentine investment concentrates in agricultural applications, where film and pipe extrusion serve grain storage and irrigation networks. Currency instability remains the principal brake on order conversion across the region, which is why leasing structures and locally financed equipment have gained share against direct import purchases.

Middle East & Africa

Country Metric (2025) Key Driver
Saudi Arabia 27.3% share of region Downstream integration under industrial diversification
UAE USD 0.29 Billion Re-export packaging and logistics hubs
South Africa 5.10% CAGR (2026โ€“2035) Rigid packaging and automotive components
Egypt 11.6% share of region Construction profiles and pipe systems
Rest of MEA USD 0.38 Billion Consumer goods import substitution

ย 

Resin proximity is the region's structural advantage. Saudi industrial diversification programs explicitly target downstream conversion, moving value capture beyond polymer export toward finished goods [14]. Gulf converters therefore buy larger, more automated lines than their revenue base alone would suggest. African demand remains construction-weighted, with pipe and profile extrusion dominating equipment mix, though East African packaging investment has accelerated as regional consumer brands scale.

ย 

Plastic Processing Machinery Market By Region, 2025-2035

Plastic Processing Machinery Market Segmentation

Segmentation within the Plastic Processing Machinery Market follows three commercially meaningful axes: the forming process itself, the degree of automation, and the end-use industry that ultimately specifies the part.

By Machine Type

The Plastic Processing Machinery Market divides first by forming process, and injection technology sets the pace.

Segment Metric (2025) Primary Demand Driver
Injection Molding 48.3% share Packaging closures, automotive components, medical consumables
Extrusion USD 8.72 Billion Film, pipe, profile, and sheet production
Blow Molding 4.40% CAGR (2026โ€“2035) Rigid container and bottle output
Thermoforming 5.60% CAGR (2026โ€“2035) Food tray and clamshell format migration
Others 3.5% share Rotational, compression, and specialty forming

ย 

Injection molding retains dominance because it serves the widest part geometry range at the lowest cost per unit at volume. Its installed base is also the most attractive retrofit target, since servo conversion and robot integration deliver measurable payback on existing frames. Extrusion holds second position and behaves differently: orders skew toward complete line projects rather than single machines, with die, haul-off, winder, and inline inspection procured together. That project structure lengthens sales cycles but raises contract values considerably, and it favours suppliers who can integrate rather than merely manufacture.

By Automation Level

Automation choice within the Plastic Processing Machinery Market maps closely to regional labour economics.

Segment Metric Primary Demand Driver
Semi-Automated 61.5% share (2025) Lower capex, flexible short-run production
Fully Automated 6.55% CAGR (2026โ€“2035) Labour scarcity, quality traceability, lights-out shifts

ย 

Fully automated cells grow faster than any other segment cut. The driver is not simply labour cost but auditability: automotive and medical customers increasingly demand part-level traceability that manual handling cannot reliably provide. Semi-automated equipment nonetheless retains the larger installed value, dominating in South Asia, Africa, and among short-run custom moulders everywhere, where changeover flexibility outweighs cycle consistency.

By End-User Industry

End-use demand within the Plastic Processing Machinery Market concentrates heavily in packaging, though the highest-margin equipment sells elsewhere.

Segment Metric (2025) Primary Demand Driver
Packaging 44.6% share Food, beverage, and e-commerce format growth
Consumer Goods USD 5.63 Billion Household product volume and design churn
Electrical & Electronics 5.40% CAGR (2026โ€“2035) Connector, housing, and enclosure demand
Construction 11.8% share Pipe, profile, and insulation systems
Healthcare USD 2.87 Billion Diagnostics consumables and device components
Others 6.4% share Automotive interiors, agriculture, industrial

ย 

Packaging dominates on volume and will continue to, but its equipment mix is changing faster than its share. Mono-material redesign, recycled-content thresholds, and lightweighting all force tooling replacement inside an otherwise mature vertical. Healthcare, though only a fraction of packaging's revenue, generates disproportionate supplier profit: cleanroom-rated cells with validated documentation carry premiums that general-purpose equipment cannot approach, and switching costs post-validation are effectively prohibitive for the converter.

ย 

Competitive Benchmarking

Concentration in the Plastic Processing Machinery Market is moderate. An estimated Herfindahl-Hirschman Index of roughly 480โ€“560 places the sector in unconcentrated-to-moderately-concentrated territory, with the top five suppliers holding a combined 31โ€“35% of global revenue. Fragmentation is regional rather than global: Chinese OEMs dominate unit volume, European and Japanese suppliers dominate value per machine, and no single player exceeds a tenth of worldwide revenue. Competitive differentiation has migrated from mechanical specification toward control software, service coverage, and financing flexibility.

Company Est. Revenue Share Range Key Offerings for Plastic Processing Machinery Market Strategic Positioning
Haitian International ~8โ€“11% Injection presses across tonnage range, servo hydraulic platforms Global volume leader on cost-performance
ENGEL Austria ~6โ€“9% All-electric and tie-bar-less injection cells, integrated automation Premium precision and turnkey systems
ARBURG ~4โ€“7% Electric presses, additive-hybrid manufacturing cells High-precision small-shot specialist
KraussMaffei Group ~4โ€“7% Injection, extrusion, and reaction process technology Broad multi-technology portfolio
Milacron (Hillenbrand) ~3โ€“6% Injection systems, extrusion, hot runners, aftermarket Americas installed base and parts depth
Husky Technologies ~3โ€“5% PET preform systems, hot runners, closure systems Dominant in high-cavitation beverage tooling
Sumitomo (SHI) Demag ~3โ€“5% All-electric presses, medical and packaging cells Energy efficiency and cycle repeatability
Nissei Plastic Industrial ~2โ€“4% Electric and hybrid injection machines Japanese precision and thin-wall expertise
Chen Hsong Holdings ~2โ€“4% Toggle and two-platen injection machines Value tier across Asia and Middle East
The Japan Steel Works ~2โ€“4% Large-tonnage injection and extrusion equipment Heavy industrial and automotive structures
Reifenhรคuser Group ~2โ€“4% Blown and cast film lines, nonwovens systems Film extrusion technology leadership
Coperion (Hillenbrand) ~2โ€“4% Compounding extruders, feeding and material handling Recycling and compounding process depth

ย 

ย 

Recent News & Developments

  • European Commission (February 2025): The Packaging and Packaging Waste Regulation entered into force, setting binding recyclability and recycled-content thresholds that trigger converter retooling across all EU member states [5]
  • Messe Dรผsseldorf (October 2025): The K trade fair in Dรผsseldorf convened global suppliers around circularity and digitalization themes, generating a substantial order backlog that converted through late 2025 and into 2026 [21]
  • Hillenbrand (2024): The group advanced integration of its plastics processing and compounding businesses, consolidating Coperion and Milacron capabilities under a unified industrial platform to broaden recycling-line offerings [19]
  • Government of India (2023โ€“2025): Policy incentives for chemicals and petrochemicals downstream capacity expanded, accelerating converter formalization and first-time automation purchases across western and southern industrial clusters [12]
  • United Nations Environment Programme (2024โ€“2025): Intergovernmental negotiating committee sessions on a global plastics instrument continued, keeping design-for-recyclability firmly on multinational brand-owner agendas and sustaining reprocessing equipment demand [8]
  • Ellen MacArthur Foundation (2024): Global Commitment progress reporting confirmed that signatory brands remain behind on recycled-content pledges, underlining the equipment investment gap in reprocessing capacity [10]
  • European machinery associations (2024): Sector shipment statistics recorded a rebound in order intake following the 2023 destocking contraction, with energy-efficient platforms capturing a rising share of unit sales [1][2]
  • US Environmental Protection Agency (2023โ€“2024): Sustainable materials management reporting reinforced state-level extended producer responsibility momentum, prompting North American converters to evaluate recyclable-format tooling [13]

ย 

Plastic Processing Machinery Market Report Scope

Report Attribute/Metric Details
Market Scope Global equipment for forming, shaping, and processing polymers, covering injection molding, extrusion, blow molding, thermoforming, and specialty processes, including auxiliaries and integrated automation
Study Period 2021-2035
Base Year 2025
Historical Data 2021โ€“2024
Forecast Period 2026โ€“2035
Market Size in 2025 USD 35.43 Billion
Market Size in 2035 USD 56.89 Billion
CAGR (2026โ€“2035) 4.85%
Fastest Growing Segments Fully Automated systems (6.55% CAGR); Thermoforming (5.60% CAGR); South America (6.52% CAGR)
Regions Covered North America, Europe, South America, Asia Pacific, Middle East and Africa and ROW
Companies Profiled Haitian International, ENGEL Austria, ARBURG, KraussMaffei, Milacron, Husky Technologies, Sumitomo (SHI) Demag, Nissei Plastic Industrial, Chen Hsong, The Japan Steel Works, Reifenhรคuser, Coperion
Valuation Currency USD Billion
Methodology 350+ primary expert interviews; bottom-up market sizing; top-down validation; data triangulation; scenario-based forecasting; real-time project tracking

FAQs

Beyond machine price, what should a first-time buyer budget for in the Plastic Processing Machinery Market?
Tooling, auxiliaries, and installation typically add 40โ€“60% on top of press price. Budget separately for chillers, dryers, material handling, and operator training. Service contracts run 3โ€“8% of machine value annually. [Ref 15]
How do all-electric presses compare with hydraulic units on total cost of ownership?
All-electric units cut energy draw 30โ€“60% versus hydraulic equivalents and hold tighter shot repeatability. Payback typically lands at two to four years in high-tariff power markets. Hydraulic presses still win on very large tonnages and thick-wall parts. [Ref 9]
Which certifications matter most for suppliers entering the Plastic Processing Machinery Market?
ISO 9001 and CE conformity under EU machinery rules are baseline for the Plastic Processing Machinery Market. Medical converters additionally demand ISO 13485 documentation and validated process capability. Energy-management certification increasingly appears in European tender scoring. [Ref 5]
What lead times should buyers expect for large-tonnage equipment orders?
Standard clamping units ship in 12โ€“20 weeks. Large-tonnage and heavily customized cells stretch to nine to fourteen months, driven by servo drive and control-board availability. Order early around trade-fair cycles, when build slots fill fastest. [Ref 21]
How is the aftermarket reshaping competition across the Plastic Processing Machinery Market?
Spare parts, retrofits, and software subscriptions now deliver 25โ€“35% of European suppliers' revenue in the Plastic Processing Machinery Market at far higher margins. That recurring base cushions cyclical equipment swings and raises switching costs for installed accounts. [Ref 17]
Can existing lines be retrofitted to run high recycled-content feedstock?
Usually yes, but expect new screw geometry, upgraded melt filtration, and revised temperature profiles. Contamination variability, not throughput, causes most rejects. Budget 8โ€“15% of original line cost for a credible retrofit. [Ref 10]
What integration challenges arise when adding vision-guided robotics to legacy cells?
Older controllers often lack open protocols, forcing gateway hardware and full cycle re-validation. Safety re-certification of the cell is mandatory after robot installation. Plan four to eight weeks of downtime and commissioning per line. [Ref 19] ย  ย 
Author
Author Author Profile Snehal Singh LinkedIn Manager - Research
High acumen in analyzing complex macro & micro markets with more than 6 years of work experience in the field of market research. By implementing her analytical skills in forecasting and estimation into market research reports, she has expertise in Packaging, Construction, and Equipment domains. She handles a team size of 20-25 resources and ensures smooth running of the projects, associated marketing activities, and client servicing.

Research Approach

ย 

Secondary Research

The secondary research process involved comprehensive analysis of industrial manufacturing databases, engineering journals, trade publications, and authoritative manufacturing organizations. Key sources included the US Department of Commerce Bureau of Industry and Security, European Commission Directorate-General for Internal Market, Industry, Entrepreneurship and SMEs, Plastics Industry Association (PLASTICS.org), German Engineering Federation (VDMA), Society of Plastics Engineers (SPE), Japan Plastics Machinery Association (JPMA), China Plastics Machinery Industry Association (CPMIA), International Organization for Standardization (ISO) technical committees for plastics and rubber machinery, ASTM International standards database, United Nations Comtrade Database, International Trade Centre (ITC) Trade Map, US Census Bureau Annual Survey of Manufactures, Eurostat Structural Business Statistics, National Bureau of Statistics of China, India Ministry of Commerce and Industry, US Environmental Protection Agency (EPA) regulations on plastics manufacturing, European Environment Agency industrial emissions data, and national statistics offices from key manufacturing markets. These sources were used to collect production capacity data, machinery import/export statistics, regulatory compliance standards, technological adoption trends, and capacity utilization rates for injection molding machinery, blow molding equipment, extrusion lines, compression molding systems, and rotational molding units.

ย 

Primary Research

To gather both qualitative and quantitative information, the primary research process involved interviewing players from both the supply and demand sides. Members of the supply side comprised plastic processing machinery original equipment manufacturers' and suppliers' top executives, including CEOs, MDs, heads of engineering and research and development, and global sales directors. Personnel from the following industries: packaging, automotive tier suppliers, building material producers, electronics contract makers, and agricultural plastics processors made up the demand-side sources: plant managers, operations directors, procurement heads, and maintenance engineers. Data on automation adoption rates, aftermarket service revenues, finance structures, supply chain wait times, and equipment replacement cycles were all substantiated by primary research, which also confirmed market segmentation.

Primary Respondent Breakdown:

โ€ข By Designation: C-level Primaries (32%), Director Level (35%), Others (33%)

โ€ข By Region: North America (30%), Europe (28%), Asia-Pacific (32%), Rest of World (10%)

ย 

Market Size Estimation

Global market valuation was derived through revenue mapping and installed base analysis. The methodology included:

โ€ข Identification of 50+ key machinery manufacturers across North America, Europe, Asia-Pacific, and Latin America, including specialists in injection molding (KraussMaffei, Husky, Engel, Arburg), blow molding (Kautex, Graham Engineering), and extrusion systems (Reifenhauser, Battenfeld-Cincinnati)

โ€ข Product mapping across injection molding machinery, blow molding machinery, extrusion molding machinery, compression molding machinery, and rotational molding machinery segments

โ€ข Analysis of reported annual revenues, unit shipment volumes, and aftermarket service income specific to plastic processing equipment portfolios

โ€ข Coverage of manufacturers representing 75-80% of global market share in 2024

โ€ข Extrapolation using bottom-up (unit shipments ร— ASP by machinery type and region) and top-down (manufacturer revenue validation against end-user demand) approaches to derive segment-specific valuations and regional market splits

Download Free Sample

Kindly complete the form below to receive a free sample of this Report

Air Operated Double Diaphragm (AODD) Pump Market
Case Study
Industrial Automation & Equipment
Download PDF ×

We do not share your information with anyone. However, we may send you emails based on your report interest from time to time. You may contact us at any time to opt-out.

















