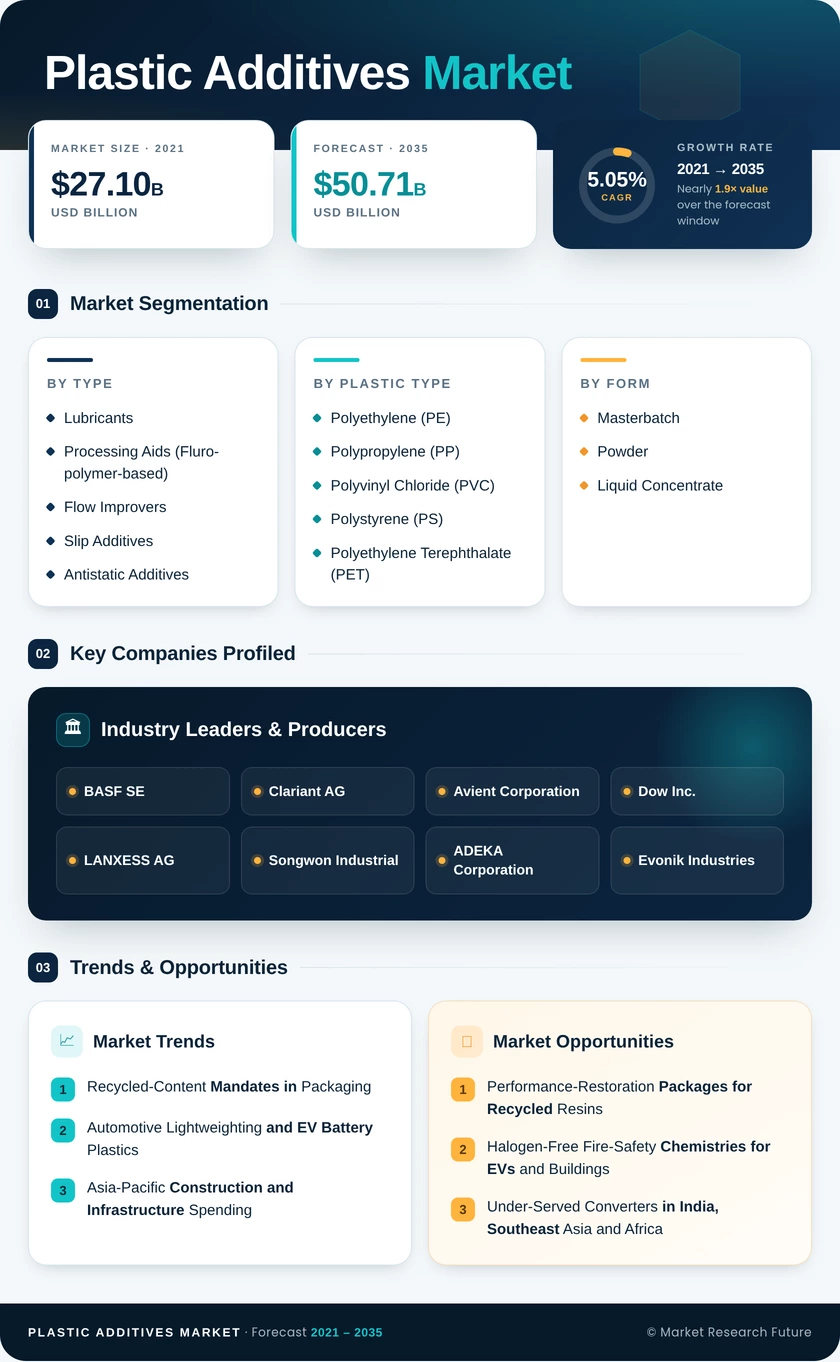
Plastic Additives Market (2026 - 2035)

ID: MRFR/CnM/1221-HCR 111 Pages Chitranshi Jaiswal Last Updated: October 13, 2026
Plastic Additives Market Research Report Information By Type (Lubricants, Processing Aids (Fluro-polymer-based), Flow Improvers, Slip Additives, Antistatic Additives, Pigment Wetting Agents, Colorants, Antifog Additives, Plasticizers, and Other Types (Filler Dispersants, Blowing Agent, Anti-blocking Agents, Coupling agents, etc.)), By Plastic Type (Polyethylene (PE), Polypropylene (PP), Polyvinyl Chloride (PVC), Polystyrene (PS), Polyethylene Terephthalate (PET), Polycarbonate (PC), Polyamides (PA), and Other Plastic Types), By Form (Masterbatch, Powder, and Liquid Concentrate), and By Application (Packaging, Consumer Goods, Construction, Automotive, and Others (Medical, 3D Printing)) – Forecast Till 2035.
Plastic Additives Market
Market Size
Forecast Period2026-2035
CAGR (2026-2035)5.05%
2025 Market SizeUSD 31.04 Billion
2035 Market SizeUSD 50.71 Billion
Key Players
BASF SE
Clariant AG
Avient Corporation
Dow Inc.
LANXESS AG
Songwon Industrial
Opportunities
  • Performance-Restoration Packages for Recycled Resins
  • Halogen-Free Fire-Safety Chemistries for EVs and Buildings
  • Under-Served Converters in India, Southeast Asia and Africa
  1. 1 Market Summary | |
  2. 2 Key Report Takeaways | |
    1. 2.1 By Type | |
    2. 2.2 By Plastic Type | |
    3. 2.3 By Form | |
    4. 2.4 By Application | |
    5. 2.5 By Region | |
  3. 3 Market Size and Forecast (2021–2035) | |
  4. 4 Driver Impact Analysis | |
    1. 4.1 Recycled-Content Mandates in Packaging | |
    2. 4.2 Automotive Lightweighting and EV Battery Plastics | |
    3. 4.3 Asia-Pacific Construction and Infrastructure Spending | |
    4. 4.4 PFAS-Free Melt-Processing Substitution | |
    5. 4.5 Consumer Goods Premiumization and Functional Coloration | |
    6. 4.6 Medical Device and Additive Manufacturing Growth | |
  5. 5 Restraints Impact Analysis | |
    1. 5.1 Feedstock and Energy Price Volatility | |
    2. 5.2 Tightening Chemical Restrictions on Legacy Additive Families | |
    3. 5.3 Single-Use Plastic Bans and Source-Reduction Targets | |
    4. 5.4 Additive Interference in Mechanical Recycling | |
    5. 5.5 Asian Overcapacity and Price Compression | |
  6. 6 Opportunities | |
    1. 6.1 Performance-Restoration Packages for Recycled Resins | |
    2. 6.2 Halogen-Free Fire-Safety Chemistries for EVs and Buildings | |
    3. 6.3 Under-Served Converters in India, Southeast Asia and Africa | |
    4. 6.4 Formulation Data Platforms and Additive-as-a-Service Models | |
    5. 6.5 Bio-Based and Biodegradable-Compatible Additives | |
  7. 7 Regional Market Share and Country-Level Analysis | |
    1. 7.1 Asia-Pacific | | |
      1. 7.1.1 China | | |
      2. 7.1.2 India | | |
      3. 7.1.3 Japan | | |
      4. 7.1.4 South Korea | | |
      5. 7.1.5 Rest of Asia-Pacific | |
    2. 7.2 North America | | |
      1. 7.2.1 United States | | |
      2. 7.2.2 Canada | | |
      3. 7.2.3 Mexico | |
    3. 7.3 Europe | | |
      1. 7.3.1 Germany | | |
      2. 7.3.2 United Kingdom | | |
      3. 7.3.3 France | | |
      4. 7.3.4 Italy | | |
      5. 7.3.5 NORDIC Countries | | |
      6. 7.3.6 Rest of Europe | |
    4. 7.4 South America | | |
      1. 7.4.1 Brazil | | |
      2. 7.4.2 Argentina | | |
      3. 7.4.3 Rest of South America | |
    5. 7.5 Middle East and Africa | | |
      1. 7.5.1 Saudi Arabia | | |
      2. 7.5.2 South Africa | | |
      3. 7.5.3 Rest of Middle East and Africa | |
  8. 8 Future Outlook (2026–2035) | |
    1. 8.1 AI-Assisted Formulation and Inline Quality Control | |
    2. 8.2 Circularity Regulation and the Global Plastics Treaty | |
    3. 8.3 Electrification Supercycle in Mobility and Energy Storage | |
    4. 8.4 Sustainability Disclosure and Substance Transparency | |
  9. 9 Segmentation Analysis | |
    1. 9.1 By Type | | |
      1. 9.1.1 Lubricants | | |
      2. 9.1.2 Processing Aids (Fluro-polymer-based) | | |
      3. 9.1.3 Flow Improvers | | |
      4. 9.1.4 Slip Additives | | |
      5. 9.1.5 Antistatic Additives | | |
      6. 9.1.6 Pigment Wetting Agents | | |
      7. 9.1.7 Colorants | | |
      8. 9.1.8 Antifog Additives | | |
      9. 9.1.9 Plasticizers | | |
      10. 9.1.10 Other Types (Filler Dispersants, Blowing Agent, Anti-blocking Agents, Coupling agents, etc.) | |
    2. 9.2 By Plastic Type | | |
      1. 9.2.1 Polyethylene (PE) | | |
      2. 9.2.2 Polypropylene (PP) | | |
      3. 9.2.3 Polyvinyl Chloride (PVC) | | |
      4. 9.2.4 Polystyrene (PS) | | |
      5. 9.2.5 Polyethylene Terephthalate (PET) | | |
      6. 9.2.6 Polycarbonate (PC) | | |
      7. 9.2.7 Polyamides (PA) | | |
      8. 9.2.8 Other Plastic Types | |
    3. 9.3 By Form | | |
      1. 9.3.1 Masterbatch | | |
      2. 9.3.2 Powder | | |
      3. 9.3.3 Liquid Concentrate | |
    4. 9.4 By Application | | |
      1. 9.4.1 Packaging | | |
      2. 9.4.2 Consumer Goods | | |
      3. 9.4.3 Construction | | |
      4. 9.4.4 Automotive | | |
      5. 9.4.5 Others (Medical, 3D Printing) | |
  10. 10 Competitive Landscape | |
  11. 11 Recent News & Developments | |
  12. 12 Report Scope and Methodology | |
  13. 13 Detailed Sources and Citations | |
  14. 14 Frequently Asked Questions (FAQs) | | LIST OF TABLES | |
  15. TABLE 1 Global Market Snapshot – Key Metrics, 2025–2035 | |
  16. TABLE 2 Global Market Size & Forecast, by Revenue (USD Billion), 2021–2035 | |
  17. TABLE 3 Driver Impact Analysis, 2026–2035 | |
  18. TABLE 4 Restraints Impact Analysis, 2026–2035 | |
  19. TABLE 5 Regional Summary, 2025 | |
  20. TABLE 6 Asia-Pacific Market, by Country, 2025 | |
  21. TABLE 7 North America Market, by Country, 2025 | |
  22. TABLE 8 Europe Market, by Country, 2025 | |
  23. TABLE 9 South America Market, by Country, 2025 | |
  24. TABLE 10 Middle East and Africa Market, by Country, 2025 | |
  25. TABLE 11 Global Market, by Type, 2025 | |
  26. TABLE 12 Global Market, by Plastic Type, 2025 | |
  27. TABLE 13 Global Market, by Form, 2025 | |
  28. TABLE 14 Global Market, by Application, 2025 | |
  29. TABLE 15 Competitive Benchmarking Matrix, 2025 | |
  30. TABLE 16 Report Scope and Methodology | |
  31. TABLE 17 Detailed Sources and Citations | |
  32. TABLE 18 Segmentation Quick Reference | | LIST OF FIGURES | |
  33. FIGURE 1 Market Dynamics Overview – Drivers, Restraints and Opportunities | |
  34. FIGURE 2 Industry Value Chain Analysis | |
  35. FIGURE 3 Porter's Five Forces Analysis | |
  36. FIGURE 4 Global Market Size Trend (USD Billion), 2021–2035 | |
  37. FIGURE 5 Market Share by Type, 2025 | |
  38. FIGURE 6 Market Share by Plastic Type, 2025 | |
  39. FIGURE 7 Market Share by Form, 2025 | |
  40. FIGURE 8 Market Share by Application, 2025 | |
  41. FIGURE 9 Regional Market Share, 2025 | |
  42. FIGURE 10 Country-Level Share Comparison by Region, 2025 | |
  43. FIGURE 11 Competitive Landscape – Estimated Revenue Share Ranges, 2025 | |
  44. FIGURE 12 Recent Strategic Developments Timeline, 2023–2025

Segmentation Quick Reference

DimensionSub-SegmentsDominant SegmentFastest Growing Segment
By TypeLubricants; Processing Aids (Fluro-polymer-based); Flow Improvers; Slip Additives; Antistatic Additives; Pigment Wetting Agents; Colorants; Antifog Additives; Plasticizers; Other Types (Filler Dispersants, Blowing Agent, Anti-blocking Agents, Coupling agents, etc.)Colorants (49.1% share)Processing Aids (Fluro-polymer-based) (5.1% CAGR)
By Plastic TypePolyethylene (PE); Polypropylene (PP); Polyvinyl Chloride (PVC); Polystyrene (PS); Polyethylene Terephthalate (PET); Polycarbonate (PC); Polyamides (PA); Other Plastic TypesPolyethylene (PE) (19.1% share)Polypropylene (PP) (5.4% CAGR)
By FormMasterbatch; Powder; Liquid ConcentrateMasterbatch (59.7% share)Liquid Concentrate (5.3% CAGR)
By ApplicationPackaging; Consumer Goods; Construction; Automotive; Others (Medical, 3D Printing)Packaging (45.7% share)Consumer Goods (5.5% CAGR)
By RegionAsia-Pacific; North America; Europe; South America; Middle East and AfricaAsia-Pacific (46.8%)Asia-Pacific (46.8%)

Market Segmentation Overview

By Type

Sub-SegmentKey Trend
LubricantsShift to lead-free, high-efficiency PVC lubrication
Processing Aids (Fluro-polymer-based)Re-qualification toward silicone and acrylic alternatives
Flow ImproversEnabling thinner walls and shorter cycles
Slip AdditivesTied to polyethylene film volumes
Antistatic AdditivesElectronics and dust-sensitive packaging
Pigment Wetting AgentsHigher pigment loadings in concentrates
ColorantsColor correction for grey-tinted recyclate
Antifog AdditivesFresh produce and greenhouse film
PlasticizersTransition to non-phthalate chemistries
Other Types (Filler Dispersants, Blowing Agent, Anti-blocking Agents, Coupling agents, etc.)Coupling agents for talc-filled automotive grades

Colorants lead this dimension with a 49.1% share because pigments carry high unit value and must now compensate for the darker, variable tone of recycled resin. Processing Aids (Fluro-polymer-based) grow fastest at a 5.1% CAGR, as the PFAS restriction proposal forces converters to fund trials of fluorine-free replacements. Slip Additives and Antifog Additives remain tied to film throughput rather than regulatory change.

By Plastic Type

Sub-SegmentKey Trend
Polyethylene (PE)Recycled-content film needing melt and barrier restoration
Polypropylene (PP)Talc-filled EV interior grades
Polyvinyl Chloride (PVC)Lead-free heat-stabilizing systems for pipe and profile
Polystyrene (PS)Halogen-free expanded insulation
Polyethylene Terephthalate (PET)Chain extenders for high-recycled-content bottles
Polycarbonate (PC)BPA scrutiny in food contact; growth in electronics
Polyamides (PA)Heat-resistant under-hood and battery parts
Other Plastic TypesSpecialty engineering polymers

Polyethylene (PE) holds the largest share at 19.1% because packaging film and blow-molded containers consume slip, anti-block and light-protection packages in bulk. Polypropylene (PP) grows fastest at a 5.4% CAGR as automakers specify talc-filled grades that depend on coupling agents for low-temperature ductility. Polyethylene Terephthalate (PET) gains additive intensity as bottlers chase EU recycled-content thresholds.

By Form

Sub-SegmentKey Trend
MasterbatchUltra-high-concentration pellets with reduced carrier resin
PowderRetained in dry-blend PVC and thermosets
Liquid ConcentrateDirect metering into extruder throats

Masterbatch dominates with a 59.7% share because small and mid-sized converters prefer pellets that work with standard hoppers and need no new equipment. Liquid Concentrate grows fastest at a 5.3% CAGR as large processors invest in gravimetric liquid pumps that eliminate pre-compounding and cut inventory. Powder holds steady in PVC dry blending, where liquid carriers disrupt fusion.

By Application

Sub-SegmentKey Trend
PackagingRecycled-content compliance and down-gauging
Consumer GoodsColor, texture and antimicrobial differentiation
ConstructionWeatherable rigid PVC and insulation
AutomotivePivot toward battery and high-voltage components
Others (Medical, 3D Printing)Biocompatible and printable formulations

Packaging leads with a 45.7% share, though PPWR and SB 54 are shifting its additive mix from slip and antistatic grades toward recyclate restoration. Consumer Goods grow fastest at a 5.5% CAGR, as appliance and personal-care brands pay premiums for color and surface functionality. Automotive demand is moving from interior trim to battery enclosures requiring fire-safety packages.


Download PDF ×

We do not share your information with anyone. However, we may send you emails based on your report interest from time to time. You may contact us at any time to opt-out.