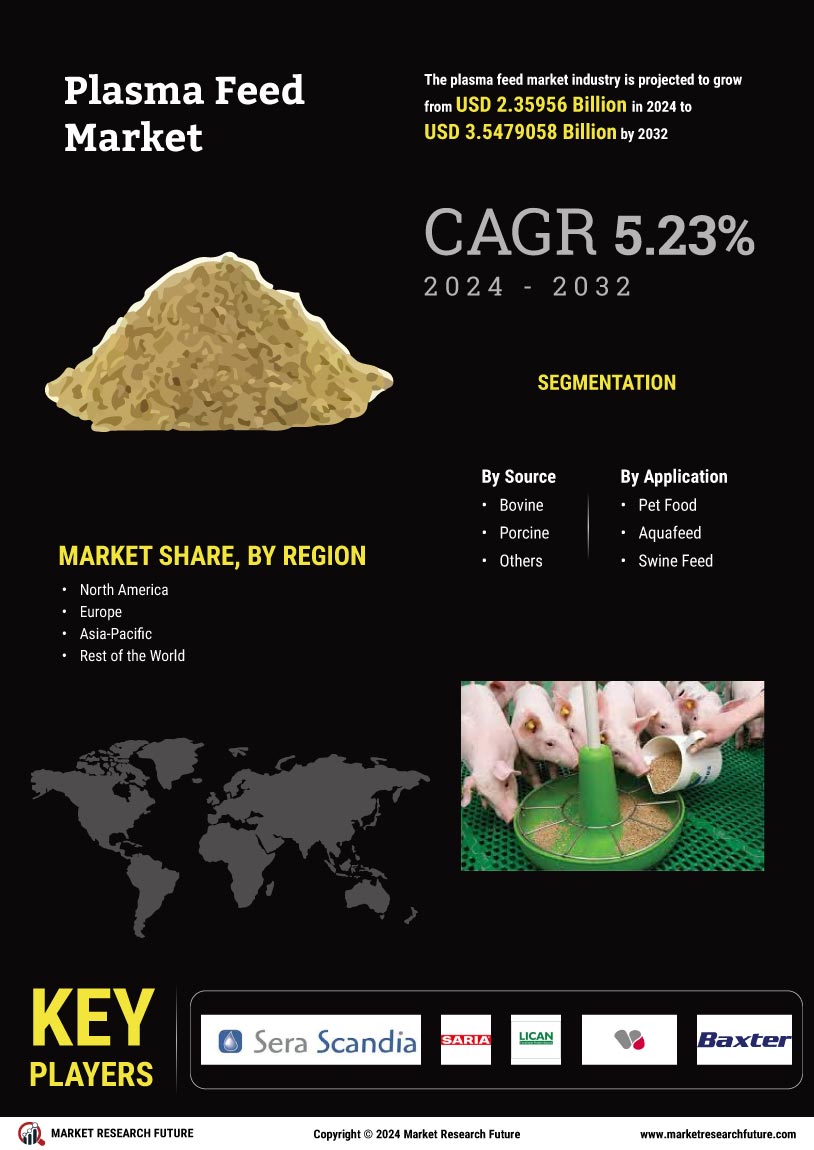
Plasma Feed Market Research Report - Global Forecast till 2030

Plasma Feed Market Research Report Information Information by Source (Bovine, Porcine and others), Application (Pet Food, Aquafeed, Swine Feed and others) and Region (North America, Europe, Asia-Pacific and Rest of the World) - Forecast till 2030

ID: MRFR/AGR/6832-HCR | 90 Pages | Author: Snehal Singh | June 2023         

Table of Contents

1. 1 EXECUTIVE SUMMARY

1.1. Market Attractiveness Analysis

1.1.1. Global Plasma Feed Market, by Source

1.1.2. Global Plasma Feed Market, by Application

1.1.3. Global Plasma Feed Market, by Region

2. MARKET INTRODUCTION

2.1. Definition

2.2. Scope of the Study

2.3. Market Structure

2.4. Key Buying Criteria

2.5. Macro Factor Indicator Analysis

3. RESEARCH METHODOLOGY

3.1. Research Process

3.2. Primary Research

3.3. Secondary Research

3.4. Market Size Estimation

3.5. Forecast Model

3.6. List of Assumptions

4. MARKET DYNAMICS

4.1. Introduction

4.2. Drivers

4.3. Restraints

4.4. Opportunities

4.5. Challenges

5. MARKET FACTOR ANALYSIS

5.1. Value Chain Analysis

5.2. Supply Chain Analysis

5.3. Porter’s Five Forces Model

5.3.1. Bargaining Power of Suppliers

5.3.2. Bargaining Power of Buyers

5.3.3. Threat of New Entrants

5.3.4. Threat of Substitutes

5.3.5. Intensity of Rivalry

6. GLOBAL PLASMA FEED MARKET, BY SOURCE

6.1. Introduction

6.2. Bovine

6.2.1. Bovine: Market Estimates & Forecast, by Region/Country, 2022-2030

6.3. Porcine

6.3.1. Porcine: Market Estimates & Forecast, by Region/Country, 2022-2030

6.4. Others

6.4.1. Others: Market Estimates & Forecast, by Region/Country, 2022-2030

7. GLOBAL PLASMA FEED MARKET, BY APPLICATION

7.1. Introduction

7.2. Pet Food

7.2.1. Pet Food: Market Estimates & Forecast, by Region/Country, 2022-2030

7.3. Aquafeed

7.3.1. Aquafeed: Market Estimates & Forecast, by Region/Country, 2022-2030

7.4. Swine Feed

7.4.1. Swine Feed: Market Estimates & Forecast, by Region/Country, 2022-2030

7.5. Others

7.5.1. Others: Market Estimates & Forecast, by Region/Country, 2022-2030

8. GLOBAL PLASMA FEED MARKET, BY REGION

8.1. Introduction

8.2. North America

8.2.1. Market Estimates & Forecast, by Source, 2022-2030

8.2.2. Market Estimates & Forecast, by Application, 2022-2030

8.2.3. Market Estimates & Forecast, by Country, 2022-2030

8.2.4. US

8.2.4.1. Market Estimates & Forecast, by Source, 2022-2030

8.2.4.2. Market Estimates & Forecast, by Application, 2022-2030

8.2.5. Canada

8.2.5.1. Market Estimates & Forecast, by Source, 2022-2030

8.2.5.2. Market Estimates & Forecast, by Application, 2022-2030

8.2.6. Mexico

8.2.6.1. Market Estimates & Forecast, by Source, 2022-2030

8.2.6.2. Market Estimates & Forecast, by Application, 2022-2030

8.3. Europe

8.3.1. Market Estimates & Forecast, by Source, 2022-2030

8.3.2. Market Estimates & Forecast, by Application, 2022-2030

8.3.3. Market Estimates & Forecast, by Country, 2022-2030

8.3.4. Germany

8.3.4.1. Market Estimates & Forecast, by Source, 2022-2030

8.3.4.2. Market Estimates & Forecast, by Application, 2022-2030

8.3.5. UK

8.3.5.1. Market Estimates & Forecast, by Source, 2022-2030

8.3.5.2. Market Estimates & Forecast, by Application, 2022-2030

8.3.6. France

8.3.6.1. Market Estimates & Forecast, by Source, 2022-2030

8.3.6.2. Market Estimates & Forecast, by Application, 2022-2030

8.3.7. Spain

8.3.7.1. Market Estimates & Forecast, by Source, 2022-2030

8.3.7.2. Market Estimates & Forecast, by Application, 2022-2030

8.3.8. Italy

8.3.8.1. Market Estimates & Forecast, by Source, 2022-2030

8.3.8.2. Market Estimates & Forecast, by Application, 2022-2030

8.3.9. Rest of Europe

8.3.9.1. Market Estimates & Forecast, by Source, 2022-2030

8.3.9.2. Market Estimates & Forecast, by Application, 2022-2030

8.4. Asia-Pacific

8.4.1. Market Estimates & Forecast, by Source, 2022-2030

8.4.2. Market Estimates & Forecast, by Application, 2022-2030

8.4.3. Market Estimates & Forecast, by Country, 2022-2030

8.4.4. China

8.4.4.1. Market Estimates & Forecast, by Source, 2022-2030

8.4.4.2. Market Estimates & Forecast, by Application, 2022-2030

8.4.5. Japan

8.4.5.1. Market Estimates & Forecast, by Source, 2022-2030

8.4.5.2. Market Estimates & Forecast, by Application, 2022-2030

8.4.6. India

8.4.6.1. Market Estimates & Forecast, by Source, 2022-2030

8.4.6.2. Market Estimates & Forecast, by Application, 2022-2030

8.4.7. Australia & New Zealand

8.4.7.1. Market Estimates & Forecast, by Source, 2022-2030

8.4.7.2. Market Estimates & Forecast, by Application, 2022-2030

8.4.8. Rest of Asia-Pacific

8.4.8.1. Market Estimates & Forecast, by Source, 2022-2030

8.4.8.2. Market Estimates & Forecast, by Application, 2022-2030

8.5. Rest of the World

8.5.1. Market Estimates & Forecast, by Source, 2022-2030

8.5.2. Market Estimates & Forecast, by Application, 2022-2030

8.5.3. Market Estimates & Forecast, by Region, 2022-2030

8.5.4. South America

8.5.4.1. Market Estimates & Forecast, by Source, 2022-2030

8.5.4.2. Market Estimates & Forecast, by Application, 2022-2030

8.5.5. Middle East

8.5.5.1. Market Estimates & Forecast, by Source, 2022-2030

8.5.5.2. Market Estimates & Forecast, by Application, 2022-2030

8.5.6. Africa

8.5.6.1. Market Estimates & Forecast, by Source, 2022-2030

8.5.6.2. Market Estimates & Forecast, by Application, 2022-2030

9. COMPETITIVE LANDSCAPE

9.1. Introduction

9.2. Competitive Benchmarking

9.3. Development Share Analysis

9.4. Key Developments & Growth Strategies

10. COMPANY PROFILES

10.1. Sera Scandia

10.1.1. Company Overview

10.1.2. Financial Overview

10.1.3. Products Offered

10.1.4. Key Developments

10.1.5. SWOT Analysis

10.1.6. Key Strategies

10.2. SARIA Group

10.2.1. Company Overview

10.2.2. Financial Overview

10.2.3. Products Offered

10.2.4. Key Developments

10.2.5. SWOT Analysis

10.2.6. Key Strategies

10.3. Rocky Mountain Biologicals

10.3.1. Company Overview

10.3.2. Financial Overview

10.3.3. Products Offered

10.3.4. Key Developments

10.3.5. SWOT Analysis

10.3.6. Key Strategies

10.4. Lican Food

10.4.1. Company Overview

10.4.2. Financial Overview

10.4.3. Products Offered

10.4.4. Key Developments

10.4.5. SWOT Analysis

10.4.6. Key Strategies

10.5. FeedWorks

10.5.1. Company Overview

10.5.2. Financial Overview

10.5.3. Products Offered

10.5.4. Key Developments

10.5.5. SWOT Analysis

10.5.6. Key Strategies

10.6. Veos Group

10.6.1. Company Overview

10.6.2. Financial Overview

10.6.3. Products Offered

10.6.4. Key Developments

10.6.5. SWOT Analysis

10.6.6. Key Strategies

10.7. Kraeber & Co Gmbh

10.7.1. Company Overview

10.7.2. Financial Overview

10.7.3. Products Offered

10.7.4. Key Developments

10.7.5. SWOT Analysis

10.7.6. Key Strategies

10.8. The Lauridsen Group Inc.

10.8.1. Company Overview

10.8.2. Financial Overview

10.8.3. Products Offered

10.8.4. Key Developments

10.8.5. SWOT Analysis

10.8.6. Key Strategies

10.9. Lihme Protein Solutions

10.9.1. Company Overview

10.9.2. Financial Overview

10.9.3. Products Offered

10.9.4. Key Developments

10.9.5. SWOT Analysis

10.9.6. Key Strategies

10.10. Puretein Agri LLC.

10.10.1. Company Overview

10.10.2. Financial Overview

10.10.3. Products Offered

10.10.4. Key Developments

10.10.5. SWOT Analysis

10.10.6. Key Strategies

10.11. Darling Ingredients Inc.

10.11.1. Company Overview

10.11.2. Financial Overview

10.11.3. Products Offered

10.11.4. Key Developments

10.11.5. SWOT Analysis

10.11.6. Key Strategies

10.12. EcooFeed LLC

10.12.1. Company Overview

10.12.2. Financial Overview

10.12.3. Products Offered

10.12.4. Key Developments

10.12.5. SWOT Analysis

10.12.6. Key Strategies

11. APPENDIX

11.1. General Sources & References

11.2. List of Abbreviations

LIST OF TABLES

Table 1 Global Plasma Feed Market, by Region, 2022-2030 (USD Million)

Table 2 Global Plasma Feed Market, by Source, 2022-2030 (USD Million)

Table 3 Global Plasma Feed Market, by Application, 2022-2030 (USD Million)

Table 4 North America: Plasma Feed Market, by Country, 2022-2030 (USD Million)

Table 5 North America: Plasma Feed Market, by Source, 2022-2030 (USD Million)

Table 6 North America: Plasma Feed Market, by Application, 2022-2030 (USD Million)

Table 7 US: Plasma Feed Market, by Source, 2022-2030 (USD Million)

Table 8 US: Plasma Feed Market, by Application, 2022-2030 (USD Million)

Table 9 Canada: Plasma Feed Market, by Source, 2022-2030 (USD Million)

Table 10 Canada: Plasma Feed Market, by Application, 2022-2030 (USD Million)

Table 11 Mexico: Plasma Feed Market, by Source, 2022-2030 (USD Million)

Table 12 Mexico: Plasma Feed Market, by Application, 2022-2030 (USD Million)

Table 13 Europe: Plasma Feed Market, by Country, 2022-2030 (USD Million)

Table 14 Europe: Plasma Feed Market, by Source, 2022-2030 (USD Million)

Table 15 Europe: Plasma Feed Market, by Application, 2022-2030 (USD Million)

Table 16 Germany: Plasma Feed Market, by Source, 2022-2030 (USD Million)

Table 17 Germany: Plasma Feed Market, by Application, 2022-2030 (USD Million)

Table 18 France: Plasma Feed Market, by Source, 2022-2030 (USD Million)

Table 19 France: Plasma Feed Market, by Application, 2022-2030 (USD Million)

Table 20 Italy: Plasma Feed Market, by Source, 2022-2030 (USD Million)

Table 21 Italy: Plasma Feed Market, by Application, 2022-2030 (USD Million)

Table 22 Spain: Plasma Feed Market, by Source, 2022-2030 (USD Million)

Table 23 Spain: Plasma Feed Market, by Application, 2022-2030 (USD Million)

Table 24 UK: Plasma Feed Market, by Source, 2022-2030 (USD Million)

Table 25 UK: Plasma Feed Market, by Application, 2022-2030 (USD Million)

Table 26 Rest of Europe: Plasma Feed Market, by Source, 2022-2030 (USD Million)

Table 27 Rest of Europe: Plasma Feed Market, by Application, 2022-2030 (USD Million)

Table 28 Asia-Pacific: Plasma Feed Market, by Country, 2022-2030 (USD Million)

Table 29 Asia-Pacific: Plasma Feed Market, by Source, 2022-2030 (USD Million)

Table 30 Asia-Pacific: Plasma Feed Market, by Application, 2022-2030 (USD Million)

Table 31 China: Plasma Feed Market, by Source, 2022-2030 (USD Million)

Table 32 China: Plasma Feed Market, by Application, 2022-2030 (USD Million)

Table 33 India: Plasma Feed Market, by Source, 2022-2030 (USD Million)

Table 34 India: Plasma Feed Market, by Application, 2022-2030 (USD Million)

Table 35 Japan: Plasma Feed Market, by Source, 2022-2030 (USD Million)

Table 36 Japan: Plasma Feed Market, by Application, 2022-2030 (USD Million)

Table 37 Australia & New Zealand: Plasma Feed Market, by Source, 2022-2030 (USD Million)

Table 38 Australia & New Zealand: Plasma Feed Market, by Application, 2022-2030 (USD Million)

Table 39 Rest of Asia-Pacific: Plasma Feed Market, by Source, 2022-2030 (USD Million)

Table 40 Rest of Asia-Pacific: Plasma Feed Market, by Application, 2022-2030 (USD Million)

Table 41 Rest of the World (RoW): Plasma Feed Market, by Country, 2022-2030 (USD Million)

Table 42 Rest of the World (RoW): Plasma Feed Market, by Source, 2022-2030 (USD Million)

Table 43 Rest of the World (RoW): Plasma Feed Market, by Application, 2022-2030 (USD Million)

Table 44 South America: Plasma Feed Market, by Source, 2022-2030 (USD Million)

Table 45 South America: Plasma Feed Market, by Application, 2022-2030 (USD Million)

Table 46 Middle East: Plasma Feed Market, by Source, 2022-2030 (USD Million)

Table 47 Middle East: Plasma Feed Market, by Application, 2022-2030 (USD Million)

Table 48 Africa: Plasma Feed Market, by Source, 2022-2030 (USD Million)

Table 49 Africa: Plasma Feed Market, by Application, 2022-2030 (USD Million)

LIST OF FIGURES

FIGURE 1 Global Plasma Feed Market Segmentation

FIGURE 2 Forecast Research Methodology

FIGURE 3 Five Forces Analysis of the Global Plasma Feed Market

FIGURE 4 Value Chain of the Global Plasma Feed Market

FIGURE 5 Share of the Global Plasma Feed Market in 2020, by Country (%)

FIGURE 6 Global Plasma Feed Market, by Region, 2022-2030,

FIGURE 7 Global Plasma Feed Market Size, by Source, 2020

FIGURE 8 Share of the Global Plasma Feed Market, by Source, 2022-2030 (%)

FIGURE 9 Global Plasma Feed Market Size, by Application, 2020

FIGURE 10 Share of the Global Plasma Feed Market, by Application, 2022-2030 (%)

Leading companies partner with us for data-driven Insights.
Report List icon Report List icon Report List icon Report List icon Report List icon Report List icon Report List icon Report List icon Report List icon Report List icon Report List icon

Kindly complete the form below to receive a free sample of this Report

Please fill in Business Email for Quick Response
Invalid