×
  • Cat-intel
  • MedIntelliX
  • Resources
  • About Us
  • Hero Background
    English
    Chinese
    French
    Japanese
    Korean
    German
    Spanish

    Phosphoric Acid Market Trends

    ID: MRFR/CnM/10544-CR
    111 Pages
    Chitranshi Jaiswal
    July 2025

    Phosphoric Acid Market Research Report: By Source (Wet Process, Thermal Process), By Application (Fertilizers, Feed & Food Additives, Detergents, Water Treatment Chemicals, Others) and By Regional (North America, Europe, South America, Asia Pacific, Middle East and Africa) - Forecast to 2035.

    Share:
    Download PDF ×

    We do not share your information with anyone. However, we may send you emails based on your report interest from time to time. You may contact us at any time to opt-out.

    Phosphoric Acid Market Infographic
    Purchase Options

    Market Trends

    Key Emerging Trends in the Phosphoric Acid Market

    The current Phosphoric Acid market reflects various trends driven by its multiple applications across different industries, including agriculture, food & beverage, and chemicals, among others. It has been observed that Phosphoric Acid is an important chemical compound that has attracted significant demand, hence changing the market dynamics accordingly. For instance, phosphoric acid is increasingly used as a fertilizer within this segment. Additionally, the food-grade phosphoric acid market is expanding rapidly. As such, the latter has been found to be applicable in numerous foods and beverages, where it acts as an acidic agent or an acidity regulator, resulting in their distinct tart taste characteristics. Hence, increased consumption of soft drinks like carbonated beverages coupled with processed foods such as convenience products contributes to demands for this product on a global scale within the food sector. This shows how consumer preferences vary over time while phosphoric acid remains key to meeting dynamic demands for diverse appealing foods and drinks. Furthermore, there has been remarkable growth in the industrial-grade phosphoric acid market recently, too. In terms of making detergents or treating metals or water, this product plays a vital role in several industrial processes worldwide today due to its multiple uses mentioned above. Thus, the increasing industrial applications of phosphoric acid are in line with global manufacturing activities that have expanded significantly, as well as wider industrialization. Besides, the electronic-grade phosphoric acid industry is expected to witness robust growth. High-purity phosphoric acid is used to produce electronic components. It is also utilized as a cleaning agent in semiconductor manufacturing processes due to the development of electronics and semiconductor industries. Therefore, technological changes in this field and the demand for accuracy in the production of electronic devices necessitate the use of this substance. Government food safety regulations and various standards on environmental concerns and industrial chemical use are seen to be driving trends in phosphoric acid markets. Regulatory authorities worldwide have introduced standards aimed at ensuring that phosphoric acid can be used safely within their jurisdictions. However, there are challenges, including environmental concerns, competition from alternative sources of phosphorus, and volatility in the prices of raw materials. Phosphorus runoffs into the water coming from agricultural activities associated with the use of fertilizers made up of phosphoric acid have raised questions about the quality of water as well as sustainability issues, among others. These challenges require continuous research so as to develop sustainable environmental practices for managing phosphorous.

    Author
    Chitranshi Jaiswal
    Research Analyst Level I

    In her 3 years of experience in the market research field, she has handled critical cross-domain projects. She has an in-depth knowledge of market estimation & analysis, problem-solving, primary as well as secondary research, and team management.She holds an engineering degree and is an MBA professional from a well-known university, capable of evaluating the market and competitive conditions. An exceptional strategist with excellent communication skills and a passion for delivering cutting-edge & practical insights for the market. Proficient in multi-tasking, and can successfully deal with competing demands, while maintaining complete confidentiality. Generated business through active client and project development, networking, and high-quality responses. Her knowledge and skills have helped in making solid business decisions, securing funding from investors, and avoiding business failures.

    Leave a Comment

    FAQs

    What is the expected market size of the Phosphoric Acid Market in 2024?

    The Phosphoric Acid Market is expected to be valued at 55.88 USD billion in 2024.

    What will be the market value of the Phosphoric Acid Market by 2035?

    By 2035, the Phosphoric Acid Market is anticipated to reach a value of 89.45 USD billion.

    What is the projected compound annual growth rate (CAGR) for the Phosphoric Acid Market from 2025 to 2035?

    The expected CAGR for the Phosphoric Acid Market from 2025 to 2035 is 4.37%.

    Which region is expected to hold the largest market share for the Phosphoric Acid Market in 2024?

    North America is projected to have the largest market share, valued at 15.5 USD Billion in 2024.

    What is the expected market size for the Phosphoric Acid Market in the Asia Pacific region by 2035?

    The Asia Pacific region is expected to reach a market size of 28.0 USD billion by 2035.

    Who are the key players in the Phosphoric Acid Market?

    Major players in the market include Canpotex, AdvanSix, PhosAgro, and OCI Nitrogen, among others.

    What is the market size for the Wet Process of Phosphoric Acid in 2024?

    The Wet Process of Phosphoric Acid is valued at 31.08 USD billion in 2024.

    What is the expected growth of the Thermal Process segment by 2035?

    The Thermal Process segment is anticipated to reach 38.74 USD billion by 2035.

    What is the value of the South American Phosphoric Acid Market in 2024?

    The South American Phosphoric Acid Market is valued at 5.5 USD Billion in 2024.

    What are the primary applications driving the demand for Phosphoric Acid?

    The primary applications driving demand for Phosphoric Acid include fertilizers, food additives, and industrial applications.

    Market Summary

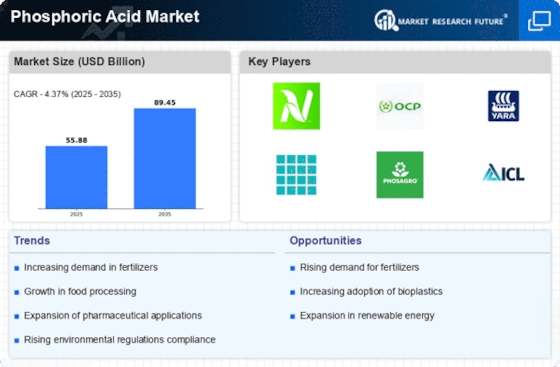
    As per MRFR analysis, the Phosphoric Acid Market Size was estimated at 55.88 USD Billion in 2024. The Phosphoric Acid industry is projected to grow from 58.32 USD Billion in 2025 to 89.45 USD Billion by 2035, exhibiting a compound annual growth rate (CAGR) of 4.37 during the forecast period 2025 - 2035.

    Key Market Trends & Highlights

    The Phosphoric Acid Market is currently experiencing a shift towards sustainable practices and technological advancements.

    • North America remains the largest market for phosphoric acid, driven by robust fertilizer production.
    • Asia-Pacific is the fastest-growing region, reflecting increasing industrial applications and demand.
    • The Wet Process segment dominates the market, while the Thermal Process segment is witnessing rapid growth.
    • Rising demand in fertilizer production and growing environmental regulations are key drivers influencing market dynamics.

    Market Size & Forecast

    2024 Market Size 55.88 (USD Billion)
    2035 Market Size 89.45 (USD Billion)
    CAGR (2025 - 2035) 4.37%
    Largest Regional Market Share in 2024 North America

    Major Players

    <p>Nutrien (CA), OCP Group (MA), Yara International (NO), Mosaic Company (US), PhosAgro (RU), ICL Group (IL), K+S AG (DE), Coromandel International (IN), EuroChem Group (RU)</p>

    Market Trends

    The Phosphoric Acid Market is currently experiencing a dynamic phase characterized by evolving demand patterns and innovative applications. The agricultural sector remains a primary driver, as phosphoric acid is essential for producing fertilizers that enhance crop yields. Additionally, the food and beverage industry increasingly utilizes phosphoric acid as an acidity regulator and flavoring agent, which further propels market growth. Environmental considerations are also influencing production methods, with a noticeable shift towards sustainable practices. This transition reflects a broader trend within the chemical industry, where eco-friendly solutions are gaining traction. Moreover, the Phosphoric Acid Market is witnessing advancements in technology that improve production efficiency and reduce waste. Companies are investing in research and development to create more effective processes, which may lead to cost reductions and enhanced product quality. As global populations continue to rise, the demand for phosphoric acid is likely to increase, prompting manufacturers to adapt to changing market conditions. Overall, the Phosphoric Acid Market appears poised for continued growth, driven by diverse applications and a commitment to sustainability.

    Sustainable Production Practices

    The Phosphoric Acid Market is increasingly influenced by the adoption of sustainable production methods. Manufacturers are exploring eco-friendly alternatives to traditional processes, aiming to minimize environmental impact. This trend reflects a broader commitment to sustainability within the chemical sector, as companies seek to align with global environmental goals.

    Technological Advancements

    Innovations in production technology are reshaping the Phosphoric Acid Market. Enhanced processes are being developed to improve efficiency and reduce waste, which may lead to cost savings for manufacturers. These advancements could also result in higher quality products, catering to the evolving needs of various industries.

    Diverse Applications

    The versatility of phosphoric acid is driving its demand across multiple sectors. Beyond agriculture, its use in food and beverage applications as an acidity regulator is expanding. This diversification suggests a robust market potential, as industries seek to leverage phosphoric acid's unique properties for various purposes.

    Phosphoric Acid Market Market Drivers

    Expanding Demand in Emerging Economies

    The Phosphoric Acid Market is witnessing expanding demand in emerging economies, where rapid industrialization and urbanization are driving growth. Countries in Asia and Africa are experiencing increased agricultural activities, leading to a higher requirement for fertilizers and, consequently, phosphoric acid. The rising middle class in these regions is also contributing to the demand for processed foods, which often utilize phosphoric acid as an additive. Market analysis indicates that the demand for phosphoric acid in these emerging markets is expected to grow at a rate of approximately 5 percent annually, reflecting the potential for significant market expansion. This trend presents opportunities for manufacturers to tap into new markets and diversify their customer base.

    Rising Demand in Fertilizer Production

    The Phosphoric Acid Market is experiencing a notable surge in demand, primarily driven by the increasing need for fertilizers in agriculture. Phosphoric acid serves as a key ingredient in the production of phosphate fertilizers, which are essential for enhancing crop yields. As the global population continues to grow, the pressure on agricultural productivity intensifies, leading to a projected increase in fertilizer consumption. According to recent data, the fertilizer segment accounts for a substantial portion of the phosphoric acid market, with estimates suggesting that it constitutes over 80 percent of the total demand. This trend indicates a robust growth trajectory for the phosphoric acid market, as agricultural stakeholders seek to optimize their output to meet food security challenges.

    Technological Innovations in Production Processes

    The Phosphoric Acid Market is poised for transformation due to ongoing technological innovations in production processes. Advances in extraction and purification techniques are enhancing the efficiency of phosphoric acid production, thereby reducing costs and environmental impact. For instance, the development of more sustainable methods, such as the use of renewable energy sources in production, is gaining traction. These innovations not only improve the economic viability of phosphoric acid production but also align with the increasing regulatory focus on sustainability. As a result, companies that adopt these technologies may gain a competitive edge, potentially leading to increased market share in the phosphoric acid industry.

    Industrial Applications and Chemical Manufacturing

    The Phosphoric Acid Market is significantly influenced by its diverse applications in various industrial sectors. Beyond fertilizers, phosphoric acid is utilized in the production of food additives, detergents, and pharmaceuticals. The food industry, in particular, employs phosphoric acid as an acidity regulator and flavoring agent, which has led to a steady demand in this sector. Furthermore, the chemical manufacturing sector leverages phosphoric acid in the synthesis of various chemicals, contributing to its market growth. Recent statistics indicate that the industrial applications segment is projected to grow at a compound annual growth rate of approximately 4 percent over the next few years, underscoring the importance of phosphoric acid in multiple industries.

    Growing Environmental Regulations and Sustainability Initiatives

    The Phosphoric Acid Market is increasingly shaped by growing environmental regulations and sustainability initiatives. Governments and regulatory bodies are imposing stricter guidelines on chemical production processes, prompting manufacturers to adopt greener practices. This shift towards sustainability is influencing the phosphoric acid market, as companies are compelled to innovate and reduce their carbon footprint. The emphasis on eco-friendly production methods is likely to drive investment in research and development, fostering the creation of more sustainable phosphoric acid products. As a result, the market may witness a transformation in production methodologies, aligning with global sustainability goals and consumer preferences for environmentally responsible products.

    Market Segment Insights

    By Source: Wet Process (Largest) vs. Thermal Process (Fastest-Growing)

    <p>The Phosphoric Acid Market is primarily composed of two key segments: Wet Process and Thermal Process. The Wet Process holds the largest share, characterized by its widespread application and acceptance across various industries. This process utilizes phosphate rock, sulfuric acid, and water to produce phosphoric acid, making it more accessible and economically viable. In contrast, the Thermal Process, though smaller in market share, is gaining traction due to advancements in technology and increasing applications in specialized sectors.</p>

    <p>Source: Wet Process (Dominant) vs. Thermal Process (Emerging)</p>

    <p>The Wet Process remains the dominant source of phosphoric acid production, favored for its efficiency and cost-effectiveness. This method produces high yields of phosphoric acid, making it the preferred choice for fertilizers and food additives. On the other hand, the Thermal Process is emerging rapidly, driven by its ability to produce higher purity phosphoric acid. This process is particularly attractive for specialized applications such as electronics and pharmaceuticals, where quality is paramount. As industries continue to evolve, the demand for higher purity acids will likely fuel the growth of the Thermal Process, positioning it as a key player in the phosphoric acid landscape.</p>

    By Application: Fertilizers (Largest) vs. Feed & Food Additives (Fastest-Growing)

    <p>In the phosphoric acid market, fertilizers hold the largest share due to their critical role in enhancing agricultural productivity. This segment benefits from the increasing demand for food, driven by a growing global population and dietary shifts towards more nutrition-intensive crops. In contrast, the feed and food additives segment, while smaller in share, is expanding rapidly as health consciousness rises among consumers, emphasizing the importance of nutrient-rich diets.</p>

    <p>Fertilizers (Dominant) vs. Feed & Food Additives (Emerging)</p>

    <p>Fertilizers remain the dominant application of phosphoric acid, with its indispensable use in producing phosphate fertilizers that stimulate crop growth. This segment capitalizes on the robust agricultural sector that continuously seeks to enhance yields. Meanwhile, the feed and food additives segment is emerging, with phosphoric acid being used to fortify animal feeds and food products, enhancing their nutritional value. As health trends evolve, the demand for feed and food additives is expected to increase significantly, driven by innovations and advancements in food technology and animal nutrition.</p>

    Get more detailed insights about Phosphoric Acid Market Research Report – Forecast Till 2035

    Regional Insights

    North America : Market Leader in Phosphoric Acid

    North America is the largest market for phosphoric acid, holding approximately 40% of the global share. The region's growth is driven by increasing agricultural activities and the rising demand for fertilizers. Regulatory support for sustainable farming practices further boosts market dynamics. The U.S. is the primary contributor, followed by Canada, which is also expanding its production capabilities to meet domestic and export needs. The competitive landscape in North America features key players like Nutrien and Mosaic Company, which dominate the market with their extensive distribution networks and innovative product offerings. The presence of advanced manufacturing facilities and a focus on research and development enhance the region's competitive edge. As the demand for phosphoric acid continues to rise, these companies are well-positioned to capitalize on emerging opportunities.

    Europe : Sustainable Practices Drive Growth

    Europe is witnessing significant growth in the phosphoric acid market, accounting for about 25% of the global share. The region's demand is primarily driven by the agricultural sector's shift towards sustainable practices and organic farming. Regulatory frameworks, such as the EU Fertilizers Regulation, promote the use of phosphoric acid in eco-friendly fertilizers, enhancing market prospects. Countries like Germany and France are leading this trend, with increasing investments in sustainable agriculture. The competitive landscape in Europe is characterized by major players like Yara International and K+S AG, which are focusing on innovation and sustainability. The presence of advanced research institutions and a strong emphasis on environmental regulations foster a conducive environment for market growth. As the demand for sustainable fertilizers rises, these companies are adapting their strategies to meet evolving consumer preferences and regulatory requirements.

    Asia-Pacific : Emerging Markets and Growth Potential

    Asia-Pacific is an emerging powerhouse in the phosphoric acid market, holding approximately 30% of the global share. The region's rapid industrialization and increasing agricultural activities are key drivers of demand. Countries like China and India are leading the market, with significant investments in agricultural infrastructure and fertilizer production. Government initiatives aimed at enhancing food security further catalyze market growth, making this region a focal point for future investments. The competitive landscape in Asia-Pacific features key players such as Coromandel International and OCP Group, which are expanding their operations to meet the growing demand. The presence of a large agricultural base and increasing awareness of fertilizer efficiency are driving companies to innovate and improve their product offerings. As the market continues to evolve, these players are well-positioned to leverage growth opportunities in the region.

    Middle East and Africa : Resource-Rich and Growing Demand

    The Middle East and Africa region is witnessing a growing demand for phosphoric acid, accounting for about 5% of the global market share. The region's growth is driven by strategic investments in agriculture and the need for fertilizers to enhance crop yields. Countries like Morocco and South Africa are leading the charge, with significant reserves of phosphate rock and increasing production capacities. Government initiatives aimed at boosting agricultural productivity further support market growth. The competitive landscape in this region includes key players like OCP Group and PhosAgro, which are leveraging their resource-rich environments to expand their market presence. The focus on sustainable agricultural practices and the development of local manufacturing capabilities are essential for meeting the rising demand. As the market matures, these companies are expected to play a crucial role in shaping the future of the phosphoric acid industry in the region.

    Key Players and Competitive Insights

    The Phosphoric Acid Market has been experiencing significant shifts due to a variety of factors, including increasing demand from various end-use industries, technological advancements, and changes in trading patterns. In recent years, phosphoric acid has gained prominence as a key ingredient in fertilizers, food additives, and other chemical processes, thereby intensifying competition among market players. Companies are focusing on enhancing their product offerings, improving production processes, and expanding their geographical footprint to secure a competitive edge.

    The growing trend towards sustainable practices and environmentally friendly products has further prompted stakeholders to innovate and adapt their strategies in order to meet changing consumer preferences and regulatory requirements. Overall, the competitive landscape of the Phosphoric Acid Market is characterized by strategic partnerships, collaborations, mergers, and acquisitions, all aimed at consolidating market share and reinforcing brand identity in this dynamic industry.

    PhosAgro is a dominant force in the phosphoric acid market, consistently setting production milestones. For the first time in 2023, it exceeded 3 million tonnes of phosphoric acid and intends to increase its capacity by modernizing its facilities. These accomplishments are indicative of PhosAgro's strategic investments, efficient operations, and dedication to the integration of phosphate rock processing. PhosAgro's leadership in the supply of high-quality phosphoric acid to the fertilizer and industrial markets is assured by its scale and innovation.

    Innophos is a prominent manufacturer of specialty phosphoric acid, known for its emphasis on high-purity varieties that are specifically designed for demanding applications. Innophos provides phosphoric acid that is food, technical, and battery-grade, and it meets the rigorous quality standards of the industry. The company has manufacturing facilities in North America, Mexico, Canada, and China. The organization prioritizes the resilience of its supply chain by employing integrated production processes to guarantee traceable and dependable deliveries. Innophos customizes formulations to meet the unique requirements of a variety of industries, including pharmaceuticals, water treatment, food and beverage, and lithium-ion battery materials.

    In markets that necessitate refined, high-performance phosphoric acid solutions, Innophos is a preferred partner due to its dedication to innovation and extensive knowledge of phosphate chemistry.

    Key Companies in the Phosphoric Acid Market market include

    Industry Developments

    • Q2 2024: Coromandel International initiates establishment of INR 1,000 crore phosphoric and sulphuric acid complex in 2024 at its Kakinada facility in Andhra Pradesh Coromandel International began construction of a new phosphoric and sulphuric acid complex at its Kakinada facility in Andhra Pradesh, India, with an investment of INR 1,000 crore. The project aims to expand production capacity and is scheduled for completion within two years.
    • Q2 2024: Paradeep Phosphates Limited sanctions brownfield expansion of in-house phosphoric acid production capacity, with an estimated investment of INR 2,500 million Paradeep Phosphates Limited approved a brownfield expansion of its phosphoric acid production capacity, investing INR 2,500 million to achieve full backward integration in fertilizer manufacturing and reduce reliance on imports.

    Future Outlook

    Phosphoric Acid Market Future Outlook

    <p>The Phosphoric Acid Market is projected to grow at a 4.37% CAGR from 2024 to 2035, driven by increasing demand in agriculture, food processing, and industrial applications.</p>

    New opportunities lie in:

    • <p>Expansion into bio-based phosphoric acid production</p>
    • <p>Development of high-efficiency fertilizers incorporating phosphoric acid</p>
    • <p>Strategic partnerships with food and beverage manufacturers for tailored solutions</p>

    <p>By 2035, the Phosphoric Acid Market is expected to achieve robust growth and enhanced market positioning.</p>

    Market Segmentation

    Phosphoric Acid Market Source Outlook

    • Wet Process
    • Thermal Process

    Phosphoric Acid Market Regional Outlook

    • North America
    • Europe
    • South America
    • Asia Pacific
    • Middle East and Africa

    Phosphoric Acid Market Application Outlook

    • Fertilizers
    • Feed & Food Additives
    • Detergents
    • Water Treatment Chemicals
    • Others

    Report Scope

    MARKET SIZE 202455.88(USD Billion)
    MARKET SIZE 202558.32(USD Billion)
    MARKET SIZE 203589.45(USD Billion)
    COMPOUND ANNUAL GROWTH RATE (CAGR)4.37% (2024 - 2035)
    REPORT COVERAGERevenue Forecast, Competitive Landscape, Growth Factors, and Trends
    BASE YEAR2024
    Market Forecast Period2025 - 2035
    Historical Data2019 - 2024
    Market Forecast UnitsUSD Billion
    Key Companies ProfiledMarket analysis in progress
    Segments CoveredMarket segmentation analysis in progress
    Key Market OpportunitiesGrowing demand for sustainable fertilizers drives innovation in the Phosphoric Acid Market.
    Key Market DynamicsRising demand for fertilizers drives phosphoric acid production, influencing supply chain dynamics and competitive landscape.
    Countries CoveredNorth America, Europe, APAC, South America, MEA

    FAQs

    What is the expected market size of the Phosphoric Acid Market in 2024?

    The Phosphoric Acid Market is expected to be valued at 55.88 USD billion in 2024.

    What will be the market value of the Phosphoric Acid Market by 2035?

    By 2035, the Phosphoric Acid Market is anticipated to reach a value of 89.45 USD billion.

    What is the projected compound annual growth rate (CAGR) for the Phosphoric Acid Market from 2025 to 2035?

    The expected CAGR for the Phosphoric Acid Market from 2025 to 2035 is 4.37%.

    Which region is expected to hold the largest market share for the Phosphoric Acid Market in 2024?

    North America is projected to have the largest market share, valued at 15.5 USD Billion in 2024.

    What is the expected market size for the Phosphoric Acid Market in the Asia Pacific region by 2035?

    The Asia Pacific region is expected to reach a market size of 28.0 USD billion by 2035.

    Who are the key players in the Phosphoric Acid Market?

    Major players in the market include Canpotex, AdvanSix, PhosAgro, and OCI Nitrogen, among others.

    What is the market size for the Wet Process of Phosphoric Acid in 2024?

    The Wet Process of Phosphoric Acid is valued at 31.08 USD billion in 2024.

    What is the expected growth of the Thermal Process segment by 2035?

    The Thermal Process segment is anticipated to reach 38.74 USD billion by 2035.

    What is the value of the South American Phosphoric Acid Market in 2024?

    The South American Phosphoric Acid Market is valued at 5.5 USD Billion in 2024.

    What are the primary applications driving the demand for Phosphoric Acid?

    The primary applications driving demand for Phosphoric Acid include fertilizers, food additives, and industrial applications.

    1. SECTION I: EXECUTIVE SUMMARY AND KEY HIGHLIGHTS
      1. | 1.1 EXECUTIVE SUMMARY
      2. | | 1.1.1 Market Overview
      3. | | 1.1.2 Key Findings
      4. | | 1.1.3 Market Segmentation
      5. | | 1.1.4 Competitive Landscape
      6. | | 1.1.5 Challenges and Opportunities
      7. | | 1.1.6 Future Outlook
    2. SECTION II: SCOPING, METHODOLOGY AND MARKET STRUCTURE
      1. | 2.1 MARKET INTRODUCTION
      2. | | 2.1.1 Definition
      3. | | 2.1.2 Scope of the study
      4. | | | 2.1.2.1 Research Objective
      5. | | | 2.1.2.2 Assumption
      6. | | | 2.1.2.3 Limitations
      7. | 2.2 RESEARCH METHODOLOGY
      8. | | 2.2.1 Overview
      9. | | 2.2.2 Data Mining
      10. | | 2.2.3 Secondary Research
      11. | | 2.2.4 Primary Research
      12. | | | 2.2.4.1 Primary Interviews and Information Gathering Process
      13. | | | 2.2.4.2 Breakdown of Primary Respondents
      14. | | 2.2.5 Forecasting Model
      15. | | 2.2.6 Market Size Estimation
      16. | | | 2.2.6.1 Bottom-Up Approach
      17. | | | 2.2.6.2 Top-Down Approach
      18. | | 2.2.7 Data Triangulation
      19. | | 2.2.8 Validation
    3. SECTION III: QUALITATIVE ANALYSIS
      1. | 3.1 MARKET DYNAMICS
      2. | | 3.1.1 Overview
      3. | | 3.1.2 Drivers
      4. | | 3.1.3 Restraints
      5. | | 3.1.4 Opportunities
      6. | 3.2 MARKET FACTOR ANALYSIS
      7. | | 3.2.1 Value chain Analysis
      8. | | 3.2.2 Porter's Five Forces Analysis
      9. | | | 3.2.2.1 Bargaining Power of Suppliers
      10. | | | 3.2.2.2 Bargaining Power of Buyers
      11. | | | 3.2.2.3 Threat of New Entrants
      12. | | | 3.2.2.4 Threat of Substitutes
      13. | | | 3.2.2.5 Intensity of Rivalry
      14. | | 3.2.3 COVID-19 Impact Analysis
      15. | | | 3.2.3.1 Market Impact Analysis
      16. | | | 3.2.3.2 Regional Impact
      17. | | | 3.2.3.3 Opportunity and Threat Analysis
    4. SECTION IV: QUANTITATIVE ANALYSIS
      1. | 4.1 Chemicals and Materials, BY Source (USD Billion)
      2. | | 4.1.1 Wet Process
      3. | | 4.1.2 Thermal Process
      4. | 4.2 Chemicals and Materials, BY Application (USD Billion)
      5. | | 4.2.1 Fertilizers
      6. | | 4.2.2 Feed & Food Additives
      7. | | 4.2.3 Detergents
      8. | | 4.2.4 Water Treatment Chemicals
      9. | | 4.2.5 Others
      10. | 4.3 Chemicals and Materials, BY Region (USD Billion)
      11. | | 4.3.1 North America
      12. | | | 4.3.1.1 US
      13. | | | 4.3.1.2 Canada
      14. | | 4.3.2 Europe
      15. | | | 4.3.2.1 Germany
      16. | | | 4.3.2.2 UK
      17. | | | 4.3.2.3 France
      18. | | | 4.3.2.4 Russia
      19. | | | 4.3.2.5 Italy
      20. | | | 4.3.2.6 Spain
      21. | | | 4.3.2.7 Rest of Europe
      22. | | 4.3.3 APAC
      23. | | | 4.3.3.1 China
      24. | | | 4.3.3.2 India
      25. | | | 4.3.3.3 Japan
      26. | | | 4.3.3.4 South Korea
      27. | | | 4.3.3.5 Malaysia
      28. | | | 4.3.3.6 Thailand
      29. | | | 4.3.3.7 Indonesia
      30. | | | 4.3.3.8 Rest of APAC
      31. | | 4.3.4 South America
      32. | | | 4.3.4.1 Brazil
      33. | | | 4.3.4.2 Mexico
      34. | | | 4.3.4.3 Argentina
      35. | | | 4.3.4.4 Rest of South America
      36. | | 4.3.5 MEA
      37. | | | 4.3.5.1 GCC Countries
      38. | | | 4.3.5.2 South Africa
      39. | | | 4.3.5.3 Rest of MEA
    5. SECTION V: COMPETITIVE ANALYSIS
      1. | 5.1 Competitive Landscape
      2. | | 5.1.1 Overview
      3. | | 5.1.2 Competitive Analysis
      4. | | 5.1.3 Market share Analysis
      5. | | 5.1.4 Major Growth Strategy in the Chemicals and Materials
      6. | | 5.1.5 Competitive Benchmarking
      7. | | 5.1.6 Leading Players in Terms of Number of Developments in the Chemicals and Materials
      8. | | 5.1.7 Key developments and growth strategies
      9. | | | 5.1.7.1 New Product Launch/Service Deployment
      10. | | | 5.1.7.2 Merger & Acquisitions
      11. | | | 5.1.7.3 Joint Ventures
      12. | | 5.1.8 Major Players Financial Matrix
      13. | | | 5.1.8.1 Sales and Operating Income
      14. | | | 5.1.8.2 Major Players R&D Expenditure. 2023
      15. | 5.2 Company Profiles
      16. | | 5.2.1 Nutrien (CA)
      17. | | | 5.2.1.1 Financial Overview
      18. | | | 5.2.1.2 Products Offered
      19. | | | 5.2.1.3 Key Developments
      20. | | | 5.2.1.4 SWOT Analysis
      21. | | | 5.2.1.5 Key Strategies
      22. | | 5.2.2 OCP Group (MA)
      23. | | | 5.2.2.1 Financial Overview
      24. | | | 5.2.2.2 Products Offered
      25. | | | 5.2.2.3 Key Developments
      26. | | | 5.2.2.4 SWOT Analysis
      27. | | | 5.2.2.5 Key Strategies
      28. | | 5.2.3 Yara International (NO)
      29. | | | 5.2.3.1 Financial Overview
      30. | | | 5.2.3.2 Products Offered
      31. | | | 5.2.3.3 Key Developments
      32. | | | 5.2.3.4 SWOT Analysis
      33. | | | 5.2.3.5 Key Strategies
      34. | | 5.2.4 Mosaic Company (US)
      35. | | | 5.2.4.1 Financial Overview
      36. | | | 5.2.4.2 Products Offered
      37. | | | 5.2.4.3 Key Developments
      38. | | | 5.2.4.4 SWOT Analysis
      39. | | | 5.2.4.5 Key Strategies
      40. | | 5.2.5 PhosAgro (RU)
      41. | | | 5.2.5.1 Financial Overview
      42. | | | 5.2.5.2 Products Offered
      43. | | | 5.2.5.3 Key Developments
      44. | | | 5.2.5.4 SWOT Analysis
      45. | | | 5.2.5.5 Key Strategies
      46. | | 5.2.6 ICL Group (IL)
      47. | | | 5.2.6.1 Financial Overview
      48. | | | 5.2.6.2 Products Offered
      49. | | | 5.2.6.3 Key Developments
      50. | | | 5.2.6.4 SWOT Analysis
      51. | | | 5.2.6.5 Key Strategies
      52. | | 5.2.7 K+S AG (DE)
      53. | | | 5.2.7.1 Financial Overview
      54. | | | 5.2.7.2 Products Offered
      55. | | | 5.2.7.3 Key Developments
      56. | | | 5.2.7.4 SWOT Analysis
      57. | | | 5.2.7.5 Key Strategies
      58. | | 5.2.8 Coromandel International (IN)
      59. | | | 5.2.8.1 Financial Overview
      60. | | | 5.2.8.2 Products Offered
      61. | | | 5.2.8.3 Key Developments
      62. | | | 5.2.8.4 SWOT Analysis
      63. | | | 5.2.8.5 Key Strategies
      64. | | 5.2.9 EuroChem Group (RU)
      65. | | | 5.2.9.1 Financial Overview
      66. | | | 5.2.9.2 Products Offered
      67. | | | 5.2.9.3 Key Developments
      68. | | | 5.2.9.4 SWOT Analysis
      69. | | | 5.2.9.5 Key Strategies
      70. | 5.3 Appendix
      71. | | 5.3.1 References
      72. | | 5.3.2 Related Reports
    6. LIST OF FIGURES
      1. | 6.1 MARKET SYNOPSIS
      2. | 6.2 NORTH AMERICA MARKET ANALYSIS
      3. | 6.3 US MARKET ANALYSIS BY SOURCE
      4. | 6.4 US MARKET ANALYSIS BY APPLICATION
      5. | 6.5 CANADA MARKET ANALYSIS BY SOURCE
      6. | 6.6 CANADA MARKET ANALYSIS BY APPLICATION
      7. | 6.7 EUROPE MARKET ANALYSIS
      8. | 6.8 GERMANY MARKET ANALYSIS BY SOURCE
      9. | 6.9 GERMANY MARKET ANALYSIS BY APPLICATION
      10. | 6.10 UK MARKET ANALYSIS BY SOURCE
      11. | 6.11 UK MARKET ANALYSIS BY APPLICATION
      12. | 6.12 FRANCE MARKET ANALYSIS BY SOURCE
      13. | 6.13 FRANCE MARKET ANALYSIS BY APPLICATION
      14. | 6.14 RUSSIA MARKET ANALYSIS BY SOURCE
      15. | 6.15 RUSSIA MARKET ANALYSIS BY APPLICATION
      16. | 6.16 ITALY MARKET ANALYSIS BY SOURCE
      17. | 6.17 ITALY MARKET ANALYSIS BY APPLICATION
      18. | 6.18 SPAIN MARKET ANALYSIS BY SOURCE
      19. | 6.19 SPAIN MARKET ANALYSIS BY APPLICATION
      20. | 6.20 REST OF EUROPE MARKET ANALYSIS BY SOURCE
      21. | 6.21 REST OF EUROPE MARKET ANALYSIS BY APPLICATION
      22. | 6.22 APAC MARKET ANALYSIS
      23. | 6.23 CHINA MARKET ANALYSIS BY SOURCE
      24. | 6.24 CHINA MARKET ANALYSIS BY APPLICATION
      25. | 6.25 INDIA MARKET ANALYSIS BY SOURCE
      26. | 6.26 INDIA MARKET ANALYSIS BY APPLICATION
      27. | 6.27 JAPAN MARKET ANALYSIS BY SOURCE
      28. | 6.28 JAPAN MARKET ANALYSIS BY APPLICATION
      29. | 6.29 SOUTH KOREA MARKET ANALYSIS BY SOURCE
      30. | 6.30 SOUTH KOREA MARKET ANALYSIS BY APPLICATION
      31. | 6.31 MALAYSIA MARKET ANALYSIS BY SOURCE
      32. | 6.32 MALAYSIA MARKET ANALYSIS BY APPLICATION
      33. | 6.33 THAILAND MARKET ANALYSIS BY SOURCE
      34. | 6.34 THAILAND MARKET ANALYSIS BY APPLICATION
      35. | 6.35 INDONESIA MARKET ANALYSIS BY SOURCE
      36. | 6.36 INDONESIA MARKET ANALYSIS BY APPLICATION
      37. | 6.37 REST OF APAC MARKET ANALYSIS BY SOURCE
      38. | 6.38 REST OF APAC MARKET ANALYSIS BY APPLICATION
      39. | 6.39 SOUTH AMERICA MARKET ANALYSIS
      40. | 6.40 BRAZIL MARKET ANALYSIS BY SOURCE
      41. | 6.41 BRAZIL MARKET ANALYSIS BY APPLICATION
      42. | 6.42 MEXICO MARKET ANALYSIS BY SOURCE
      43. | 6.43 MEXICO MARKET ANALYSIS BY APPLICATION
      44. | 6.44 ARGENTINA MARKET ANALYSIS BY SOURCE
      45. | 6.45 ARGENTINA MARKET ANALYSIS BY APPLICATION
      46. | 6.46 REST OF SOUTH AMERICA MARKET ANALYSIS BY SOURCE
      47. | 6.47 REST OF SOUTH AMERICA MARKET ANALYSIS BY APPLICATION
      48. | 6.48 MEA MARKET ANALYSIS
      49. | 6.49 GCC COUNTRIES MARKET ANALYSIS BY SOURCE
      50. | 6.50 GCC COUNTRIES MARKET ANALYSIS BY APPLICATION
      51. | 6.51 SOUTH AFRICA MARKET ANALYSIS BY SOURCE
      52. | 6.52 SOUTH AFRICA MARKET ANALYSIS BY APPLICATION
      53. | 6.53 REST OF MEA MARKET ANALYSIS BY SOURCE
      54. | 6.54 REST OF MEA MARKET ANALYSIS BY APPLICATION
      55. | 6.55 KEY BUYING CRITERIA OF CHEMICALS AND MATERIALS
      56. | 6.56 RESEARCH PROCESS OF MRFR
      57. | 6.57 DRO ANALYSIS OF CHEMICALS AND MATERIALS
      58. | 6.58 DRIVERS IMPACT ANALYSIS: CHEMICALS AND MATERIALS
      59. | 6.59 RESTRAINTS IMPACT ANALYSIS: CHEMICALS AND MATERIALS
      60. | 6.60 SUPPLY / VALUE CHAIN: CHEMICALS AND MATERIALS
      61. | 6.61 CHEMICALS AND MATERIALS, BY SOURCE, 2024 (% SHARE)
      62. | 6.62 CHEMICALS AND MATERIALS, BY SOURCE, 2024 TO 2035 (USD Billion)
      63. | 6.63 CHEMICALS AND MATERIALS, BY APPLICATION, 2024 (% SHARE)
      64. | 6.64 CHEMICALS AND MATERIALS, BY APPLICATION, 2024 TO 2035 (USD Billion)
      65. | 6.65 BENCHMARKING OF MAJOR COMPETITORS
    7. LIST OF TABLES
      1. | 7.1 LIST OF ASSUMPTIONS
      2. | | 7.1.1
      3. | 7.2 North America MARKET SIZE ESTIMATES; FORECAST
      4. | | 7.2.1 BY SOURCE, 2025-2035 (USD Billion)
      5. | | 7.2.2 BY APPLICATION, 2025-2035 (USD Billion)
      6. | 7.3 US MARKET SIZE ESTIMATES; FORECAST
      7. | | 7.3.1 BY SOURCE, 2025-2035 (USD Billion)
      8. | | 7.3.2 BY APPLICATION, 2025-2035 (USD Billion)
      9. | 7.4 Canada MARKET SIZE ESTIMATES; FORECAST
      10. | | 7.4.1 BY SOURCE, 2025-2035 (USD Billion)
      11. | | 7.4.2 BY APPLICATION, 2025-2035 (USD Billion)
      12. | 7.5 Europe MARKET SIZE ESTIMATES; FORECAST
      13. | | 7.5.1 BY SOURCE, 2025-2035 (USD Billion)
      14. | | 7.5.2 BY APPLICATION, 2025-2035 (USD Billion)
      15. | 7.6 Germany MARKET SIZE ESTIMATES; FORECAST
      16. | | 7.6.1 BY SOURCE, 2025-2035 (USD Billion)
      17. | | 7.6.2 BY APPLICATION, 2025-2035 (USD Billion)
      18. | 7.7 UK MARKET SIZE ESTIMATES; FORECAST
      19. | | 7.7.1 BY SOURCE, 2025-2035 (USD Billion)
      20. | | 7.7.2 BY APPLICATION, 2025-2035 (USD Billion)
      21. | 7.8 France MARKET SIZE ESTIMATES; FORECAST
      22. | | 7.8.1 BY SOURCE, 2025-2035 (USD Billion)
      23. | | 7.8.2 BY APPLICATION, 2025-2035 (USD Billion)
      24. | 7.9 Russia MARKET SIZE ESTIMATES; FORECAST
      25. | | 7.9.1 BY SOURCE, 2025-2035 (USD Billion)
      26. | | 7.9.2 BY APPLICATION, 2025-2035 (USD Billion)
      27. | 7.10 Italy MARKET SIZE ESTIMATES; FORECAST
      28. | | 7.10.1 BY SOURCE, 2025-2035 (USD Billion)
      29. | | 7.10.2 BY APPLICATION, 2025-2035 (USD Billion)
      30. | 7.11 Spain MARKET SIZE ESTIMATES; FORECAST
      31. | | 7.11.1 BY SOURCE, 2025-2035 (USD Billion)
      32. | | 7.11.2 BY APPLICATION, 2025-2035 (USD Billion)
      33. | 7.12 Rest of Europe MARKET SIZE ESTIMATES; FORECAST
      34. | | 7.12.1 BY SOURCE, 2025-2035 (USD Billion)
      35. | | 7.12.2 BY APPLICATION, 2025-2035 (USD Billion)
      36. | 7.13 APAC MARKET SIZE ESTIMATES; FORECAST
      37. | | 7.13.1 BY SOURCE, 2025-2035 (USD Billion)
      38. | | 7.13.2 BY APPLICATION, 2025-2035 (USD Billion)
      39. | 7.14 China MARKET SIZE ESTIMATES; FORECAST
      40. | | 7.14.1 BY SOURCE, 2025-2035 (USD Billion)
      41. | | 7.14.2 BY APPLICATION, 2025-2035 (USD Billion)
      42. | 7.15 India MARKET SIZE ESTIMATES; FORECAST
      43. | | 7.15.1 BY SOURCE, 2025-2035 (USD Billion)
      44. | | 7.15.2 BY APPLICATION, 2025-2035 (USD Billion)
      45. | 7.16 Japan MARKET SIZE ESTIMATES; FORECAST
      46. | | 7.16.1 BY SOURCE, 2025-2035 (USD Billion)
      47. | | 7.16.2 BY APPLICATION, 2025-2035 (USD Billion)
      48. | 7.17 South Korea MARKET SIZE ESTIMATES; FORECAST
      49. | | 7.17.1 BY SOURCE, 2025-2035 (USD Billion)
      50. | | 7.17.2 BY APPLICATION, 2025-2035 (USD Billion)
      51. | 7.18 Malaysia MARKET SIZE ESTIMATES; FORECAST
      52. | | 7.18.1 BY SOURCE, 2025-2035 (USD Billion)
      53. | | 7.18.2 BY APPLICATION, 2025-2035 (USD Billion)
      54. | 7.19 Thailand MARKET SIZE ESTIMATES; FORECAST
      55. | | 7.19.1 BY SOURCE, 2025-2035 (USD Billion)
      56. | | 7.19.2 BY APPLICATION, 2025-2035 (USD Billion)
      57. | 7.20 Indonesia MARKET SIZE ESTIMATES; FORECAST
      58. | | 7.20.1 BY SOURCE, 2025-2035 (USD Billion)
      59. | | 7.20.2 BY APPLICATION, 2025-2035 (USD Billion)
      60. | 7.21 Rest of APAC MARKET SIZE ESTIMATES; FORECAST
      61. | | 7.21.1 BY SOURCE, 2025-2035 (USD Billion)
      62. | | 7.21.2 BY APPLICATION, 2025-2035 (USD Billion)
      63. | 7.22 South America MARKET SIZE ESTIMATES; FORECAST
      64. | | 7.22.1 BY SOURCE, 2025-2035 (USD Billion)
      65. | | 7.22.2 BY APPLICATION, 2025-2035 (USD Billion)
      66. | 7.23 Brazil MARKET SIZE ESTIMATES; FORECAST
      67. | | 7.23.1 BY SOURCE, 2025-2035 (USD Billion)
      68. | | 7.23.2 BY APPLICATION, 2025-2035 (USD Billion)
      69. | 7.24 Mexico MARKET SIZE ESTIMATES; FORECAST
      70. | | 7.24.1 BY SOURCE, 2025-2035 (USD Billion)
      71. | | 7.24.2 BY APPLICATION, 2025-2035 (USD Billion)
      72. | 7.25 Argentina MARKET SIZE ESTIMATES; FORECAST
      73. | | 7.25.1 BY SOURCE, 2025-2035 (USD Billion)
      74. | | 7.25.2 BY APPLICATION, 2025-2035 (USD Billion)
      75. | 7.26 Rest of South America MARKET SIZE ESTIMATES; FORECAST
      76. | | 7.26.1 BY SOURCE, 2025-2035 (USD Billion)
      77. | | 7.26.2 BY APPLICATION, 2025-2035 (USD Billion)
      78. | 7.27 MEA MARKET SIZE ESTIMATES; FORECAST
      79. | | 7.27.1 BY SOURCE, 2025-2035 (USD Billion)
      80. | | 7.27.2 BY APPLICATION, 2025-2035 (USD Billion)
      81. | 7.28 GCC Countries MARKET SIZE ESTIMATES; FORECAST
      82. | | 7.28.1 BY SOURCE, 2025-2035 (USD Billion)
      83. | | 7.28.2 BY APPLICATION, 2025-2035 (USD Billion)
      84. | 7.29 South Africa MARKET SIZE ESTIMATES; FORECAST
      85. | | 7.29.1 BY SOURCE, 2025-2035 (USD Billion)
      86. | | 7.29.2 BY APPLICATION, 2025-2035 (USD Billion)
      87. | 7.30 Rest of MEA MARKET SIZE ESTIMATES; FORECAST
      88. | | 7.30.1 BY SOURCE, 2025-2035 (USD Billion)
      89. | | 7.30.2 BY APPLICATION, 2025-2035 (USD Billion)
      90. | 7.31 PRODUCT LAUNCH/PRODUCT DEVELOPMENT/APPROVAL
      91. | | 7.31.1
      92. | 7.32 ACQUISITION/PARTNERSHIP
      93. | | 7.32.1

    Phosphoric Acid Market Segmentation


    • Phosphoric Acid Market By Source (USD Billion, 2019-2035)

      • Wet Process
      • Thermal Process


    • Phosphoric Acid Market By Application (USD Billion, 2019-2035)

      • Fertilizers
      • Feed & Food Additives
      • Detergents
      • Water Treatment Chemicals
      • Others


    • Phosphoric Acid Market By Regional (USD Billion, 2019-2035)

      • North America
      • Europe
      • South America
      • Asia Pacific
      • Middle East and Africa


    Phosphoric Acid Market Regional Outlook (USD Billion, 2019-2035)


    • North America Outlook (USD Billion, 2019-2035)

      • North America Phosphoric Acid Market by Source Type

        • Wet Process
        • Thermal Process
      • North America Phosphoric Acid Market by Application Type

        • Fertilizers
        • Feed & Food Additives
        • Detergents
        • Water Treatment Chemicals
        • Others
      • North America Phosphoric Acid Market by Regional Type

        • US
        • Canada
      • US Outlook (USD Billion, 2019-2035)
      • US Phosphoric Acid Market by Source Type

        • Wet Process
        • Thermal Process
      • US Phosphoric Acid Market by Application Type

        • Fertilizers
        • Feed & Food Additives
        • Detergents
        • Water Treatment Chemicals
        • Others
      • CANADA Outlook (USD Billion, 2019-2035)
      • CANADA Phosphoric Acid Market by Source Type

        • Wet Process
        • Thermal Process
      • CANADA Phosphoric Acid Market by Application Type

        • Fertilizers
        • Feed & Food Additives
        • Detergents
        • Water Treatment Chemicals
        • Others
    • Europe Outlook (USD Billion, 2019-2035)

      • Europe Phosphoric Acid Market by Source Type

        • Wet Process
        • Thermal Process
      • Europe Phosphoric Acid Market by Application Type

        • Fertilizers
        • Feed & Food Additives
        • Detergents
        • Water Treatment Chemicals
        • Others
      • Europe Phosphoric Acid Market by Regional Type

        • Germany
        • UK
        • France
        • Russia
        • Italy
        • Spain
        • Rest of Europe
      • GERMANY Outlook (USD Billion, 2019-2035)
      • GERMANY Phosphoric Acid Market by Source Type

        • Wet Process
        • Thermal Process
      • GERMANY Phosphoric Acid Market by Application Type

        • Fertilizers
        • Feed & Food Additives
        • Detergents
        • Water Treatment Chemicals
        • Others
      • UK Outlook (USD Billion, 2019-2035)
      • UK Phosphoric Acid Market by Source Type

        • Wet Process
        • Thermal Process
      • UK Phosphoric Acid Market by Application Type

        • Fertilizers
        • Feed & Food Additives
        • Detergents
        • Water Treatment Chemicals
        • Others
      • FRANCE Outlook (USD Billion, 2019-2035)
      • FRANCE Phosphoric Acid Market by Source Type

        • Wet Process
        • Thermal Process
      • FRANCE Phosphoric Acid Market by Application Type

        • Fertilizers
        • Feed & Food Additives
        • Detergents
        • Water Treatment Chemicals
        • Others
      • RUSSIA Outlook (USD Billion, 2019-2035)
      • RUSSIA Phosphoric Acid Market by Source Type

        • Wet Process
        • Thermal Process
      • RUSSIA Phosphoric Acid Market by Application Type

        • Fertilizers
        • Feed & Food Additives
        • Detergents
        • Water Treatment Chemicals
        • Others
      • ITALY Outlook (USD Billion, 2019-2035)
      • ITALY Phosphoric Acid Market by Source Type

        • Wet Process
        • Thermal Process
      • ITALY Phosphoric Acid Market by Application Type

        • Fertilizers
        • Feed & Food Additives
        • Detergents
        • Water Treatment Chemicals
        • Others
      • SPAIN Outlook (USD Billion, 2019-2035)
      • SPAIN Phosphoric Acid Market by Source Type

        • Wet Process
        • Thermal Process
      • SPAIN Phosphoric Acid Market by Application Type

        • Fertilizers
        • Feed & Food Additives
        • Detergents
        • Water Treatment Chemicals
        • Others
      • REST OF EUROPE Outlook (USD Billion, 2019-2035)
      • REST OF EUROPE Phosphoric Acid Market by Source Type

        • Wet Process
        • Thermal Process
      • REST OF EUROPE Phosphoric Acid Market by Application Type

        • Fertilizers
        • Feed & Food Additives
        • Detergents
        • Water Treatment Chemicals
        • Others
    • APAC Outlook (USD Billion, 2019-2035)

      • APAC Phosphoric Acid Market by Source Type

        • Wet Process
        • Thermal Process
      • APAC Phosphoric Acid Market by Application Type

        • Fertilizers
        • Feed & Food Additives
        • Detergents
        • Water Treatment Chemicals
        • Others
      • APAC Phosphoric Acid Market by Regional Type

        • China
        • India
        • Japan
        • South Korea
        • Malaysia
        • Thailand
        • Indonesia
        • Rest of APAC
      • CHINA Outlook (USD Billion, 2019-2035)
      • CHINA Phosphoric Acid Market by Source Type

        • Wet Process
        • Thermal Process
      • CHINA Phosphoric Acid Market by Application Type

        • Fertilizers
        • Feed & Food Additives
        • Detergents
        • Water Treatment Chemicals
        • Others
      • INDIA Outlook (USD Billion, 2019-2035)
      • INDIA Phosphoric Acid Market by Source Type

        • Wet Process
        • Thermal Process
      • INDIA Phosphoric Acid Market by Application Type

        • Fertilizers
        • Feed & Food Additives
        • Detergents
        • Water Treatment Chemicals
        • Others
      • JAPAN Outlook (USD Billion, 2019-2035)
      • JAPAN Phosphoric Acid Market by Source Type

        • Wet Process
        • Thermal Process
      • JAPAN Phosphoric Acid Market by Application Type

        • Fertilizers
        • Feed & Food Additives
        • Detergents
        • Water Treatment Chemicals
        • Others
      • SOUTH KOREA Outlook (USD Billion, 2019-2035)
      • SOUTH KOREA Phosphoric Acid Market by Source Type

        • Wet Process
        • Thermal Process
      • SOUTH KOREA Phosphoric Acid Market by Application Type

        • Fertilizers
        • Feed & Food Additives
        • Detergents
        • Water Treatment Chemicals
        • Others
      • MALAYSIA Outlook (USD Billion, 2019-2035)
      • MALAYSIA Phosphoric Acid Market by Source Type

        • Wet Process
        • Thermal Process
      • MALAYSIA Phosphoric Acid Market by Application Type

        • Fertilizers
        • Feed & Food Additives
        • Detergents
        • Water Treatment Chemicals
        • Others
      • THAILAND Outlook (USD Billion, 2019-2035)
      • THAILAND Phosphoric Acid Market by Source Type

        • Wet Process
        • Thermal Process
      • THAILAND Phosphoric Acid Market by Application Type

        • Fertilizers
        • Feed & Food Additives
        • Detergents
        • Water Treatment Chemicals
        • Others
      • INDONESIA Outlook (USD Billion, 2019-2035)
      • INDONESIA Phosphoric Acid Market by Source Type

        • Wet Process
        • Thermal Process
      • INDONESIA Phosphoric Acid Market by Application Type

        • Fertilizers
        • Feed & Food Additives
        • Detergents
        • Water Treatment Chemicals
        • Others
      • REST OF APAC Outlook (USD Billion, 2019-2035)
      • REST OF APAC Phosphoric Acid Market by Source Type

        • Wet Process
        • Thermal Process
      • REST OF APAC Phosphoric Acid Market by Application Type

        • Fertilizers
        • Feed & Food Additives
        • Detergents
        • Water Treatment Chemicals
        • Others
    • South America Outlook (USD Billion, 2019-2035)

      • South America Phosphoric Acid Market by Source Type

        • Wet Process
        • Thermal Process
      • South America Phosphoric Acid Market by Application Type

        • Fertilizers
        • Feed & Food Additives
        • Detergents
        • Water Treatment Chemicals
        • Others
      • South America Phosphoric Acid Market by Regional Type

        • Brazil
        • Mexico
        • Argentina
        • Rest of South America
      • BRAZIL Outlook (USD Billion, 2019-2035)
      • BRAZIL Phosphoric Acid Market by Source Type

        • Wet Process
        • Thermal Process
      • BRAZIL Phosphoric Acid Market by Application Type

        • Fertilizers
        • Feed & Food Additives
        • Detergents
        • Water Treatment Chemicals
        • Others
      • MEXICO Outlook (USD Billion, 2019-2035)
      • MEXICO Phosphoric Acid Market by Source Type

        • Wet Process
        • Thermal Process
      • MEXICO Phosphoric Acid Market by Application Type

        • Fertilizers
        • Feed & Food Additives
        • Detergents
        • Water Treatment Chemicals
        • Others
      • ARGENTINA Outlook (USD Billion, 2019-2035)
      • ARGENTINA Phosphoric Acid Market by Source Type

        • Wet Process
        • Thermal Process
      • ARGENTINA Phosphoric Acid Market by Application Type

        • Fertilizers
        • Feed & Food Additives
        • Detergents
        • Water Treatment Chemicals
        • Others
      • REST OF SOUTH AMERICA Outlook (USD Billion, 2019-2035)
      • REST OF SOUTH AMERICA Phosphoric Acid Market by Source Type

        • Wet Process
        • Thermal Process
      • REST OF SOUTH AMERICA Phosphoric Acid Market by Application Type

        • Fertilizers
        • Feed & Food Additives
        • Detergents
        • Water Treatment Chemicals
        • Others
    • MEA Outlook (USD Billion, 2019-2035)

      • MEA Phosphoric Acid Market by Source Type

        • Wet Process
        • Thermal Process
      • MEA Phosphoric Acid Market by Application Type

        • Fertilizers
        • Feed & Food Additives
        • Detergents
        • Water Treatment Chemicals
        • Others
      • MEA Phosphoric Acid Market by Regional Type

        • GCC Countries
        • South Africa
        • Rest of MEA
      • GCC COUNTRIES Outlook (USD Billion, 2019-2035)
      • GCC COUNTRIES Phosphoric Acid Market by Source Type

        • Wet Process
        • Thermal Process
      • GCC COUNTRIES Phosphoric Acid Market by Application Type

        • Fertilizers
        • Feed & Food Additives
        • Detergents
        • Water Treatment Chemicals
        • Others
      • SOUTH AFRICA Outlook (USD Billion, 2019-2035)
      • SOUTH AFRICA Phosphoric Acid Market by Source Type

        • Wet Process
        • Thermal Process
      • SOUTH AFRICA Phosphoric Acid Market by Application Type

        • Fertilizers
        • Feed & Food Additives
        • Detergents
        • Water Treatment Chemicals
        • Others
      • REST OF MEA Outlook (USD Billion, 2019-2035)
      • REST OF MEA Phosphoric Acid Market by Source Type

        • Wet Process
        • Thermal Process
      • REST OF MEA Phosphoric Acid Market by Application Type

        • Fertilizers
        • Feed & Food Additives
        • Detergents
        • Water Treatment Chemicals
        • Others


    Infographic

    Free Sample Request

    Kindly complete the form below to receive a free sample of this Report

    Get Free Sample

    Customer Strories

    “I am very pleased with how market segments have been defined in a relevant way for my purposes (such as "Portable Freezers & refrigerators" and "last-mile"). In general the report is well structured. Thanks very much for your efforts.”

    Victoria Milne

    Founder
    Case Study
    Chemicals and Materials

    Compare Licence

    ×
    Features License Type
    Single User Multiuser License Enterprise User
    Price $4,950 $5,950 $7,250
    Maximum User Access Limit 1 User Upto 10 Users Unrestricted Access Throughout the Organization
    Free Customization
    Direct Access to Analyst
    Deliverable Format
    Platform Access
    Discount on Next Purchase 10% 15% 15%
    Printable Versions