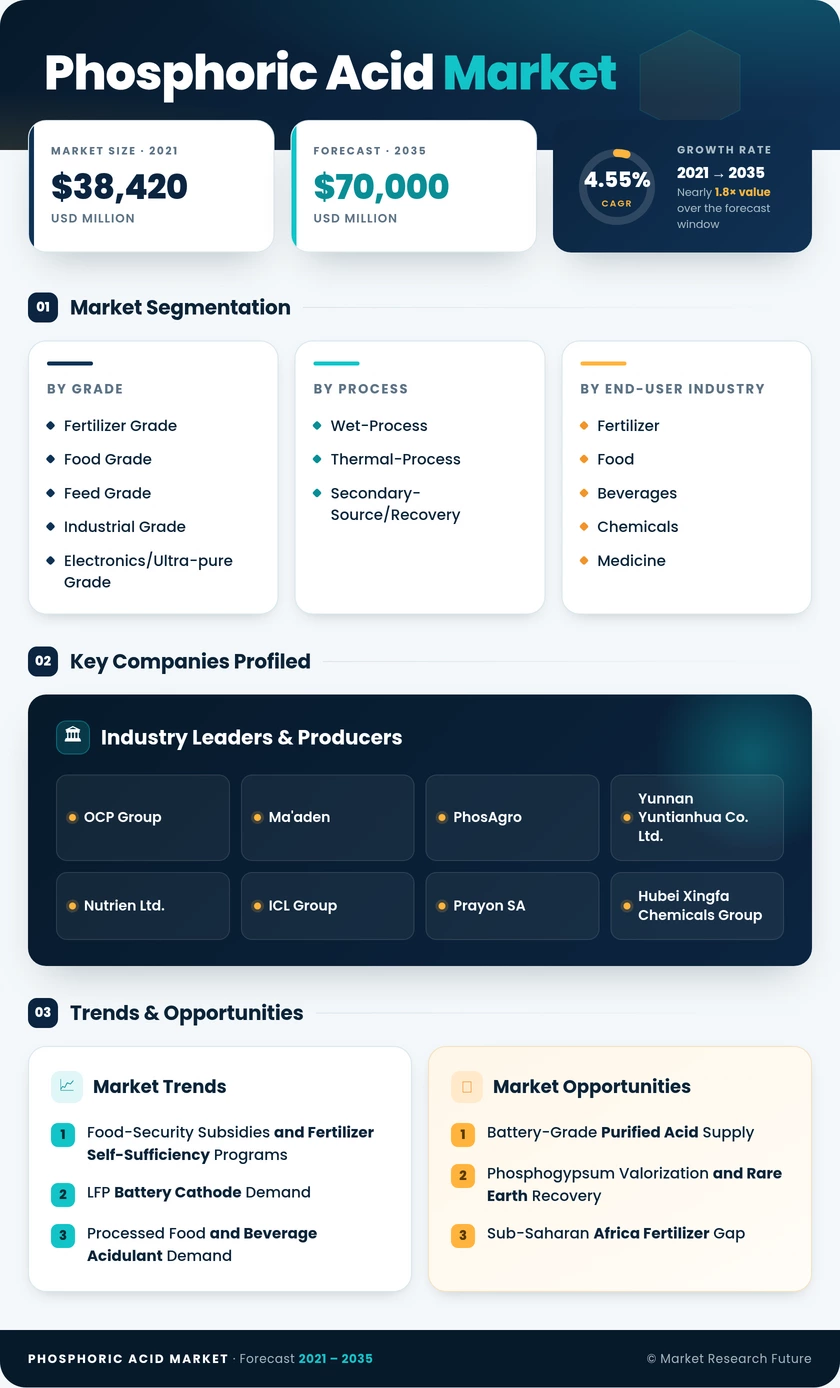
Phosphoric Acid Market (2026 - 2035)

ID: MRFR/CnM/10544-CR 111 Pages Chitranshi Jaiswal Last Updated: October 13, 2026
Phosphoric Acid Market Research Report Information By Grade (Fertilizer Grade, Food Grade, Feed Grade, Industrial Grade, and Electronics/Ultra-pure Grade), By Process (Wet-Process, Thermal-Process, and Secondary-Source/Recovery), and By End-User Industry (Fertilizer, Food and Beverages, Chemicals, Medicine, Metallurgy, and Other End-user Industries) – Forecast Till 2035.
Phosphoric Acid Market
Market Size
Forecast Period2026-2035
CAGR (2026-2035)4.55%
2025 Market SizeUSD 44,860 Million
2035 Market SizeUSD 70,000 Million
Key Players
OCP Group
Ma'aden
PhosAgro
Yunnan Yuntianhua Co. Ltd.
Nutrien Ltd.
ICL Group
Opportunities
  • Battery-Grade Purified Acid Supply
  • Phosphogypsum Valorization and Rare Earth Recovery
  • Sub-Saharan Africa Fertilizer Gap
  1. 1 Market Summary | |
  2. 2 Key Report Takeaways | |
    1. 2.1 By Grade | |
    2. 2.2 By Process | |
    3. 2.3 By End-User Industry | |
    4. 2.4 By Region | |
  3. 3 Phosphoric Acid Market Size and Forecast (2021–2035) | |
  4. 4 Driver Impact Analysis | |
    1. 4.1 Food-Security Subsidies and Fertilizer Self-Sufficiency Programs | |
    2. 4.2 LFP Battery Cathode Demand | |
    3. 4.3 Processed Food and Beverage Acidulant Demand | |
    4. 4.4 Semiconductor Fab Expansion | |
    5. 4.5 Integrated Capacity Build-Out in the Middle East and Africa | |
    6. 4.6 Critical Raw Material Designation of Phosphate | |
  5. 5 Restraints Impact Analysis | |
    1. 5.1 Phosphate Rock and Sulfur Price Volatility | |
    2. 5.2 Phosphogypsum Disposal and Stack Liabilities | |
    3. 5.3 Export Restrictions and Trade Remedies | |
    4. 5.4 Phosphate Limits in Detergents | |
    5. 5.5 Carbon Pricing and Energy Costs | |
  6. 6 Opportunities | |
    1. 6.1 Battery-Grade Purified Acid Supply | |
    2. 6.2 Phosphogypsum Valorization and Rare Earth Recovery | |
    3. 6.3 Sub-Saharan Africa Fertilizer Gap | |
    4. 6.4 Data-Driven Agronomy and Service Models | |
    5. 6.5 Sewage Sludge Phosphorus Recovery | |
  7. 7 Regional Market Share and Country-Level Analysis | |
    1. 7.1 Asia-Pacific | | |
      1. 7.1.1 China | | |
      2. 7.1.2 India | | |
      3. 7.1.3 Japan | | |
      4. 7.1.4 South Korea | | |
      5. 7.1.5 ASEAN | | |
      6. 7.1.6 Rest of Asia-Pacific | |
    2. 7.2 North America | | |
      1. 7.2.1 United States | | |
      2. 7.2.2 Canada | | |
      3. 7.2.3 Mexico | |
    3. 7.3 Europe | | |
      1. 7.3.1 Germany | | |
      2. 7.3.2 United Kingdom | | |
      3. 7.3.3 France | | |
      4. 7.3.4 Italy | | Phosphoric Acid Market — Table of Contents & Market Segmentation | | Executive Summary | |
  8. 1 Market Summary | |
  9. 2 Key Report Takeaways | |
    1. 2.1 By Grade | |
    2. 2.2 By Process | |
    3. 2.3 By End-User Industry | |
  10. 3 Market Size and Forecast (2021–2035) | |
  11. 4 Driver Impact Analysis | |
  12. 5 Restraints Impact Analysis | |
  13. 6 Opportunities | |
  14. 7 Regional Market Share and Country-Level Analysis | |
    1. 7.1 North America | |
    2. 7.2 Europe | |
    3. 7.3 Asia-Pacific | |
    4. 7.4 South America | |
    5. 7.5 Middle East & Africa | |
  15. 8 Future Outlook (2026–2035) | |
  16. 9 Segmentation Analysis | |
    1. 9.1 By Grade | | |
      1. 9.1.1 Fertilizer Grade | | |
      2. 9.1.2 Food Grade | | |
      3. 9.1.3 Feed Grade | | |
      4. 9.1.4 Industrial Grade | | |
      5. 9.1.5 Electronics/Ultra-pure Grade | |
    2. 9.2 By Process | | |
      1. 9.2.1 Wet-Process | | |
      2. 9.2.2 Thermal-Process | | |
      3. 9.2.3 Secondary-Source/Recovery | |
    3. 9.3 By End-User Industry | | |
      1. 9.3.1 Fertilizer | | |
      2. 9.3.2 Food and Beverages | | |
      3. 9.3.3 Chemicals | | |
      4. 9.3.4 Medicine | | |
      5. 9.3.5 Metallurgy | | |
      6. 9.3.6 Other End-user Industries | |
  17. 10 Competitive Landscape | |
  18. 11 Recent News & Developments | |
  19. 12 Report Scope and Methodology | |
  20. 13 Detailed Sources and Citations | |
  21. 14 Frequently Asked Questions | | LIST OF TABLES | |
  22. TABLE 1 Phosphoric Acid Market Summary Table | |
  23. TABLE 2 Phosphoric Acid Market Size and Forecast, 2021–2035 | |
  24. TABLE 3 Driver Impact Analysis | |
  25. TABLE 4 Restraints Impact Analysis | |
  26. TABLE 5 Regional Market Share Summary | |
  27. TABLE 6 North America Country-Level Analysis | |
  28. TABLE 7 Europe Country-Level Analysis | |
  29. TABLE 8 Asia-Pacific Country-Level Analysis | |
  30. TABLE 9 South America Country-Level Analysis | |
  31. TABLE 10 Middle East & Africa Country-Level Analysis | |
  32. TABLE 11 Phosphoric Acid Market Segmentation by Grade | |
  33. TABLE 12 Phosphoric Acid Market Segmentation by Process | |
  34. TABLE 13 Phosphoric Acid Market Segmentation by End-User Industry | |
  35. TABLE 14 Competitive Benchmarking Matrix | |
  36. TABLE 15 Report Scope and Methodology | |
  37. TABLE 16 Detailed Sources and Citations | | LIST OF FIGURES | |
  38. FIGURE 1 Phosphoric Acid Market Size Trend, 2021–2035 | |
  39. FIGURE 2 Phosphoric Acid Market Year-over-Year Growth Outlook | |
  40. FIGURE 3 Regional Revenue Share Analysis | |
  41. FIGURE 4 Driver and Restraint Impact Matrix | |
  42. FIGURE 5 Competitive Landscape Snapshot | |
  43. FIGURE 6 Segment Share by Grade | |
  44. FIGURE 7 Segment Share by Process | |
  45. FIGURE 8 Segment Share by End-User Industry

Segmentation Quick Reference

DimensionSub-SegmentsDominant SegmentFastest Growing Segment
By GradeFertilizer Grade, Food Grade, Feed Grade, Industrial Grade, Electronics/Ultra-pure GradeFertilizer GradeFood Grade
By ProcessWet-Process, Thermal-Process, Secondary-Source/RecoveryWet-ProcessThermal-Process
By End-User IndustryFertilizer, Food and Beverages, Chemicals, Medicine, Metallurgy, Other End-user IndustriesFertilizerFood and Beverages
By RegionAsia-Pacific, North America, Europe, South America, Middle East and AfricaAsia-PacificSouth America

Market Segmentation Overview

By Grade

Sub-SegmentKey Trend
Fertilizer GradeDAP, MAP and TSP production tied to crop economics
Food GradeAcidulant and phosphate salt demand in beverages, dairy and meat
Feed GradeDicalcium and monocalcium phosphate for poultry and swine rations
Industrial GradeMetal treatment, water treatment and technical salts
Electronics/Ultra-pure GradeSemiconductor wafer etching and LFP precursor synthesis

Fertilizer Grade dominates the Phosphoric Acid Market by grade with a 74.6% share, since nearly all merchant acid is converted into DAP, MAP and TSP. Electronics/Ultra-pure Grade is the fastest-growing grade at a 7.4% CAGR, driven by wafer etching and LFP precursors. Food Grade gains on beverage acidulant demand, Feed Grade supplies calcium phosphate supplements for livestock, and Industrial Grade serves metal and water treatment.

By Process

Sub-SegmentKey Trend
Wet-ProcessLow-cost sulfuric acid digestion of phosphate rock
Thermal-ProcessHigh-purity output for food, pharmaceutical and electronic uses
Secondary-Source/RecoverySewage sludge ash, battery recycling and byproduct streams

Wet-Process production leads the Phosphoric Acid Market by process with an 85.4% share, reflecting low-cost sulfuric acid digestion of rock at integrated mine-site complexes. Thermal-Process acid remains essential where buyers require the lowest metal content, though high power use limits new investment. Secondary-Source/Recovery is the fastest-growing route at a 5.6% CAGR, supported by sludge-ash mandates in Germany and battery recycling in China.

By End-User Industry

Sub-SegmentKey Trend
FertilizerSubsidy programs and grain prices
Food and BeveragesSoft drinks and processed foods
ChemicalsPhosphate salts, flame retardants and catalysts
MedicineDental etchants, pharmaceutical buffers and excipients
MetallurgyMetal pretreatment, phosphating and polishing
Other End-user IndustriesWater treatment, construction and textiles

Fertilizer remains the anchor end use of the Phosphoric Acid Market with a 72.8% share, tied to subsidy programs and grain prices. Medicine is the fastest-growing end use at a 5.4% CAGR, supported by pharmaceutical buffers and dental etchants. Food and Beverages gains are driven by acidulant demand; Chemicals rely on phosphate salts and other chemical intermediates; Metallurgy uses the acid for phosphating, and Other End-user Industries include water treatment.


Download PDF ×

We do not share your information with anyone. However, we may send you emails based on your report interest from time to time. You may contact us at any time to opt-out.