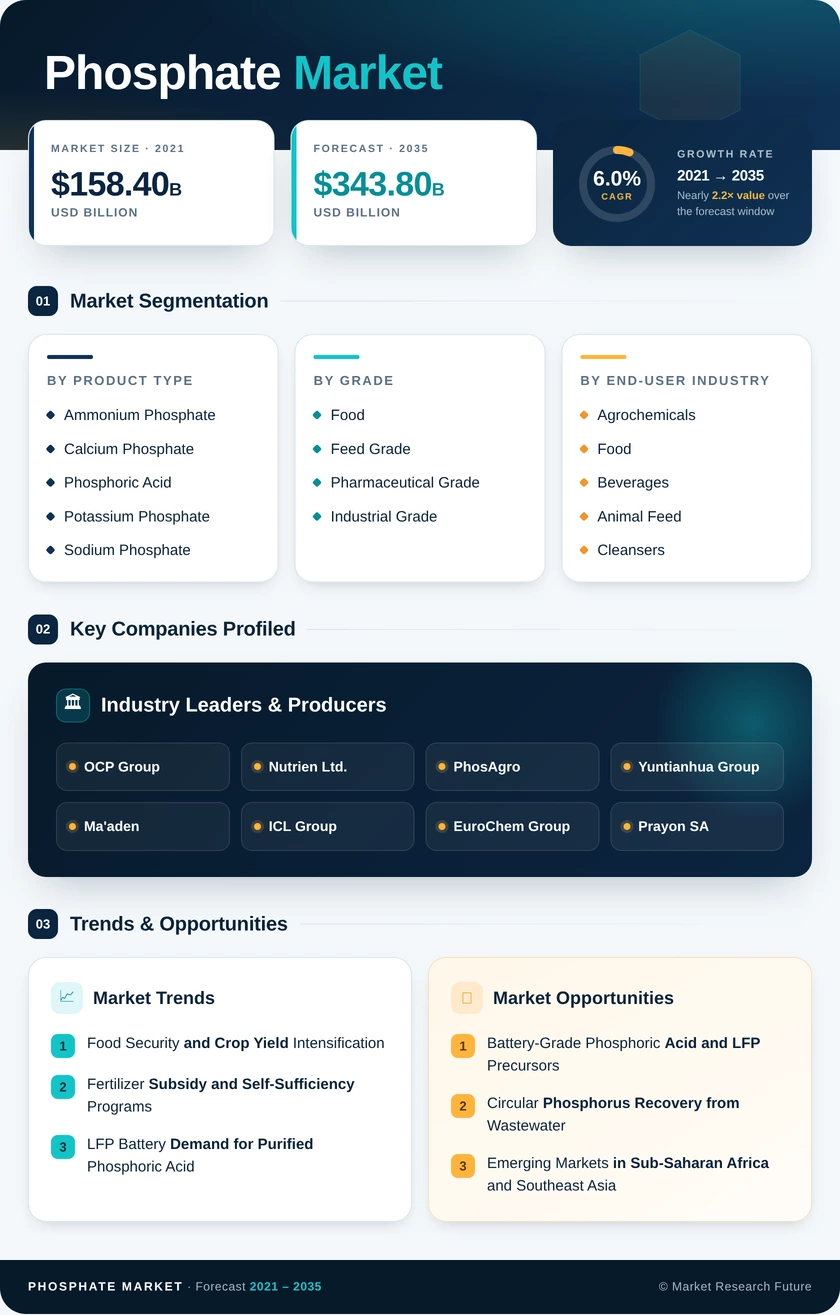
Phosphate Market (2026 - 2035)

ID: MRFR/CnM/1389-CR 128 Pages Priya Nagrale Last Updated: November 11, 2026
Phosphate Market Research Report Information By Product Type (Ammonium Phosphate, Calcium Phosphate, Phosphoric Acid, Potassium Phosphate, Sodium Phosphate, and Other Phosphates), By Grade (Food and Feed Grade, Pharmaceutical Grade, and Industrial Grade), By End-User Industry (Agrochemicals, Food and Beverages, Animal Feed, Cleansers and Detergents, Pharmaceutical and Personal Care, and Water Treatment), And By Region (North America, Europe, Asia-Pacific, and Rest of the World) – Market Forecast Till 2035.
Phosphate Market
Market Size
Forecast Period2026-2035
CAGR (2026-2035)6.0%
2025 Market SizeUSD 192.0 Billion
2035 Market SizeUSD 343.8 Billion
Key Players
OCP Group
Nutrien Ltd.
PhosAgro
Yuntianhua Group
Ma'aden
ICL Group
Opportunities
  • Battery-Grade Phosphoric Acid and LFP Precursors
  • Circular Phosphorus Recovery from Wastewater
  • Emerging Markets in Sub-Saharan Africa and Southeast Asia
  1. 1 Market Summary | |
  2. 2 Key Report Takeaways | |
    1. 2.1 By Product Type | |
    2. 2.2 By Grade | |
    3. 2.3 By End-user Industry | |
    4. 2.4 By Region | |
  3. 3 Market Size and Forecast (2021–2035) | |
  4. 4 Driver Impact Analysis | |
    1. 4.1 Food Security and Crop Yield Intensification | |
    2. 4.2 Fertilizer Subsidy and Self-Sufficiency Programs | |
    3. 4.3 LFP Battery Demand for Purified Phosphoric Acid | |
    4. 4.4 Processed Food and Protein Consumption | |
    5. 4.5 Water Treatment and Phosphorus Recovery Mandates | |
    6. 4.6 Animal Feed and Aquaculture Expansion | |
    7. 4.7 Capacity Investment in North Africa and the Gulf | |
  5. 5 Restraints Impact Analysis | |
    1. 5.1 Concentration of Rock Reserves | |
    2. 5.2 Raw Material and Energy Price Volatility | |
    3. 5.3 Cadmium Limits and Phosphogypsum Management | |
    4. 5.4 Detergent Phosphate Restrictions | |
    5. 5.5 Export Restrictions and Trade Duties | |
  6. 6 Opportunities | |
    1. 6.1 Battery-Grade Phosphoric Acid and LFP Precursors | |
    2. 6.2 Circular Phosphorus Recovery from Wastewater | |
    3. 6.3 Emerging Markets in Sub-Saharan Africa and Southeast Asia | |
    4. 6.4 Data-Driven Nutrient Management and Service Models | |
    5. 6.5 High-Purity Pharmaceutical and Food Grades | |
  7. 7 Regional Market Share and Country-Level Analysis | |
    1. 7.1 North America | | |
      1. 7.1.1 US | | |
      2. 7.1.2 Canada | | |
      3. 7.1.3 Mexico | |
    2. 7.2 Europe | | |
      1. 7.2.1 Germany | | |
      2. 7.2.2 UK | | |
      3. 7.2.3 France | | |
      4. 7.2.4 Italy | | |
      5. 7.2.5 Spain | | |
      6. 7.2.6 Nordic Countries | | |
      7. 7.2.7 Russia | | |
      8. 7.2.8 Rest of Europe | |
    3. 7.3 Asia-Pacific | | |
      1. 7.3.1 China | | |
      2. 7.3.2 India | | |
      3. 7.3.3 Japan | | |
      4. 7.3.4 South Korea | | |
      5. 7.3.5 ASEAN | | |
      6. 7.3.6 Rest of Asia-Pacific | |
    4. 7.4 South America | | |
      1. 7.4.1 Brazil | | |
      2. 7.4.2 Argentina | | |
      3. 7.4.3 Rest of South America | |
    5. 7.5 Middle East & Africa | | |
      1. 7.5.1 Saudi Arabia | | |
      2. 7.5.2 UAE | | |
      3. 7.5.3 South Africa | | |
      4. 7.5.4 Egypt | | |
      5. 7.5.5 Rest of MEA | |
  8. 8 Future Outlook (2026–2035) | |
    1. 8.1 Energy Storage Convergence | |
    2. 8.2 Circular Phosphorus and Supply Security | |
    3. 8.3 Carbon Pricing and Low-Carbon Fertilizers | |
    4. 8.4 Precision Agronomy and Nutrient-Use Efficiency | |
  9. 9 Segmentation Analysis | |
    1. 9.1 By Product Type | | |
      1. 9.1.1 Ammonium Phosphate | | |
      2. 9.1.2 Calcium Phosphate | | |
      3. 9.1.3 Phosphoric Acid | | |
      4. 9.1.4 Potassium Phosphate | | |
      5. 9.1.5 Sodium Phosphate | | |
      6. 9.1.6 Other Phosphates | |
    2. 9.2 By Grade | | |
      1. 9.2.1 Food and Feed Grade | | |
      2. 9.2.2 Pharmaceutical Grade | | |
      3. 9.2.3 Industrial Grade | |
    3. 9.3 By End-user Industry | | |
      1. 9.3.1 Agrochemicals | | |
      2. 9.3.2 Food and Beverages | | |
      3. 9.3.3 Animal Feed | | |
      4. 9.3.4 Cleansers and Detergents | | |
      5. 9.3.5 Pharmaceutical and Personal Care | | |
      6. 9.3.6 Water Treatment | |
  10. 10 Competitive Landscape | |
    1. 10.1 Market Concentration Analysis | |
    2. 10.2 Competitive Benchmarking Table | |
  11. 11 Recent News & Developments | |
  12. 12 Report Scope and Methodology | |
  13. 13 Detailed Sources and Citations | |
  14. 14 Frequently Asked Questions (FAQs) | | LIST OF TABLES | |
  15. TABLE 1 Global Phosphate Market Summary Snapshot, 2025–2035 | |
  16. TABLE 2 Global Phosphate Market Size & Forecast, by Revenue (USD Billion), 2021–2035 | |
  17. TABLE 3 Global Phosphate Market – Driver Impact Analysis | |
  18. TABLE 4 Global Phosphate Market – Restraints Impact Analysis | |
  19. TABLE 5 Global Phosphate Market Size, by Region, 2025 (USD Billion) | |
  20. TABLE 6 North America Phosphate Market, by Country, 2025 | |
  21. TABLE 7 Europe Phosphate Market, by Country, 2025 | |
  22. TABLE 8 Asia-Pacific Phosphate Market, by Country, 2025 | |
  23. TABLE 9 South America Phosphate Market, by Country, 2025 | |
  24. TABLE 10 Middle East & Africa Phosphate Market, by Country, 2025 | |
  25. TABLE 11 Global Phosphate Market, by Product Type, 2025 | |
  26. TABLE 12 Global Phosphate Market, by Grade, 2025 | |
  27. TABLE 13 Global Phosphate Market, by End-user Industry, 2025 | |
  28. TABLE 14 Competitive Benchmarking Table – Global Phosphate Market | |
  29. TABLE 15 Report Scope and Methodology | |
  30. TABLE 16 Detailed Sources and Citations | | LIST OF FIGURES | |
  31. FIGURE 1 Global Phosphate Market Dynamics – Drivers, Restraints and Opportunities | |
  32. FIGURE 2 Phosphate Industry Value Chain Analysis | |
  33. FIGURE 3 Porter's Five Forces Analysis – Global Phosphate Market | |
  34. FIGURE 4 Global Phosphate Market Size Trend, 2021–2035 (USD Billion) | |
  35. FIGURE 5 Global Phosphate Market Share, by Product Type, 2025 | |
  36. FIGURE 6 Global Phosphate Market Share, by Grade, 2025 | |
  37. FIGURE 7 Global Phosphate Market Share, by End-user Industry, 2025 | |
  38. FIGURE 8 Global Phosphate Market Share, by Region, 2025 | |
  39. FIGURE 9 Country-Level Share within Each Region, 2025 | |
  40. FIGURE 10 Competitive Landscape – Estimated Revenue Share Ranges of Key Players

Segmentation Quick Reference

DimensionSub-SegmentsDominant SegmentFastest Growing Segment
By Product TypeAmmonium Phosphate, Calcium Phosphate, Phosphoric Acid, Potassium Phosphate, Sodium Phosphate, Other PhosphatesAmmonium Phosphate (49.0%)Potassium Phosphate (6.9% CAGR)
By GradeFood and Feed Grade, Pharmaceutical Grade, Industrial GradeIndustrial Grade (56.2%)Food and Feed Grade (6.6% CAGR)
By End-user IndustryAgrochemicals, Food and Beverages, Animal Feed, Cleansers and Detergents, Pharmaceutical and Personal Care, Water TreatmentAgrochemicals (62.0%)Water Treatment (6.9% CAGR)
By RegionNorth America, Europe, Asia-Pacific, South America, Middle East & AfricaAsia-Pacific (47.5%)Asia-Pacific (47.5%)

Market Segmentation Overview

By Product Type

Sub-SegmentKey Trend
Ammonium PhosphateSustained DAP and MAP demand in grain belts
Calcium PhosphateFeed and excipient quality upgrades
Phosphoric AcidSplit into fertilizer and battery-grade streams
Potassium PhosphateFertigation and food-buffering growth
Sodium PhosphateStable food and boiler-water applications
Other PhosphatesElectronic-grade and polyphosphate niches

Ammonium Phosphate leads because DAP and MAP remain the default phosphorus carriers for rice, wheat, corn and soybean systems. Potassium Phosphate grows fastest as drip-irrigated horticulture and non-dairy food formulations need precise phosphorus-to-potassium ratios. Phosphoric Acid adds a second growth engine through purification for LFP cathodes, where impurity control matters more than tonnage.

By Grade

Sub-SegmentKey Trend
Food and Feed GradeProcessed food and aquaculture feed expansion
Pharmaceutical GradeTighter USP impurity limits and premium pricing
Industrial GradeVolume anchor for fertilizer and metal treatment

Industrial Grade leads because fertilizer production and metal treatment absorb the bulk of wet-process acid output. Food and Feed Grade grows fastest as Asia-Pacific food manufacturers and aquaculture feed mills scale up. Pharmaceutical Grade stays small but profitable, with tighter arsenic and lead limits favoring producers with certified ore and validated testing.

By End-user Industry

Sub-SegmentKey Trend
AgrochemicalsYield intensification and subsidy-backed demand
Food and BeveragesPlant-based dairy and processed meat use
Animal FeedAquaculture-led feed phosphate growth
Cleansers and DetergentsHousehold substitution offset by industrial cleaning
Pharmaceutical and Personal CareHigher certification and purity requirements
Water TreatmentDischarge regulation and phosphorus recovery mandates

Agrochemicals lead because no agronomic substitute exists for correcting soil phosphorus deficiency in staple crop systems. Water Treatment grows fastest as the recast EU wastewater directive and Germany's recovery mandate drive dosing and recovery investment. Cleansers and Detergents continue to lose household volume to phosphate-free formulations, while Animal Feed gains from aquaculture growth in Southeast Asia.


Download PDF ×

We do not share your information with anyone. However, we may send you emails based on your report interest from time to time. You may contact us at any time to opt-out.