• Cat-intel
  • MedIntelliX
  • Resources
  • About Us
  • English
    Chinese
    French
    Japanese
    Korean
    German
    Spanish

    Pheochromocytoma Market Share

    ID: MRFR/HC/7084-HCR
    90 Pages
    Kinjoll Dey
    September 2025

    Global Pheochromocytoma Market Research Report Information By Treatment Type (Alpha-Blockers, Beta Blockers, Surgery, Radionuclide Treatment, Others) and By End-User (Hospitals and Clinics, Research and Academic Institutes, Others) – Forecast to 2035

    Share:
    Download PDF ×

    We do not share your information with anyone. However, we may send you emails based on your report interest from time to time. You may contact us at any time to opt-out.

    Pheochromocytoma Market Infographic
    $ 4,950.0
    $ 5,950.0
    $ 7,250.0

    Market Share

    Pheochromocytoma Market Share Analysis

    The PHEOCHROMOCYTOMA market, characterized by its rare nature and critical medical implications, demands nuanced strategies for effective market share positioning. Companies operating in this space employ a combination of targeted approaches to address the unique challenges associated with the diagnosis and treatment of pheochromocytoma. Due to the great number of nuances involved in pheochromocytoma diagnostic, companies devote efforts to produce innovative diagnostic tools and tests. An accurate and early detection provided by advanced imaging technologies, genetic testing, and biomarker identification makes the company’s position on the market even stronger. In order to progress knowledge and treatment modalities for pheochromocytoma, strategic partnerships with research institutes and academic institutions are essential. This results to clinical trials, advanced in research, novel technology innovations which in turn makes the company a market leader. As the number of such cases as pheochromocytoma is quite low, they invest in educational initiatives primarily for healthcare personnel. Without provisioning the required training to outline the latest diagnostics, treatment, and emerging developments of pheochromocytoma, the widespread of the market adoption is hindered. A reaching out on pheochromocytoma at a global level is very significant for market positioning. Awareness campaigns frequenting organizations diverge through diverse channels and educate both health professionals and the layman on the signs, diagnosis, and treatment measures available. As the awareness increases, the detection can be done way ahead of the time to allow the effective treatment which will positively affect market share. Companies emphasize introducing new high technologies into the phlo chromocytoma treatment options. These are in form of robotic assisted addition, target therapies, and minimally invasive procedures that aces good results among patients and bring healthcare specialists who are looking for advanced solutions. The specificity of pheochromocytoma therapeutic approaches may require individualized pricing tactics. Companies thus evaluate the value proposition of their therapies in a cautious manner choosing to price their products so that they reflect the rarity of the condition and are both reasonable and valuable to the patient. Healthcare industry is highly regulated; therefore, companies devote a lot of their time to engaging the regulatory bodies. Participation in regulatory framework, not only in terms of compliance but as a contributor to the stipulations, improves the company’s integrity and builds trust in healthcare organizations. This, in turn, increases market share. Medical studies are almost impossible to keep a constant pace but the investment by the firms is required to be made continuously, due to the nature of medical research. Continued research toward novel treatment avenues, determining biological markers and perfecting current technologies exhibit a pursuit of innovation that ensures the company’s competitiveness with emerging trends in managing pheochromocytoma. Collaborating with patient advocacy groups and organizations dedicated to rare diseases strengthens a company's market positioning. Partnering with these entities not only supports patient education and awareness initiatives but also fosters a positive perception among the patient community, potentially influencing treatment decisions and market share.

    Market Summary

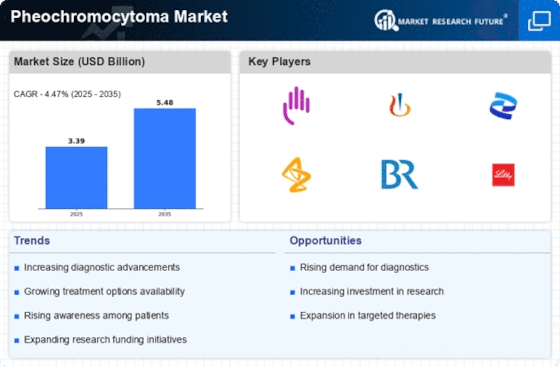
    The global pheochromocytoma market is projected to grow from 3.39 USD billion in 2024 to 5.48 USD billion by 2035, indicating a steady growth trajectory.

    Key Market Trends & Highlights

    Pheochromocytoma Key Trends and Highlights

    • The market is expected to experience a compound annual growth rate (CAGR) of 4.47 percent from 2025 to 2035.
    • By 2035, the market valuation is anticipated to reach 5.48 USD billion, reflecting increasing demand for effective treatment options.
    • In 2024, the market is valued at 3.39 USD billion, showcasing a robust foundation for future growth.
    • Growing adoption of advanced diagnostic techniques due to rising awareness of pheochromocytoma is a major market driver.

    Market Size & Forecast

    2024 Market Size 3.39 (USD Billion)
    2035 Market Size 5.48 (USD Billion)
    CAGR (2025-2035) 4.47%
    Largest Regional Market Share in 2024 latin_america)

    Major Players

    Pfizer Inc. (US), Teva Pharmaceutical Company Limited (Israel), Zydus Cadila (India), Novartis AG (Switzerland), Curium Pharma (UK), Jubilant Cadista (US), AstraZeneca (UK), Mylan N.V. (US), Apotex Inc. (Canada), Reddy’s Laboratories Ltd (India), Lupin (India), Glenmark Pharmaceuticals Limited (India)

    Market Trends

    The increasing recognition of pheochromocytoma as a critical health concern is likely to drive advancements in diagnostic and therapeutic approaches, thereby enhancing patient outcomes and shaping the future landscape of the healthcare market.

    National Institutes of Health (NIH)

    Pheochromocytoma Market Market Drivers

    Emerging Treatment Options

    The development of new treatment options is a key driver in the Global Pheochromocytoma Market Industry. Innovative therapies, including targeted therapies and minimally invasive surgical techniques, are being explored to improve patient outcomes. These advancements not only enhance the effectiveness of treatment but also reduce recovery times, thereby appealing to both patients and healthcare providers. As these new options become available, they are expected to attract more patients seeking effective management of pheochromocytoma, further propelling market growth.

    Market Trends and Projections

    Government Support and Funding

    Government support and funding for research into rare diseases, including pheochromocytoma, play a vital role in the Global Pheochromocytoma Market Industry. Initiatives aimed at increasing research funding and promoting awareness of rare tumors contribute to advancements in treatment and diagnostic methods. This support is essential for fostering innovation and ensuring that healthcare providers have access to the latest therapies. As funding increases, the market is likely to benefit from enhanced research outcomes, which could lead to improved patient care and a more robust market landscape.

    Advancements in Diagnostic Technologies

    Technological advancements in diagnostic methods are significantly influencing the Global Pheochromocytoma Market Industry. Innovations such as advanced imaging techniques, including MRI and CT scans, enhance the accuracy of pheochromocytoma detection. These developments facilitate early diagnosis, which is crucial for effective treatment and management. As diagnostic capabilities improve, the market is expected to expand, potentially reaching a valuation of 5.48 USD Billion by 2035. This growth reflects the increasing reliance on sophisticated technologies to identify and manage rare conditions like pheochromocytoma.

    Increasing Incidence of Pheochromocytoma

    The Global Pheochromocytoma Market Industry is experiencing growth due to the rising incidence of pheochromocytoma, a rare tumor of the adrenal glands. Current estimates suggest that the prevalence of this condition is increasing, which may be attributed to better diagnostic techniques and heightened awareness among healthcare professionals. As a result, more patients are being diagnosed, leading to a projected market value of 3.39 USD Billion in 2024. This trend indicates a growing need for effective treatment options and management strategies, thereby driving the overall market growth.

    Rising Awareness and Education Initiatives

    The Global Pheochromocytoma Market Industry benefits from rising awareness and educational initiatives aimed at both healthcare providers and the general public. Campaigns focused on the symptoms and risks associated with pheochromocytoma are crucial in promoting early detection and treatment. Increased knowledge among healthcare professionals leads to improved patient outcomes and a higher rate of diagnosis. This growing awareness is likely to contribute to a compound annual growth rate of 4.47% from 2025 to 2035, reflecting the market's potential for sustained growth.

    Market Segment Insights

    Pheochromocytoma Treatment Type Insights

    Pheochromocytoma End-User Insights

    Get more detailed insights about Pheochromocytoma Market Research Report - Global Forecast till 2032

    Regional Insights

    Key Companies in the Pheochromocytoma Market market include

    Industry Developments

    Future Outlook

    Pheochromocytoma Market Future Outlook

    The Global Pheochromocytoma Market is projected to grow at a 4.47% CAGR from 2024 to 2035, driven by advancements in diagnostic technologies, increasing awareness, and enhanced treatment options.

    New opportunities lie in:

    • Develop targeted therapies to improve patient outcomes and reduce side effects.
    • Invest in AI-driven diagnostic tools for early detection and personalized treatment.
    • Expand global outreach programs to raise awareness and improve patient access to care.

    By 2035, the Pheochromocytoma Market is expected to achieve substantial growth, reflecting enhanced treatment paradigms and increased patient engagement.

    Market Segmentation

    Report Scope

    Report Attribute/Metric Details
    Market Size 2023 3.25 (USD Billion)
    Market Size 2024 3.39 (USD Billion)
    Market Size 2032 4.74 (USD Billion)
    Compound Annual Growth Rate (CAGR) 4.98 % (2024 - 2032)
    Report Coverage Revenue Forecast, Competitive Landscape, Growth Factors, and Trends
    Base Year 2023
    Market Forecast Period 2024 - 2032
    Historical Data 2019 - 2023
      Geographies Covered North America, Europe, Asia-Pacific, and Rest of the World (RoW)
      Key Vendors Pfizer Inc. (US), Teva Pharmaceutical Company Limited (Israel), Zydus Cadila (India), Novartis AG (Switzerland), Curium Pharma (UK), Jubilant Cadista (US), AstraZeneca (UK), Mylan N.V. (US), Apotex Inc. (Canada), Dr. Reddy’s Laboratories Ltd (India), Lupin (India), and Glenmark Pharmaceuticals Limited (India).
      Key Market Opportunities Enhancing personalized medicine approaches, incorporating pharmacogenomics to tailor treatments to individual genetic profiles.
      Key Market Drivers The rising incidence of pheochromocytoma, a rare tumor of adrenal gland tissue, is driving the demand for effective diagnostic and treatment options.
     

    Market Highlights

    Author

    Kinjoll Dey
    Research Analyst Level I

    She holds an experience of about 6+ years in market research and business consulting, working under the spectrum of information communication technology, telecommunications and semiconductor domains. aarti conceptualizes and implements a scalable business strategy and provides strategic leadership to the clients. her expertise lies in market estimation, competitive intelligence, pipeline analysis, customer assessment, etc.

    Leave a Comment

    Latest Comments

    John Doe

    This is a great article! Really helped me understand the topic better.

    Posted on July 23, 2025, 10:15 AM
    Jane Smith

    Thanks for sharing this. I’ve bookmarked it for later reference.

    Posted on July 22, 2025, 7:45 PM

    FAQs

    What was the valuation of the Pheochromocytoma Market in 2030?

    The valuation of the Pheochromocytoma Market would be USD 4.74 Billion.

    What is the expected CAGR for the Pheochromocytoma Market during the forecast period of 2022-2030?

    The CAGR would be 4.98% during the forecast period of 2024-2032.

    Which treatment type leads the Pheochromocytoma Market?

    The surgery segment leads the market.

    By end user, which segment has the upper hand in the Pheochromocytoma Market?

    The hospitals and clinics segment has the charge of the market.

    By region, name the most prolific market in the global Pheochromocytoma Market?

    The Americas are leading the regional Pheochromocytoma Market.

    1. |-
    2. Table of Contents
    3. REPORT PROLOGUE
    4. Market Introduction
      1. Definition
      2. Scope of the Study
        1. Research Objective
        2. Assumptions
        3. Limitations
    5. Research Methodology
      1. Overview
      2. Primary Research
      3. Secondary Research
      4. Market Size Estimation
    6. MARKET DYNAMICS
      1. Overview
      2. Drivers
      3. Restraints
      4. Opportunities
    7. MARKET FACTOR ANALYSIS
      1. Porter’s Five Forces Analysis
        1. Bargaining Power of Suppliers
        2. Bargaining Power of Buyers
        3. Threat of New Entrants
        4. Threat of Substitutes
        5. Intensity of Rivalry
      2. Value Chain Analysis
      3. Pipeline Analysis
    8. GLOBAL PHEOCHROMOCYTOMA MARKET, BY TREATMENT TYPE
      1. Overview
      2. Alpha-Blockers
    9. Market Estimates & Forecast, by Region, 2020-2027
    10. Market Estimates & Forecast, by Country, 2020-2027
      1. Beta-Blockers
      2. Surgery
      3. Radionuclide Treatment
      4. Others
    11. GLOBAL PHEOCHROMOCYTOMA MARKET, BY END USER
      1. Overview
      2. Hospitals and Clinics
      3. Research and Academic Institutes
      4. Others
    12. GLOBAL PHEOCHROMOCYTOMA MARKET, BY REGION
      1. Overview
      2. Americas
        1. North America
        2. Latin America
      3. Europe
        1. Western Europe
        2. Eastern Europe
      4. Asia-Pacific
        1. Japan
        2. China
        3. India
        4. Australia
        5. South Korea
        6. Rest of Asia-Pacific
      5. Middle East & Africa
        1. Middle East
        2. Africa
    13. COMPANY LANDSCAPE
      1. Overview
      2. Competitive Analysis
      3. Market Share Analysis
      4. Major Growth Strategy in the Global Pheochromocytoma Market
      5. Competitive Benchmarking
      6. Leading Players in terms of Number of Developments in the Global Pheochromocytoma Market
      7. Key developments and Growth Strategies
        1. New Product Launch/Service Deployment
        2. Merger & acquisitions
        3. Joint Ventures
      8. Major Players Financial Matrix & Market Ratio
        1. Sales & Operating Income 2020
        2. Major Players R&D Expenditure 2020
      9. Major Players Capital Market Ratio
    14. COMPANY PROFILES
      1. Pfizer, Inc.
        1. Company Overview
        2. Product Overview
        3. Financial Overview
        4. Key Developments
        5. SWOT Analysis
        6. Key Strategies
      2. Teva Pharmaceuticals Company Limited
        1. Company Overview
        2. Product Overview
        3. Financial Overview
        4. Key Developments
        5. SWOT Analysis
        6. Key Strategies
      3. Zydus Cadila
        1. Company Overview
        2. Product Overview
        3. Financial Overview
        4. Key Developments
        5. SWOT Analysis
        6. Key Strategies
      4. Novartis AG
        1. Company Overview
        2. Product Overview
        3. Financial Overview
        4. Key Developments
        5. SWOT Analysis
        6. Key Strategies
      5. Curium Pharma
        1. Company Overview
        2. Product Overview
        3. Financial Overview
        4. Key Developments
        5. SWOT Analysis
        6. Key Strategies
      6. Jubilant Cadista
        1. Company Overview
        2. Product Overview
        3. Financial Overview
        4. Key Developments
        5. SWOT Analysis
        6. Key Strategies
      7. AstraZeneca
        1. Company Overview
        2. Product Overview
        3. Financial Overview
        4. Key Developments
        5. SWOT Analysis
        6. Key Strategies
      8. Mylan N.V.
        1. Company Overview
        2. Product Overview
        3. Financial Overview
        4. Key Developments
        5. SWOT Analysis
        6. Key Strategies
      9. Apotex Inc.
        1. Company Overview
        2. Product Overview
        3. Financial Overview
        4. Key Developments
        5. SWOT Analysis
        6. Key Strategies
      10. Dr. Reddy’s Laboratories Ltd
        1. Company Overview
        2. Product Overview
        3. Financial Overview
        4. Key Developments
        5. SWOT Analysis
        6. Key Strategies
      11. Lupin
        1. Company Overview
        2. Product Overview
        3. Financial Overview
        4. Key Developments
        5. SWOT Analysis
        6. Key Strategies
      12. Glenmark Pharmaceuticals Limited
        1. Company Overview
        2. Product Overview
        3. Financial Overview
        4. Key Developments
        5. SWOT Analysis
        6. Key Strategies
      13. Others
    15. APPENDIX
      1. References
      2. Related Reports
    16. LIST OF TABLES
    17. TABLE 1 GLOBAL PHEOCHROMOCYTOMA MARKET SYNOPSIS, 2020-2027
    18. TABLE 2 GLOBAL PHEOCHROMOCYTOMA MARKET ESTIMATES & FORECAST, 2020-2027(USD MILLION)
    19. TABLE 3 GLOBAL PHEOCHROMOCYTOMA MARKET, BY TREATMENT TYPE, 2020-2027(USD MILLION)
    20. TABLE 4 GLOBAL PHEOCHROMOCYTOMA MARKET, BY END USER, 2020-2027(USD MILLION)
    21. TABLE 5 GLOBAL PHEOCHROMOCYTOMA MARKET, BY REGION, 2020-2027(USD MILLION)
    22. TABLE 6 NORTH AMERICA: PHEOCHROMOCYTOMA MARKET, BY TREATMENT TYPE, 2020-2027(USD MILLION)
    23. TABLE 7 NORTH AMERICA: PHEOCHROMOCYTOMA MARKET, BY END USER, 2020-2027(USD MILLION)
    24. TABLE 8 US: PHEOCHROMOCYTOMA MARKET, BY TREATMENT TYPE, 2020-2027(USD MILLION)
    25. TABLE 9 US: PHEOCHROMOCYTOMA MARKET, BY END USER, 2020-2027(USD MILLION)
    26. TABLE 10 CANADA: PHEOCHROMOCYTOMA MARKET, BY TREATMENT TYPE, 2020-2027(USD MILLION)
    27. TABLE 11 CANADA: PHEOCHROMOCYTOMA MARKET, BY END USER, 2020-2027(USD MILLION)
    28. TABLE 12 LATIN AMERICA: PHEOCHROMOCYTOMA MARKET, BY TREATMENT TYPE, 2020-2027(USD MILLION)
    29. TABLE 13 LATIN AMERICA: PHEOCHROMOCYTOMA MARKET, BY END USER, 2020-2027(USD MILLION)
    30. TABLE 14 EUROPE: PHEOCHROMOCYTOMA MARKET, BY TREATMENT TYPE, 2020-2027(USD MILLION)
    31. TABLE 15 EUROPE: PHEOCHROMOCYTOMA MARKET, BY END USER, 2020-2027(USD MILLION)
    32. TABLE 16 WESTERN EUROPE: PHEOCHROMOCYTOMA MARKET, BY TREATMENT TYPE, 2020-2027(USD MILLION)
    33. TABLE 17 WESTERN EUROPE: PHEOCHROMOCYTOMA MARKET, BY END USER, 2020-2027(USD MILLION)
    34. TABLE 18 EASTERN EUROPE: PHEOCHROMOCYTOMA MARKET, BY TREATMENT TYPE, 2020-2027(USD MILLION)
    35. TABLE 19 EASTERN EUROPE: PHEOCHROMOCYTOMA MARKET, BY END USER, 2020-2027(USD MILLION)
    36. TABLE 20 ASIA-PACIFIC: PHEOCHROMOCYTOMA MARKET, BY TREATMENT TYPE, 2020-2027(USD MILLION)
    37. TABLE 21 ASIA-PACIFIC: PHEOCHROMOCYTOMA MARKET, BY END USER, 2020-2027(USD MILLION)
    38. TABLE 22 MIDDLE EAST & AFRICA: PHEOCHROMOCYTOMA MARKET, BY TREATMENT TYPE, 2020-2027(USD MILLION)
    39. TABLE 23 MIDDLE EAST & AFRICA: PHEOCHROMOCYTOMA MARKET, BY END USER, 2020-2027(USD MILLION)
    40. LIST OF FIGURES
    41. FIGURE 1 RESEARCH PROCESS
    42. FIGURE 2 MARKET STRUCTURE FOR THE GLOBAL PHEOCHROMOCYTOMA MARKET
    43. FIGURE 3 MARKET DYNAMICS FOR THE GLOBAL PHEOCHROMOCYTOMA MARKET
    44. FIGURE 4 GLOBAL PHEOCHROMOCYTOMA MARKET SHARE, BY TREATMENT TYPE, 2020 (%)
    45. FIGURE 5 GLOBAL PHEOCHROMOCYTOMA MARKET SHARE, BY END USER, 2020 (%)
    46. FIGURE 6 GLOBAL PHEOCHROMOCYTOMA MARKET SHARE, BY REGION, 2020 (%)
    47. FIGURE 7 AMERICAS: PHEOCHROMOCYTOMA MARKET SHARE BY REGION, 2020 (%)
    48. FIGURE 7 NORTH AMERICA: PHEOCHROMOCYTOMA MARKET SHARE, BY COUNTRY, 2020 (%)
    49. FIGURE 8 EUROPE: PHEOCHROMOCYTOMA MARKET SHARE, BY REGION, 2020 (%)
    50. FIGURE 9 WESTERN EUROPE: PHEOCHROMOCYTOMA MARKET SHARE, BY COUNTRY, 2020 (%)
    51. FIGURE 10 ASIA-PACIFIC: PHEOCHROMOCYTOMA MARKET SHARE, BY COUNTRY, 2020 (%)
    52. FIGURE 11 MIDDLE EAST & AFRICA: PHEOCHROMOCYTOMA MARKET SHARE, BY COUNTRY, 2020 (%)
    53. FIGURE 12 GLOBAL PHEOCHROMOCYTOMA MARKET: COMPANY SHARE ANALYSIS, 2020 (%)
    54. FIGURE 13 PFIZER, INC..: KEY FINANCIALS
    55. FIGURE 14 PFIZER, INC.: SEGMENTAL REVENUE
    56. FIGURE 15 PFIZER, INC.: REGIONAL REVENUE
    57. FIGURE 16 TEVA PHARMACEUTICALS COMPANY LIMITED: KEY FINANCIALS
    58. FIGURE 17 TEVA PHARMACEUTICALS COMPANY LIMITED: SEGMENTAL REVENUE
    59. FIGURE 18 TEVA PHARMACEUTICALS COMPANY LIMITED: REGIONAL REVENUE
    60. FIGURE 19 ZYDUS CADILA: KEY FINANCIALS
    61. FIGURE 20 ZYDUS CADILA: SEGMENTAL REVENUE
    62. FIGURE 21 ZYDUS CADILA: REGIONAL REVENUE
    63. FIGURE 22 NOVARTIS AG: KEY FINANCIALS
    64. FIGURE 23 NOVARTIS AG: SEGMENTAL REVENUE
    65. FIGURE 24 NOVARTIS AG: REGIONAL REVENUE
    66. FIGURE 25 CURIUM PHARMA: KEY FINANCIALS
    67. FIGURE 26 CURIUM PHARMA: SEGMENTAL REVENUE
    68. FIGURE 27 CURIUM PHARMA: REGIONAL REVENUE
    69. FIGURE 28 JUBILANT CADISTA: KEY FINANCIALS
    70. FIGURE 29 JUBILANT CADISTA: SEGMENTAL REVENUE
    71. FIGURE 30 JUBILANT CADISTA: REGIONAL REVENUE
    72. FIGURE 31 ASTRAZENECA: KEY FINANCIALS
    73. FIGURE 32 ASTRAZENECA: SEGMENTAL REVENUE
    74. FIGURE 33 ASTRAZENECA: REGIONAL REVENUE
    75. FIGURE 34 MYLAN N.V.: KEY FINANCIALS
    76. FIGURE 35 MYLAN N.V.: SEGMENTAL REVENUE
    77. FIGURE 36 MYLAN N.V.: REGIONAL REVENUE
    78. FIGURE 37 APOTEX INC.: KEY FINANCIALS
    79. FIGURE 38 APOTEX INC.: SEGMENTAL REVENUE
    80. FIGURE 39 APOTEX INC.: REGIONAL REVENUE
    81. FIGURE 40 DR. REDDY’S LABORATORIES LTD: KEY FINANCIALS
    82. FIGURE 41 DR. REDDY’S LABORATORIES LTD: SEGMENTAL REVENUE
    83. FIGURE 42 DR. REDDY’S LABORATORIES LTD: REGIONAL REVENUE
    84. FIGURE 43 LUPIN: KEY FINANCIALS
    85. FIGURE 44 LUPIN: SEGMENTAL REVENUE
    86. FIGURE 45 LUPIN: REGIONAL REVENUE
    87. FIGURE 46 GLENMARK PHARMACEUTICALS LIMITED: KEY FINANCIALS
    88. FIGURE 47 GLENMARK PHARMACEUTICALS LIMITED: SEGMENTAL REVENUE
    89. FIGURE 48 GLENMARK PHARMACEUTICALS LIMITED: REGIONAL REVENUE

    Pheochromocytoma Market Segmentation

    Market Segmentation Overview

    • Detailed segmentation data will be available in the full report
    • Comprehensive analysis by multiple parameters
    • Regional and country-level breakdowns
    • Market size forecasts by segment
    Infographic

    Free Sample Request

    Kindly complete the form below to receive a free sample of this Report

    Get Free Sample

    Customer Strories

    “I am very pleased with how market segments have been defined in a relevant way for my purposes (such as "Portable Freezers & refrigerators" and "last-mile"). In general the report is well structured. Thanks very much for your efforts.”

    Victoria Milne

    Founder
    Case Study
    Chemicals and Materials